Big Data Analytics Report: Analysis of Price Paid Dataset - IMAT5322
VerifiedAdded on 2022/08/16
|12
|3288
|14
Report
AI Summary
This report details a Big Data Analytics project utilizing Apache Spark to analyze a property sales dataset from the UK's HM Land Registry. The assignment involves preprocessing the data, defining attributes, and performing various data analytics tasks using PySpark SQL. The analysis includes calculating total sales value, counts, and average sale prices by postcode, identifying top postcodes based on different metrics, and exploring data frame aggregation functions. The study concludes with insights derived from the analysis of the dataset, highlighting the effectiveness of Spark SQL API and data frame aggregation functions. The project aims to provide a comprehensive understanding of how Spark can be used to analyze large datasets and derive meaningful insights from them. The student has submitted this report for publication on Desklib, a platform offering AI-powered study tools.
Running head: BIG DATA ANALYTICS
Big Data Analytics
Student Name:
Student ID:
University Name:
Paper Code:
Big Data Analytics
Student Name:
Student ID:
University Name:
Paper Code:
Paraphrase This Document
Need a fresh take? Get an instant paraphrase of this document with our AI Paraphraser
2BIG DATA ANALYTICS
Executive Summary
One of the latest technology in demand big data, generally using such technology large dataset
are being analyzed to discover hidden patterns in the dataset also the correlation of the attributes
are been analyzed and also to find depth insights of the dataset. Now with the evolving
technology it has now become possible to analyze the dataset properly and get the required
answer immediately and in no time. In the analysis the dataset used is the price paid dataset that
contains detailed information regarding the property sale which was organized in England and
Wales that are sold for value and are logged for registration which was actually taken and
downloaded from data.gov.uk website. HM Land registry consist of huge transactions on daily
basis, thus the dataset includes the transaction information which has been considered from the
very first day to the end day or the final day for the specific month. The file was currently
updated in January 2020. The dataset is updated on monthly basis. Practical implementation
utilizing Apache Spark core to analyze a large dataset is been performed in this experiment. The
assignment contains in depth analysis of the dataset to understand the data properly. At the end
few conclusion will be concluded regarding the analysis performed over the dataset.
3BIG DATA ANALYTICS
Table of Contents
Executive Summary.........................................................................................................................2
Introduction......................................................................................................................................4
Discussion........................................................................................................................................4
Preprocessing of data...............................................................................................................5
Data Definition........................................................................................................................5
Data Analytics.........................................................................................................................7
Conclusion.....................................................................................................................................10
Reference.......................................................................................................................................11
⊘ This is a preview!⊘
Do you want full access?
Subscribe today to unlock all pages.
Trusted by 1+ million students worldwide
4BIG DATA ANALYTICS
Introduction
With the recent evolution of technology, large dataset is being analyzed to discover
hidden patterns in the dataset also the correlation of the attributes is been analyzed and also to
find depth insights of the dataset (Armbrust et al., 2015). Now with the evolving technology it
has now become possible to analyze the dataset properly and get the required answer
immediately and in no time. Big data analytics helps many organizations to understand the data
in much better and informatics way and to identify the essential and crucial information which
are important to the business and future business decisions (Karau et al., 2015).
Python and spark is been considered as the buzz word nowadays. Spark is been used
nowadays in the analytics industries for processing and getting knowledge of large dataset
(Zaharia et al., 2016). Spark is considered to be an open source framework which is responsible
for smoothly pre-processing with high speed and it does support various languages like python,
java and R programming. Python is a great programming language which is widely used for
analysis and prediction purposes (Zhu et al., 2018).
Pyspark is considered to be one of the best language to perform different exploratory data
analysis and also for building machine learning pipeline which is also one of the major part done
using pyspark using huge volumes of data (Guller, 2015). In PySpark the major datatype used is
the Spark data frame (Aubin, Saunier and Miranda-Moreno, 2015). Also another way is to use
inbuilt Pandas library which will automatically convert into dataframe using toPandas() in the
Spark dataframe which will eventually a pandas object (Karau et al., 2015). Also it should be
kept in mind these function should not be used frequently for small data frames as it will
eventually pulls the entire into the memory space which is available on a single node.
Discussion
In the analysis the dataset includes the transactions received at HM Land Registry which
has been considered from the very first day to the end day or the final day for the specific month.
The file was currently updated in January 2020. The dataset is updated on monthly basis.
Practical implementation utilizing Apache Spark core to analyze a large dataset is been
performed in this experiment. The assignment contains in depth analysis of the dataset to
understand the data properly.
Paraphrase This Document
Need a fresh take? Get an instant paraphrase of this document with our AI Paraphraser
5BIG DATA ANALYTICS
Preprocessing of data
The dataset has been downloaded from the official website of the UK govt. dataset. In
England and Wales for tracking the land and property sales, HM Land Registry price paid data is
been submitted for registration (Shoro and Soomro, 2015). Some of the major hypothesis which
includes-
Old properties will have less price then new one.
Terrace and semidetached property will have more price compared to flat one.
City property prices will be more.
Recent property price will be more compared to past.
County and District also have impact on property price.
The processing and the result will be based on the queries that will be used during the whole
experiment using pyspark SQL (Zaharia et al., 2016).
Data Definition
The dataset contains mainly 15 attributes each of the attributes are explained below with
proper understanding-
transaction_uid- Transaction unique identifier a reference number which is generated
automatically recording each published sale. The number is unique and will change each time a
sale is recorded.
sale_price- Price Sale price stated on the transfer deed.
date_of_transfer- Date of Transfer Date when the sale was completed, as stated on the transfer
deed.
Postcode- Individual postcode for every transaction id
property_type- Property Type D = Detached, S = Semi-Detached, T = Terraced, F =
Flats/Maisonettes, O = Other
Note that:
Only the above categories are recorded to describe property type, we do not separately identify
bungalows.
6BIG DATA ANALYTICS
End-of-terrace properties are included in the Terraced category above.
‘Other’ is only valid where the transaction relates to a property type that is not covered by
existing values.
Old/New Indicates the age of the property and applies to all price paid transactions, residential
and non-residential.
old_new- Y = a newly built property, N = an established residential building.
Duration- Duration Relates to the tenure: F = Freehold, L= Leasehold etc.
Town/City
District
County
PPD Category Type Indicates the type of Price Paid transaction.
A = Standard Price Paid entry, includes single residential property sold for full market value.
B = Additional Price Paid entry including transfers under a power of sale/repossessions, buy-to-
lets (where they can be identified by a Mortgage) and transfers to non-private individuals. Note
that category B does not separately identify the transaction types stated.
Record Status - monthly file only Indicates additions, changes and deletions to the records. (see
guide below).
A = Addition
C = Change
D = Delete.
Note that where a transaction changes category type due to misallocation (as above) it
will be deleted from the original category type and added to the correct category with a new
transaction unique identifier.
The data types are listed below-
ransaction_uid: string (nullable = true)
sale_price: double (nullable = true)
date_of_transfer: string (nullable = true)
⊘ This is a preview!⊘
Do you want full access?
Subscribe today to unlock all pages.
Trusted by 1+ million students worldwide
7BIG DATA ANALYTICS
postcode: string (nullable = true)
property_type: string (nullable = true)
old_new: string (nullable = true)
duration: string (nullable = true)
paon: string (nullable = true)
saon: string (nullable = true)
street: string (nullable = true)
locality: string (nullable = true)
city: string (nullable = true)
district: string (nullable = true)
county: string (nullable = true)
record_status: string (nullable = true)
Data Analytics
At first all the libraries which are required for the analysis have been imported from
pyspark package which is inside of python spark module. The dataset used doesn’t contains any
header or it can be said that the dataset has not attribute name in it (Mishra, 2018). Thus, to
analyze it is crucial to put all the required attributes name. All the attributes name has been listed
above.
At first load CSV file as an RDD and convert to a DataFrame
Spark SQL does not currently provide a built-in function to load CSV, so we do this
manually using sc.textFile().
This creates an RDD, as usual.
We then map the data rows to tuples ready for converting to a DataFrame.
We also provide a set of fields (column) definitions that will define the schema.
These data rows and column definitions are then combined to create a DataFrame.
Data’s are been fetched using sql queries and it should be taken into consideration that-
SQL can be run over DataFrames that have been registered as a table.
Bear in mind that the SQL is not parsed or validated until runtime.
For example, fetch total sales value, count and average sale price by postcode.
Now it will be analyzed which postcode are among the top in terms of sales. In this case
we use the show () function rather than println() to display the chosen records directly
(Reyes-Ortiz, Oneto and Anguita, 2015). Data values are left in the internal numeric format
for now.
Paraphrase This Document
Need a fresh take? Get an instant paraphrase of this document with our AI Paraphraser
8BIG DATA ANALYTICS
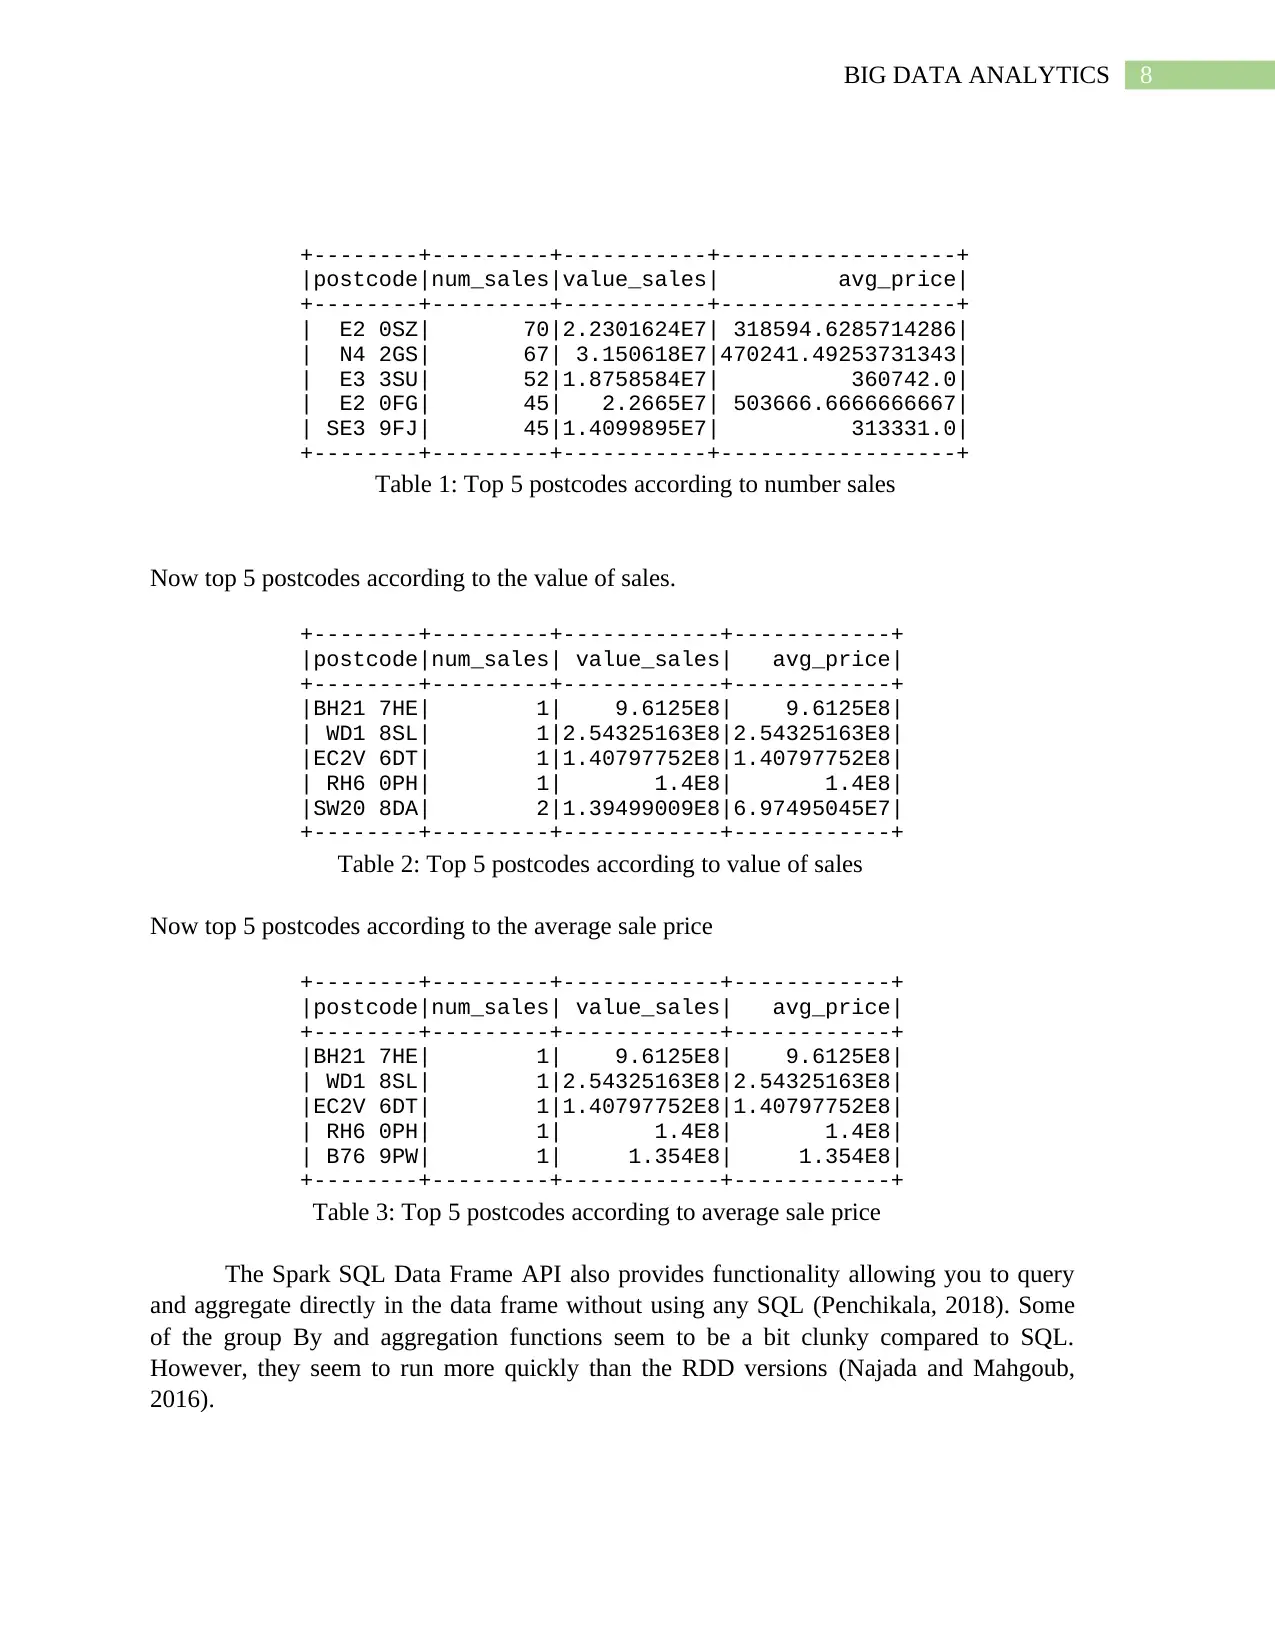
+--------+---------+-----------+------------------+
|postcode|num_sales|value_sales| avg_price|
+--------+---------+-----------+------------------+
| E2 0SZ| 70|2.2301624E7| 318594.6285714286|
| N4 2GS| 67| 3.150618E7|470241.49253731343|
| E3 3SU| 52|1.8758584E7| 360742.0|
| E2 0FG| 45| 2.2665E7| 503666.6666666667|
| SE3 9FJ| 45|1.4099895E7| 313331.0|
+--------+---------+-----------+------------------+
Table 1: Top 5 postcodes according to number sales
Now top 5 postcodes according to the value of sales.
+--------+---------+------------+------------+
|postcode|num_sales| value_sales| avg_price|
+--------+---------+------------+------------+
|BH21 7HE| 1| 9.6125E8| 9.6125E8|
| WD1 8SL| 1|2.54325163E8|2.54325163E8|
|EC2V 6DT| 1|1.40797752E8|1.40797752E8|
| RH6 0PH| 1| 1.4E8| 1.4E8|
|SW20 8DA| 2|1.39499009E8|6.97495045E7|
+--------+---------+------------+------------+
Table 2: Top 5 postcodes according to value of sales
Now top 5 postcodes according to the average sale price
+--------+---------+------------+------------+
|postcode|num_sales| value_sales| avg_price|
+--------+---------+------------+------------+
|BH21 7HE| 1| 9.6125E8| 9.6125E8|
| WD1 8SL| 1|2.54325163E8|2.54325163E8|
|EC2V 6DT| 1|1.40797752E8|1.40797752E8|
| RH6 0PH| 1| 1.4E8| 1.4E8|
| B76 9PW| 1| 1.354E8| 1.354E8|
+--------+---------+------------+------------+
Table 3: Top 5 postcodes according to average sale price
The Spark SQL Data Frame API also provides functionality allowing you to query
and aggregate directly in the data frame without using any SQL (Penchikala, 2018). Some
of the group By and aggregation functions seem to be a bit clunky compared to SQL.
However, they seem to run more quickly than the RDD versions (Najada and Mahgoub,
2016).
+--------+---------+-----------+------------------+
|postcode|num_sales|value_sales| avg_price|
+--------+---------+-----------+------------------+
| E2 0SZ| 70|2.2301624E7| 318594.6285714286|
| N4 2GS| 67| 3.150618E7|470241.49253731343|
| E3 3SU| 52|1.8758584E7| 360742.0|
| E2 0FG| 45| 2.2665E7| 503666.6666666667|
| SE3 9FJ| 45|1.4099895E7| 313331.0|
+--------+---------+-----------+------------------+
Table 1: Top 5 postcodes according to number sales
Now top 5 postcodes according to the value of sales.
+--------+---------+------------+------------+
|postcode|num_sales| value_sales| avg_price|
+--------+---------+------------+------------+
|BH21 7HE| 1| 9.6125E8| 9.6125E8|
| WD1 8SL| 1|2.54325163E8|2.54325163E8|
|EC2V 6DT| 1|1.40797752E8|1.40797752E8|
| RH6 0PH| 1| 1.4E8| 1.4E8|
|SW20 8DA| 2|1.39499009E8|6.97495045E7|
+--------+---------+------------+------------+
Table 2: Top 5 postcodes according to value of sales
Now top 5 postcodes according to the average sale price
+--------+---------+------------+------------+
|postcode|num_sales| value_sales| avg_price|
+--------+---------+------------+------------+
|BH21 7HE| 1| 9.6125E8| 9.6125E8|
| WD1 8SL| 1|2.54325163E8|2.54325163E8|
|EC2V 6DT| 1|1.40797752E8|1.40797752E8|
| RH6 0PH| 1| 1.4E8| 1.4E8|
| B76 9PW| 1| 1.354E8| 1.354E8|
+--------+---------+------------+------------+
Table 3: Top 5 postcodes according to average sale price
The Spark SQL Data Frame API also provides functionality allowing you to query
and aggregate directly in the data frame without using any SQL (Penchikala, 2018). Some
of the group By and aggregation functions seem to be a bit clunky compared to SQL.
However, they seem to run more quickly than the RDD versions (Najada and Mahgoub,
2016).
9BIG DATA ANALYTICS
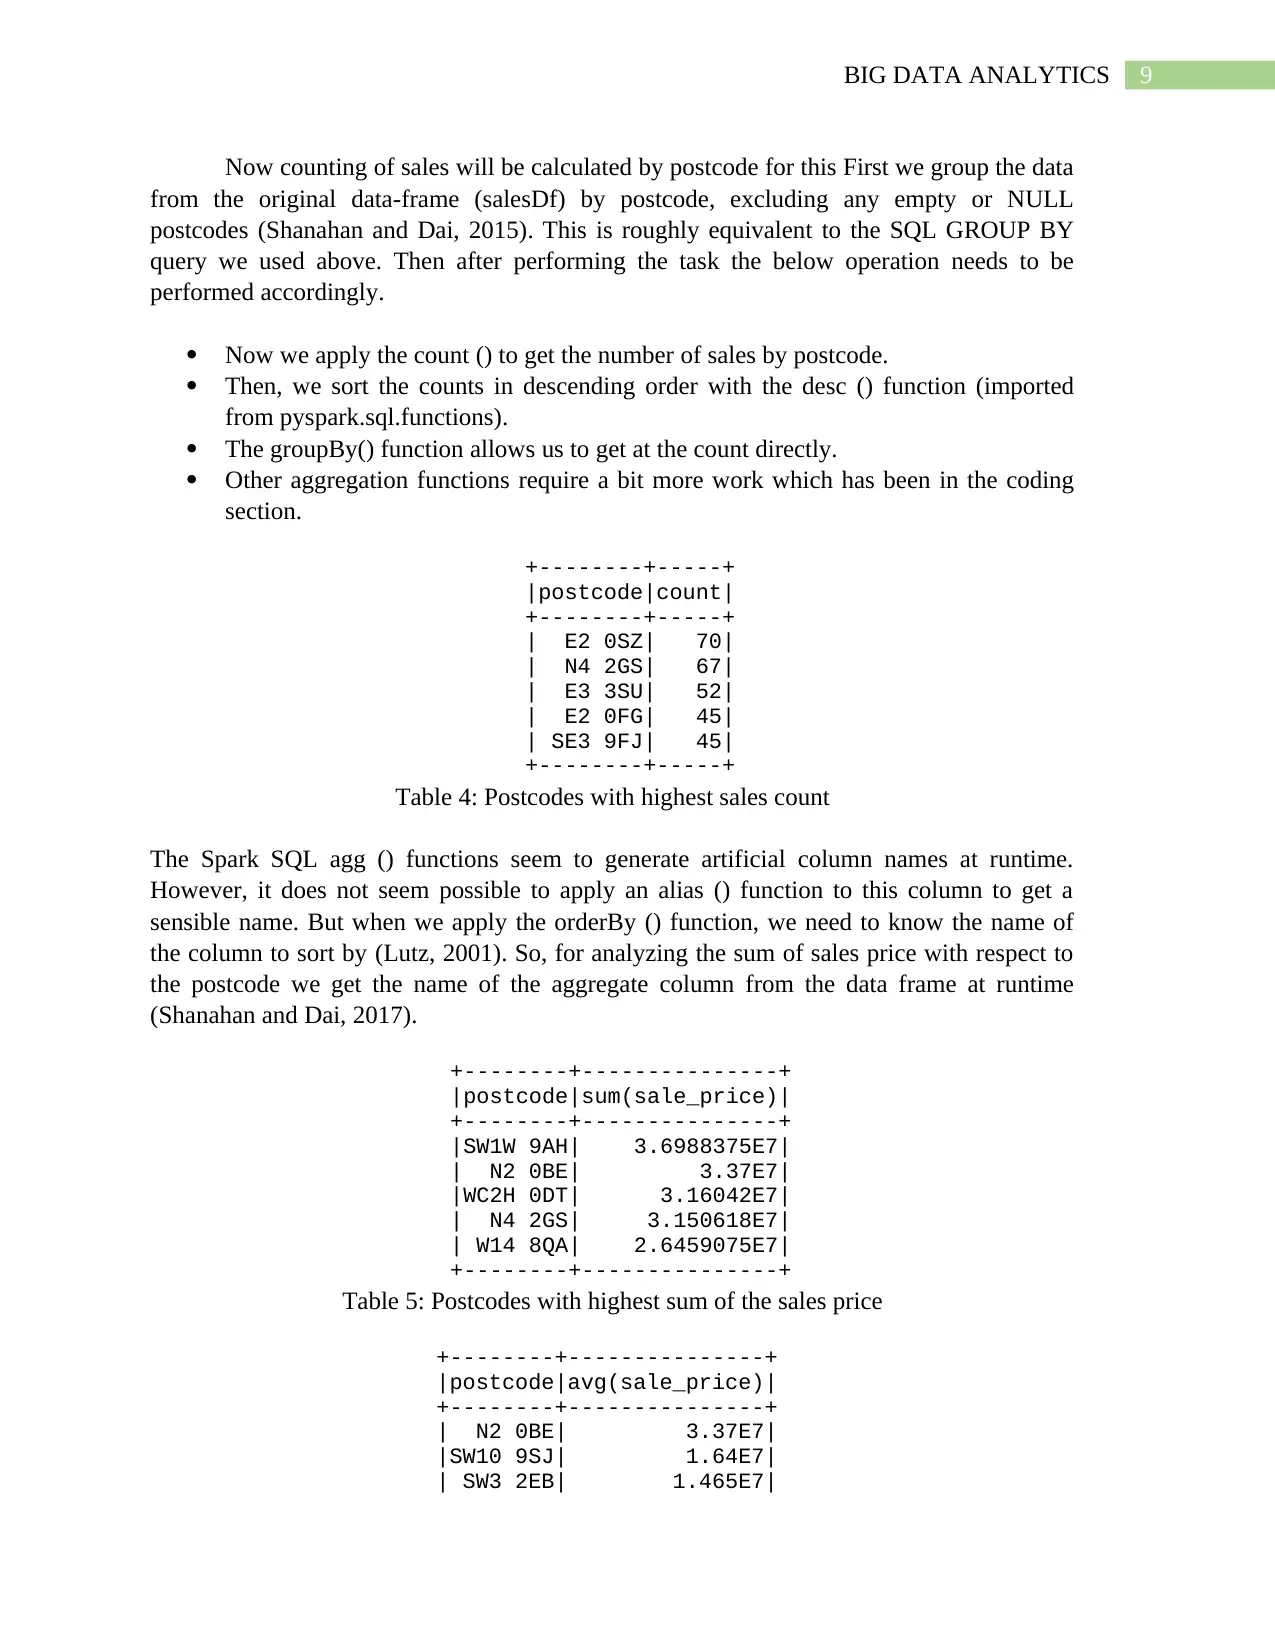
Now counting of sales will be calculated by postcode for this First we group the data
from the original data-frame (salesDf) by postcode, excluding any empty or NULL
postcodes (Shanahan and Dai, 2015). This is roughly equivalent to the SQL GROUP BY
query we used above. Then after performing the task the below operation needs to be
performed accordingly.
Now we apply the count () to get the number of sales by postcode.
Then, we sort the counts in descending order with the desc () function (imported
from pyspark.sql.functions).
The groupBy() function allows us to get at the count directly.
Other aggregation functions require a bit more work which has been in the coding
section.
+--------+-----+
|postcode|count|
+--------+-----+
| E2 0SZ| 70|
| N4 2GS| 67|
| E3 3SU| 52|
| E2 0FG| 45|
| SE3 9FJ| 45|
+--------+-----+
Table 4: Postcodes with highest sales count
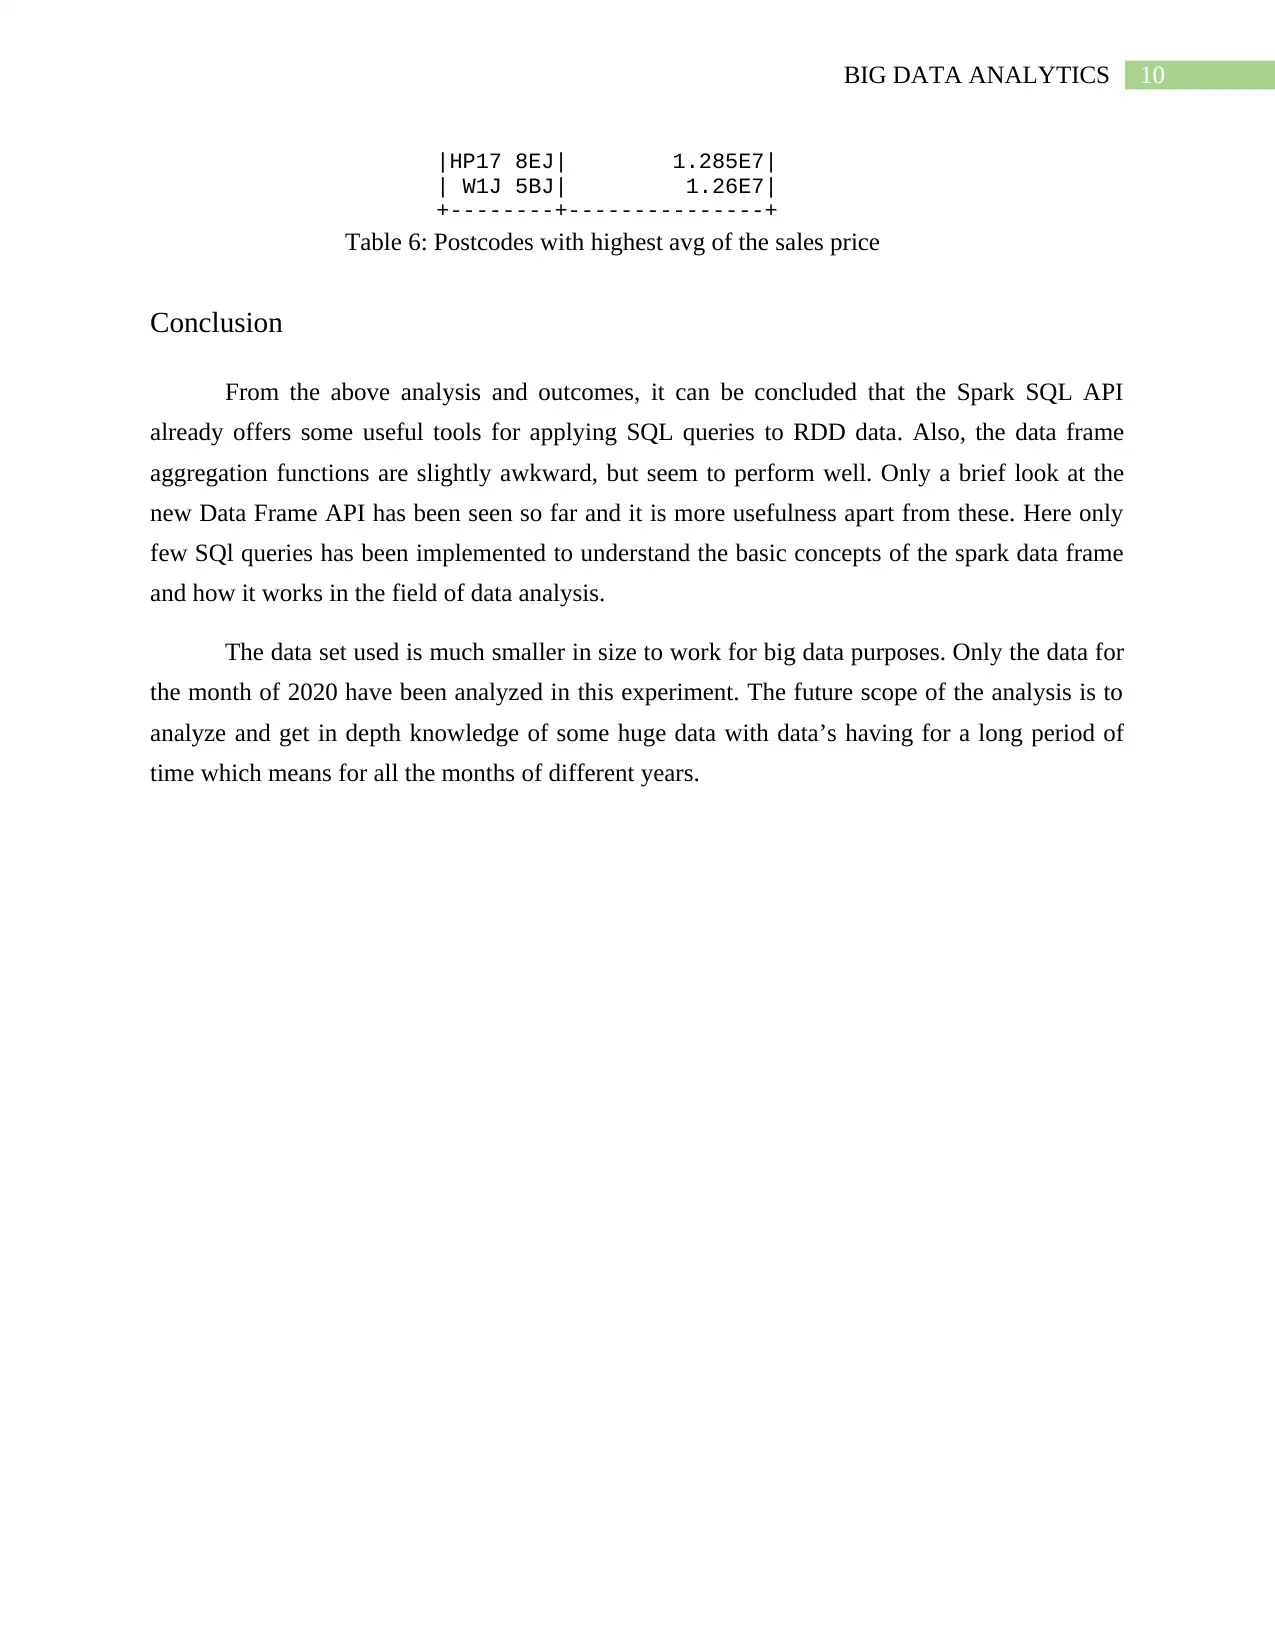
The Spark SQL agg () functions seem to generate artificial column names at runtime.
However, it does not seem possible to apply an alias () function to this column to get a
sensible name. But when we apply the orderBy () function, we need to know the name of
the column to sort by (Lutz, 2001). So, for analyzing the sum of sales price with respect to
the postcode we get the name of the aggregate column from the data frame at runtime
(Shanahan and Dai, 2017).
+--------+---------------+
|postcode|sum(sale_price)|
+--------+---------------+
|SW1W 9AH| 3.6988375E7|
| N2 0BE| 3.37E7|
|WC2H 0DT| 3.16042E7|
| N4 2GS| 3.150618E7|
| W14 8QA| 2.6459075E7|
+--------+---------------+
Table 5: Postcodes with highest sum of the sales price
+--------+---------------+
|postcode|avg(sale_price)|
+--------+---------------+
| N2 0BE| 3.37E7|
|SW10 9SJ| 1.64E7|
| SW3 2EB| 1.465E7|
Now counting of sales will be calculated by postcode for this First we group the data
from the original data-frame (salesDf) by postcode, excluding any empty or NULL
postcodes (Shanahan and Dai, 2015). This is roughly equivalent to the SQL GROUP BY
query we used above. Then after performing the task the below operation needs to be
performed accordingly.
Now we apply the count () to get the number of sales by postcode.
Then, we sort the counts in descending order with the desc () function (imported
from pyspark.sql.functions).
The groupBy() function allows us to get at the count directly.
Other aggregation functions require a bit more work which has been in the coding
section.
+--------+-----+
|postcode|count|
+--------+-----+
| E2 0SZ| 70|
| N4 2GS| 67|
| E3 3SU| 52|
| E2 0FG| 45|
| SE3 9FJ| 45|
+--------+-----+
Table 4: Postcodes with highest sales count
The Spark SQL agg () functions seem to generate artificial column names at runtime.
However, it does not seem possible to apply an alias () function to this column to get a
sensible name. But when we apply the orderBy () function, we need to know the name of
the column to sort by (Lutz, 2001). So, for analyzing the sum of sales price with respect to
the postcode we get the name of the aggregate column from the data frame at runtime
(Shanahan and Dai, 2017).
+--------+---------------+
|postcode|sum(sale_price)|
+--------+---------------+
|SW1W 9AH| 3.6988375E7|
| N2 0BE| 3.37E7|
|WC2H 0DT| 3.16042E7|
| N4 2GS| 3.150618E7|
| W14 8QA| 2.6459075E7|
+--------+---------------+
Table 5: Postcodes with highest sum of the sales price
+--------+---------------+
|postcode|avg(sale_price)|
+--------+---------------+
| N2 0BE| 3.37E7|
|SW10 9SJ| 1.64E7|
| SW3 2EB| 1.465E7|
⊘ This is a preview!⊘
Do you want full access?
Subscribe today to unlock all pages.
Trusted by 1+ million students worldwide
10BIG DATA ANALYTICS
|HP17 8EJ| 1.285E7|
| W1J 5BJ| 1.26E7|
+--------+---------------+
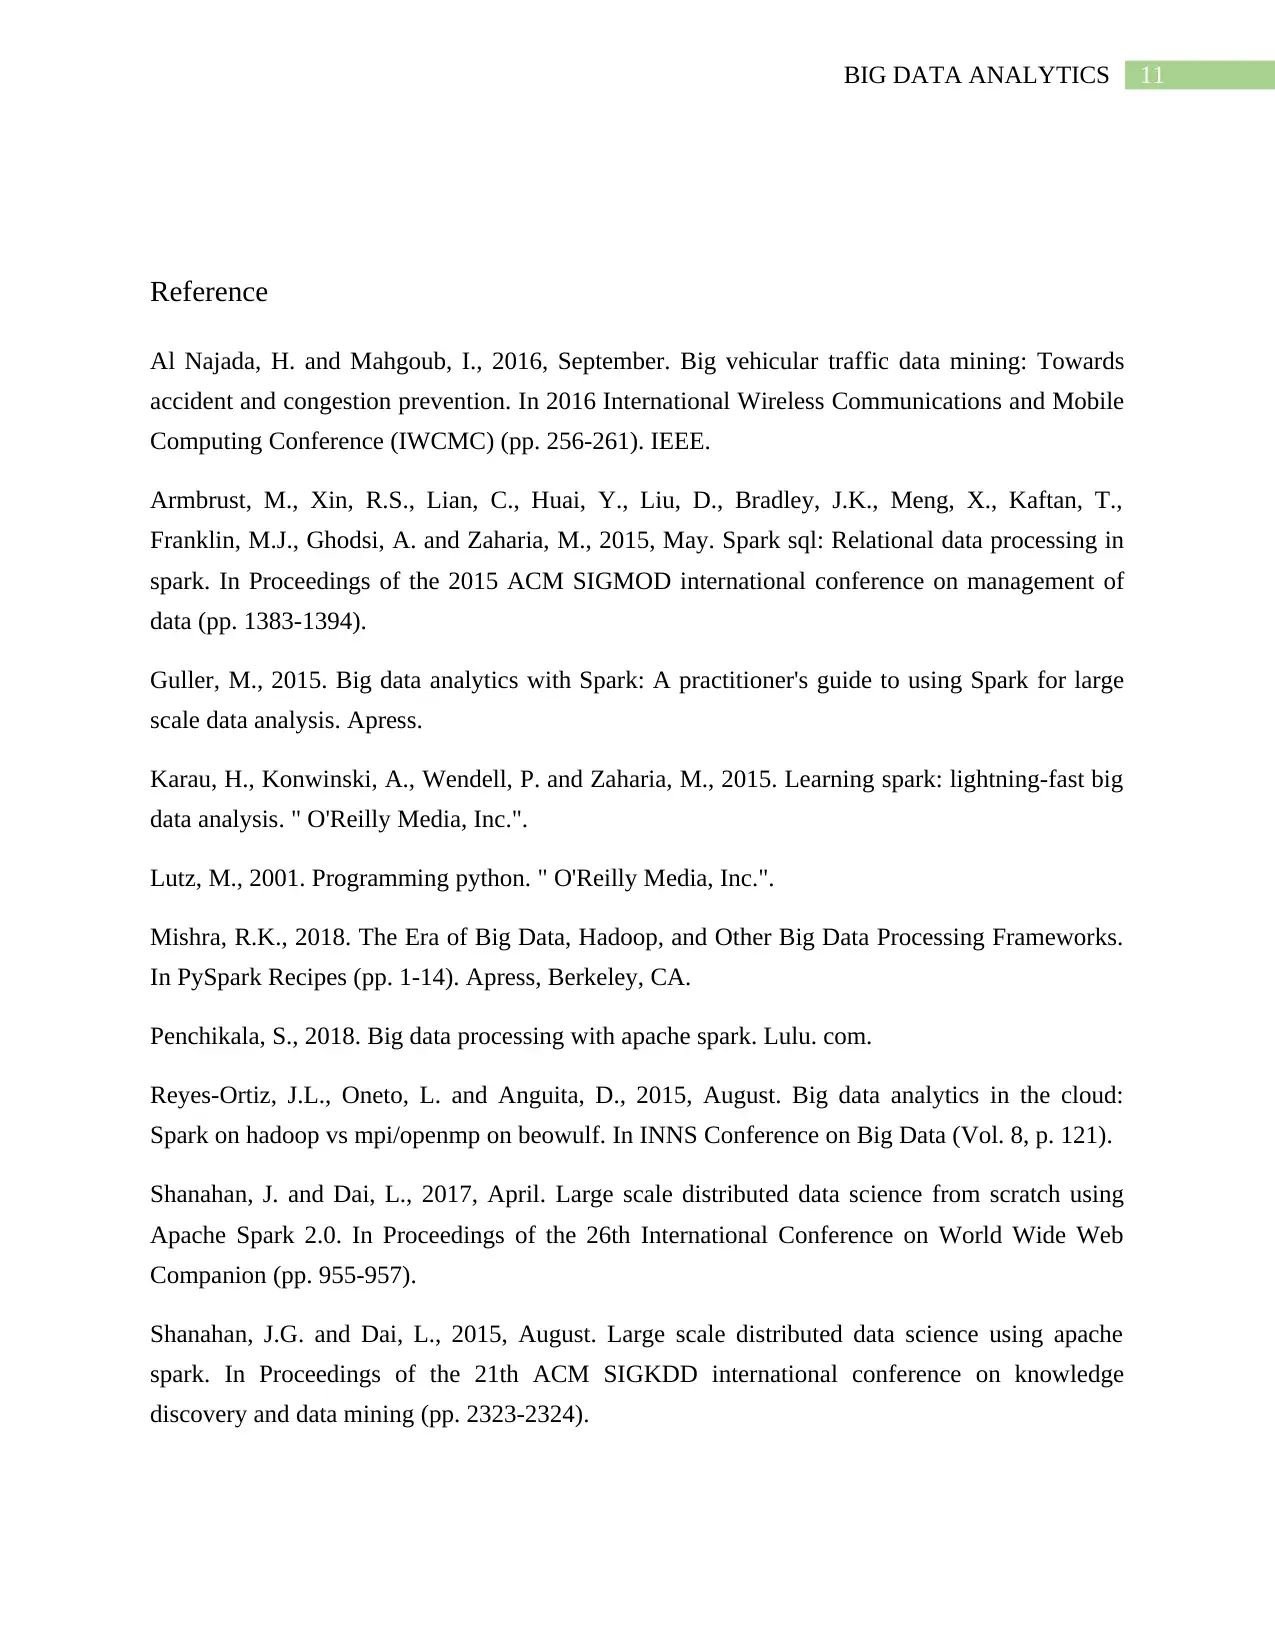
Table 6: Postcodes with highest avg of the sales price
Conclusion
From the above analysis and outcomes, it can be concluded that the Spark SQL API
already offers some useful tools for applying SQL queries to RDD data. Also, the data frame
aggregation functions are slightly awkward, but seem to perform well. Only a brief look at the
new Data Frame API has been seen so far and it is more usefulness apart from these. Here only
few SQl queries has been implemented to understand the basic concepts of the spark data frame
and how it works in the field of data analysis.
The data set used is much smaller in size to work for big data purposes. Only the data for
the month of 2020 have been analyzed in this experiment. The future scope of the analysis is to
analyze and get in depth knowledge of some huge data with data’s having for a long period of
time which means for all the months of different years.
|HP17 8EJ| 1.285E7|
| W1J 5BJ| 1.26E7|
+--------+---------------+
Table 6: Postcodes with highest avg of the sales price
Conclusion
From the above analysis and outcomes, it can be concluded that the Spark SQL API
already offers some useful tools for applying SQL queries to RDD data. Also, the data frame
aggregation functions are slightly awkward, but seem to perform well. Only a brief look at the
new Data Frame API has been seen so far and it is more usefulness apart from these. Here only
few SQl queries has been implemented to understand the basic concepts of the spark data frame
and how it works in the field of data analysis.
The data set used is much smaller in size to work for big data purposes. Only the data for
the month of 2020 have been analyzed in this experiment. The future scope of the analysis is to
analyze and get in depth knowledge of some huge data with data’s having for a long period of
time which means for all the months of different years.
Paraphrase This Document
Need a fresh take? Get an instant paraphrase of this document with our AI Paraphraser
11BIG DATA ANALYTICS
Reference
Al Najada, H. and Mahgoub, I., 2016, September. Big vehicular traffic data mining: Towards
accident and congestion prevention. In 2016 International Wireless Communications and Mobile
Computing Conference (IWCMC) (pp. 256-261). IEEE.
Armbrust, M., Xin, R.S., Lian, C., Huai, Y., Liu, D., Bradley, J.K., Meng, X., Kaftan, T.,
Franklin, M.J., Ghodsi, A. and Zaharia, M., 2015, May. Spark sql: Relational data processing in
spark. In Proceedings of the 2015 ACM SIGMOD international conference on management of
data (pp. 1383-1394).
Guller, M., 2015. Big data analytics with Spark: A practitioner's guide to using Spark for large
scale data analysis. Apress.
Karau, H., Konwinski, A., Wendell, P. and Zaharia, M., 2015. Learning spark: lightning-fast big
data analysis. " O'Reilly Media, Inc.".
Lutz, M., 2001. Programming python. " O'Reilly Media, Inc.".
Mishra, R.K., 2018. The Era of Big Data, Hadoop, and Other Big Data Processing Frameworks.
In PySpark Recipes (pp. 1-14). Apress, Berkeley, CA.
Penchikala, S., 2018. Big data processing with apache spark. Lulu. com.
Reyes-Ortiz, J.L., Oneto, L. and Anguita, D., 2015, August. Big data analytics in the cloud:
Spark on hadoop vs mpi/openmp on beowulf. In INNS Conference on Big Data (Vol. 8, p. 121).
Shanahan, J. and Dai, L., 2017, April. Large scale distributed data science from scratch using
Apache Spark 2.0. In Proceedings of the 26th International Conference on World Wide Web
Companion (pp. 955-957).
Shanahan, J.G. and Dai, L., 2015, August. Large scale distributed data science using apache
spark. In Proceedings of the 21th ACM SIGKDD international conference on knowledge
discovery and data mining (pp. 2323-2324).
12BIG DATA ANALYTICS
Shoro, A.G. and Soomro, T.R., 2015. Big data analysis: Apache spark perspective. Global
Journal of Computer Science and Technology.
St-Aubin, P., Saunier, N. and Miranda-Moreno, L., 2015. Large-scale automated proactive road
safety analysis using video data. Transportation Research Part C: Emerging Technologies, 58,
pp.363-379.
Zaharia, M., Xin, R.S., Wendell, P., Das, T., Armbrust, M., Dave, A., Meng, X., Rosen, J.,
Venkataraman, S., Franklin, M.J. and Ghodsi, A., 2016. Apache spark: a unified engine for big
data processing. Communications of the ACM, 59(11), pp.56-65.
Zaharia, M., Xin, R.S., Wendell, P., Das, T., Armbrust, M., Dave, A., Meng, X., Rosen, J.,
Venkataraman, S., Franklin, M.J. and Ghodsi, A., 2016. Apache spark: a unified engine for big
data processing. Communications of the ACM, 59(11), pp.56-65.
Zhu, L., Yu, F.R., Wang, Y., Ning, B. and Tang, T., 2018. Big data analytics in intelligent
transportation systems: A survey. IEEE Transactions on Intelligent Transportation Systems,
20(1), pp.383-398.
⊘ This is a preview!⊘
Do you want full access?
Subscribe today to unlock all pages.
Trusted by 1+ million students worldwide
1 out of 12
Related Documents


Your All-in-One AI-Powered Toolkit for Academic Success.
+13062052269
info@desklib.com
Available 24*7 on WhatsApp / Email
![[object Object]](/_next/static/media/star-bottom.7253800d.svg)
Unlock your academic potential
Copyright © 2020–2026 A2Z Services. All Rights Reserved. Developed and managed by ZUCOL.