Primark Clothing: Business Decision Making Report and Analysis
VerifiedAdded on 2023/01/12
|20
|3268
|80
Report
AI Summary
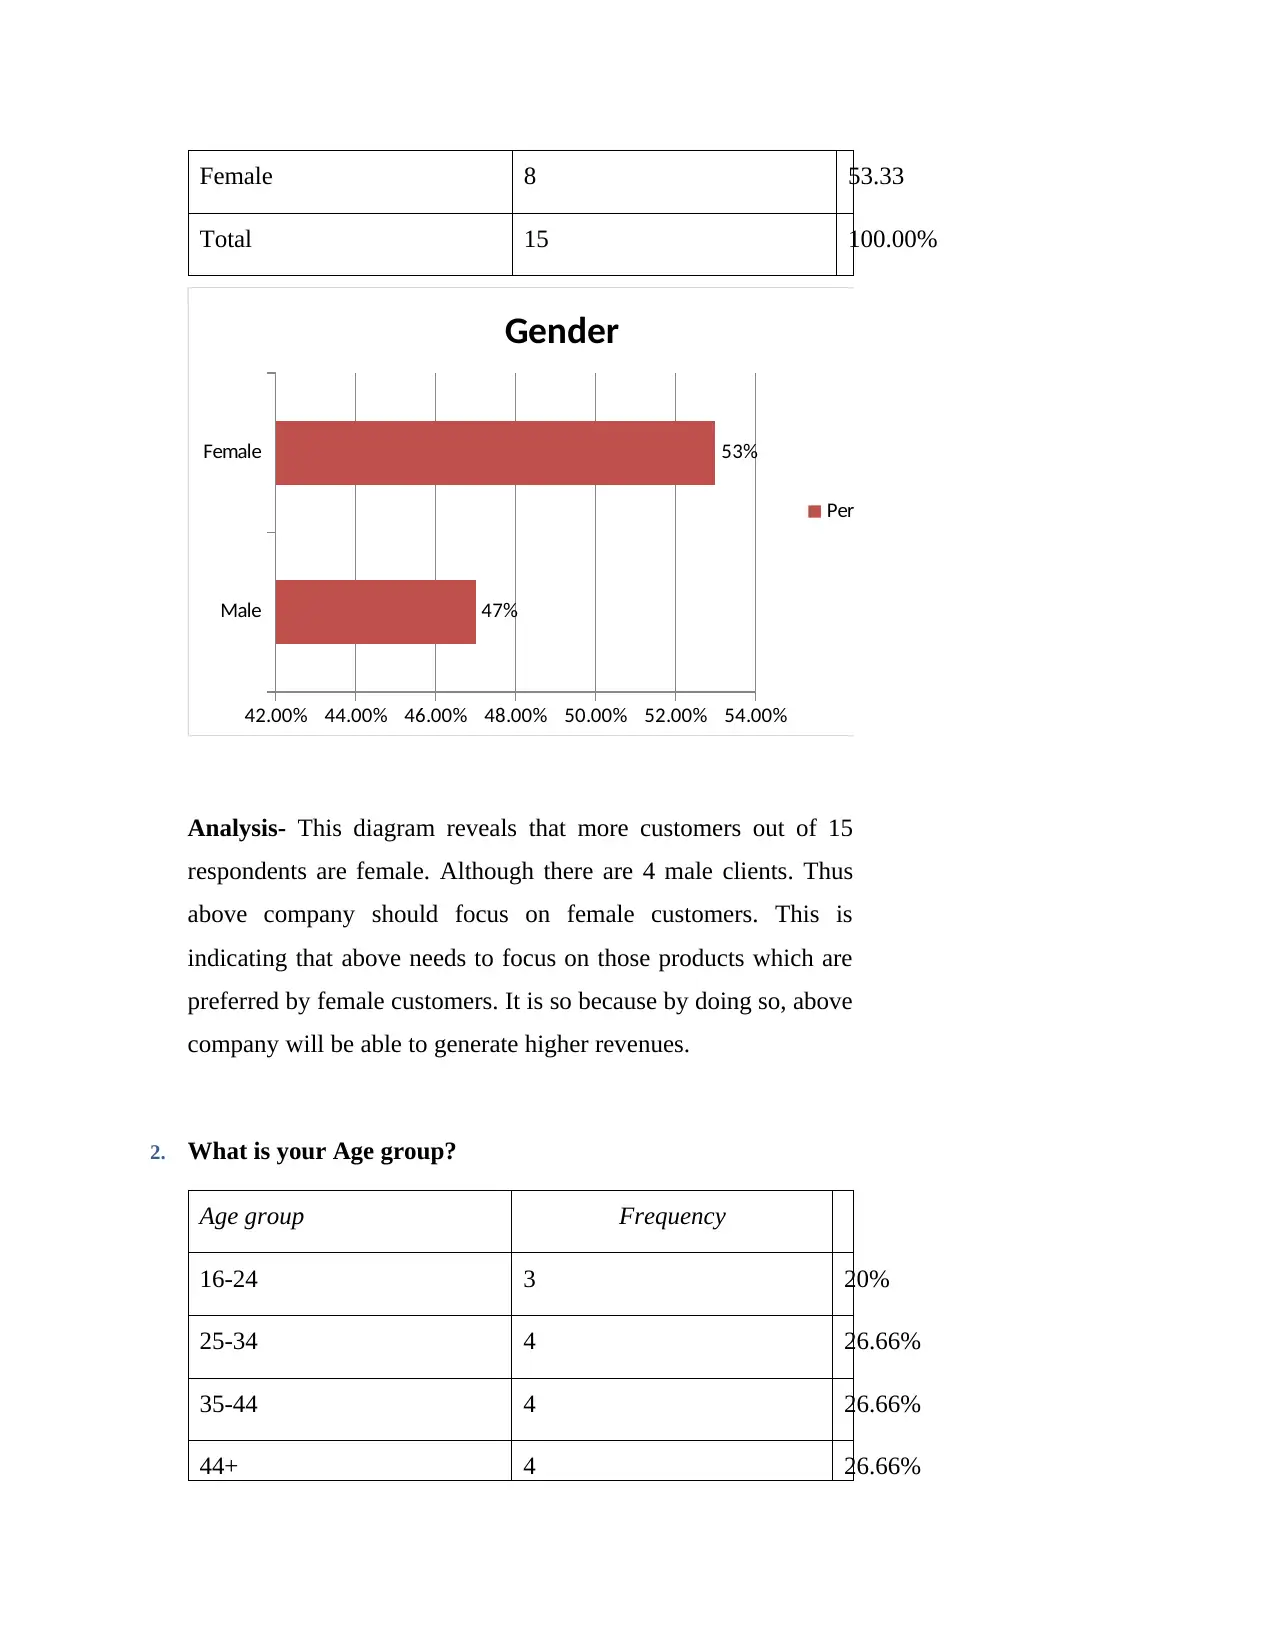
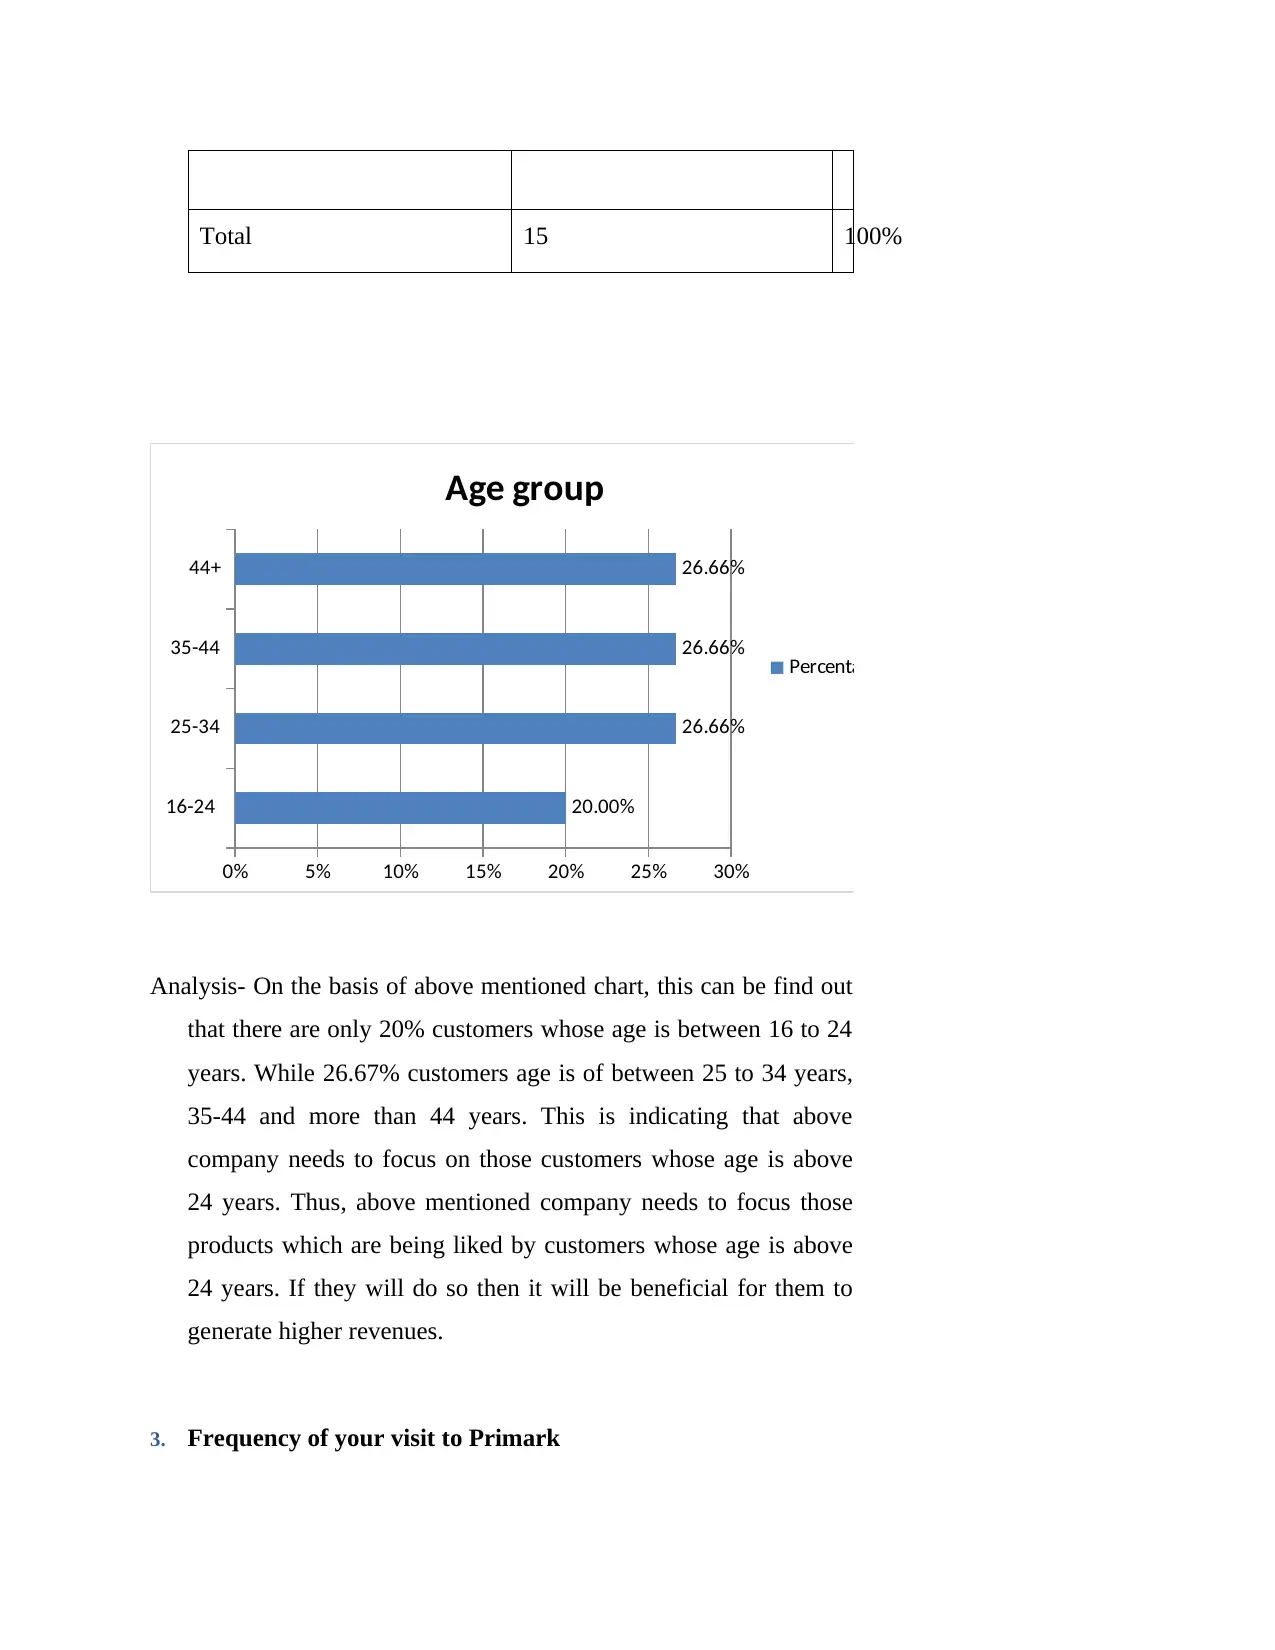
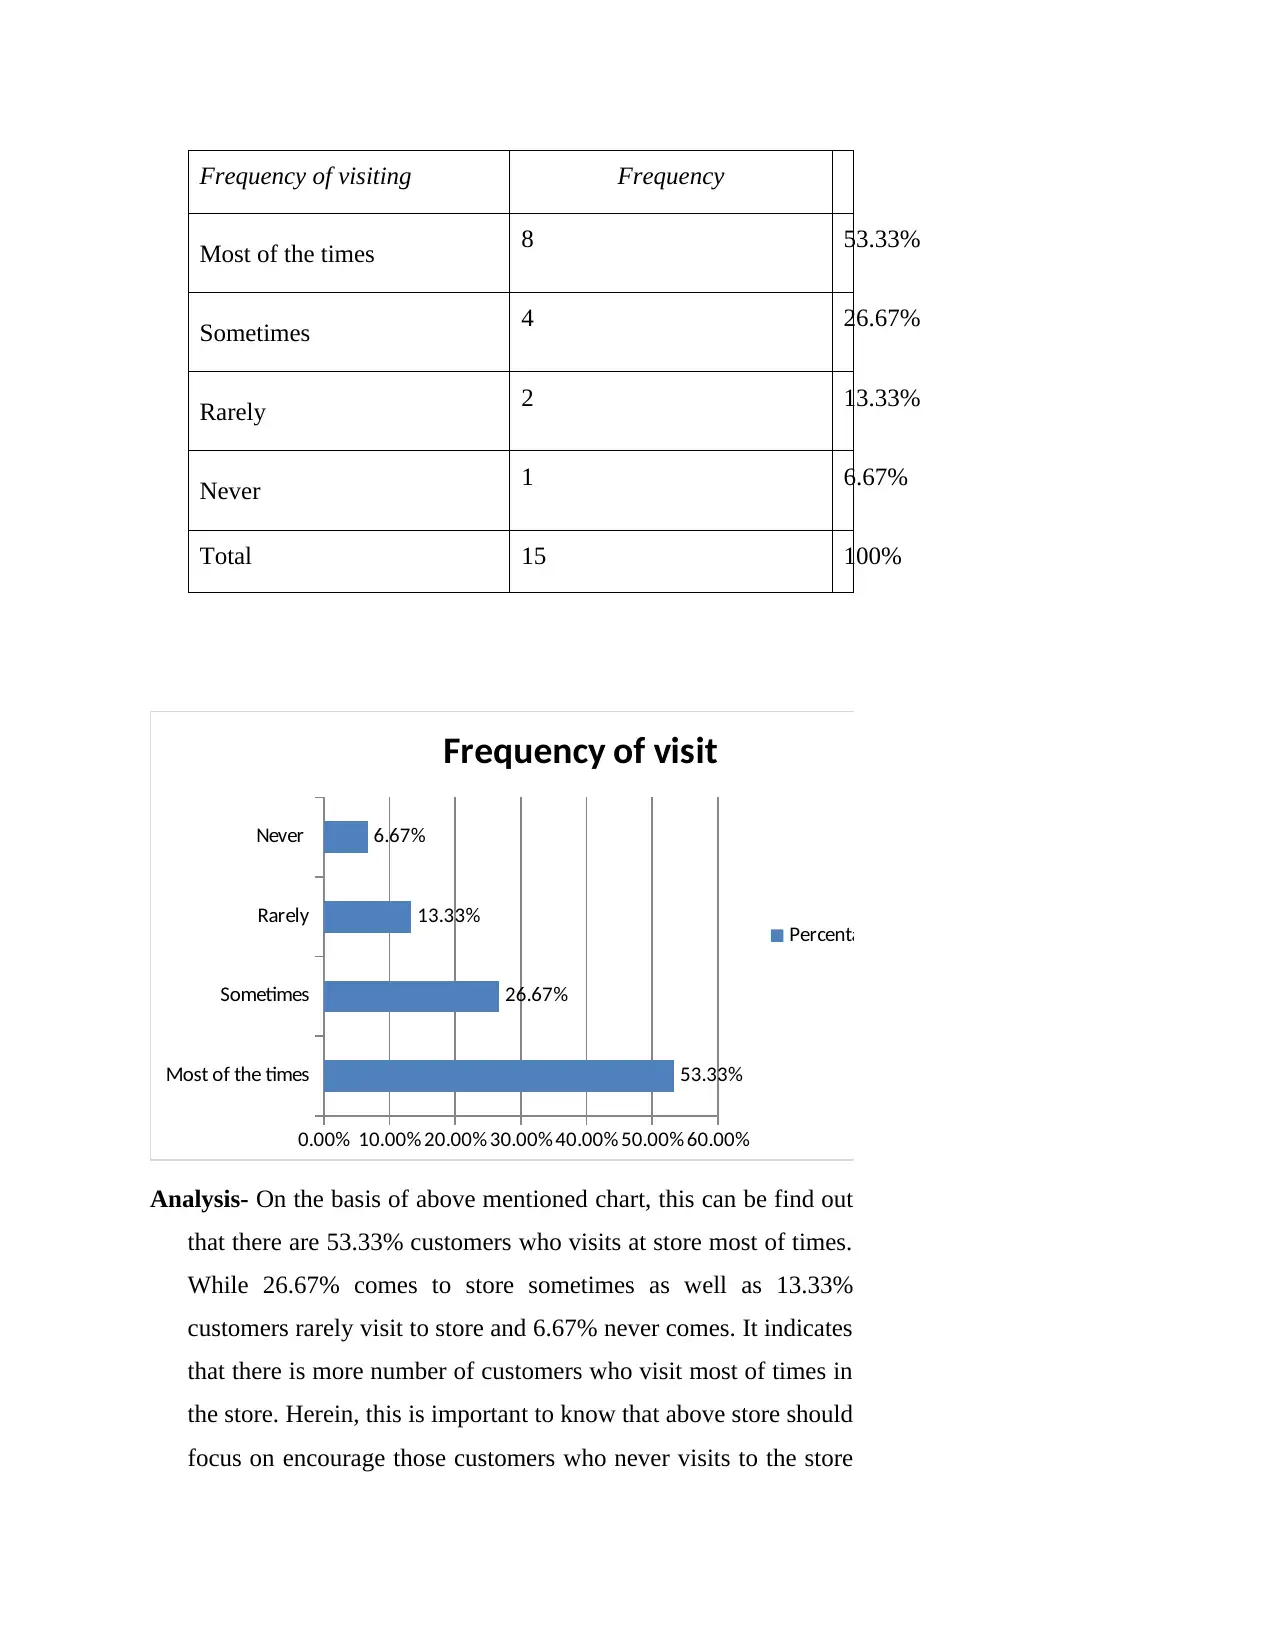
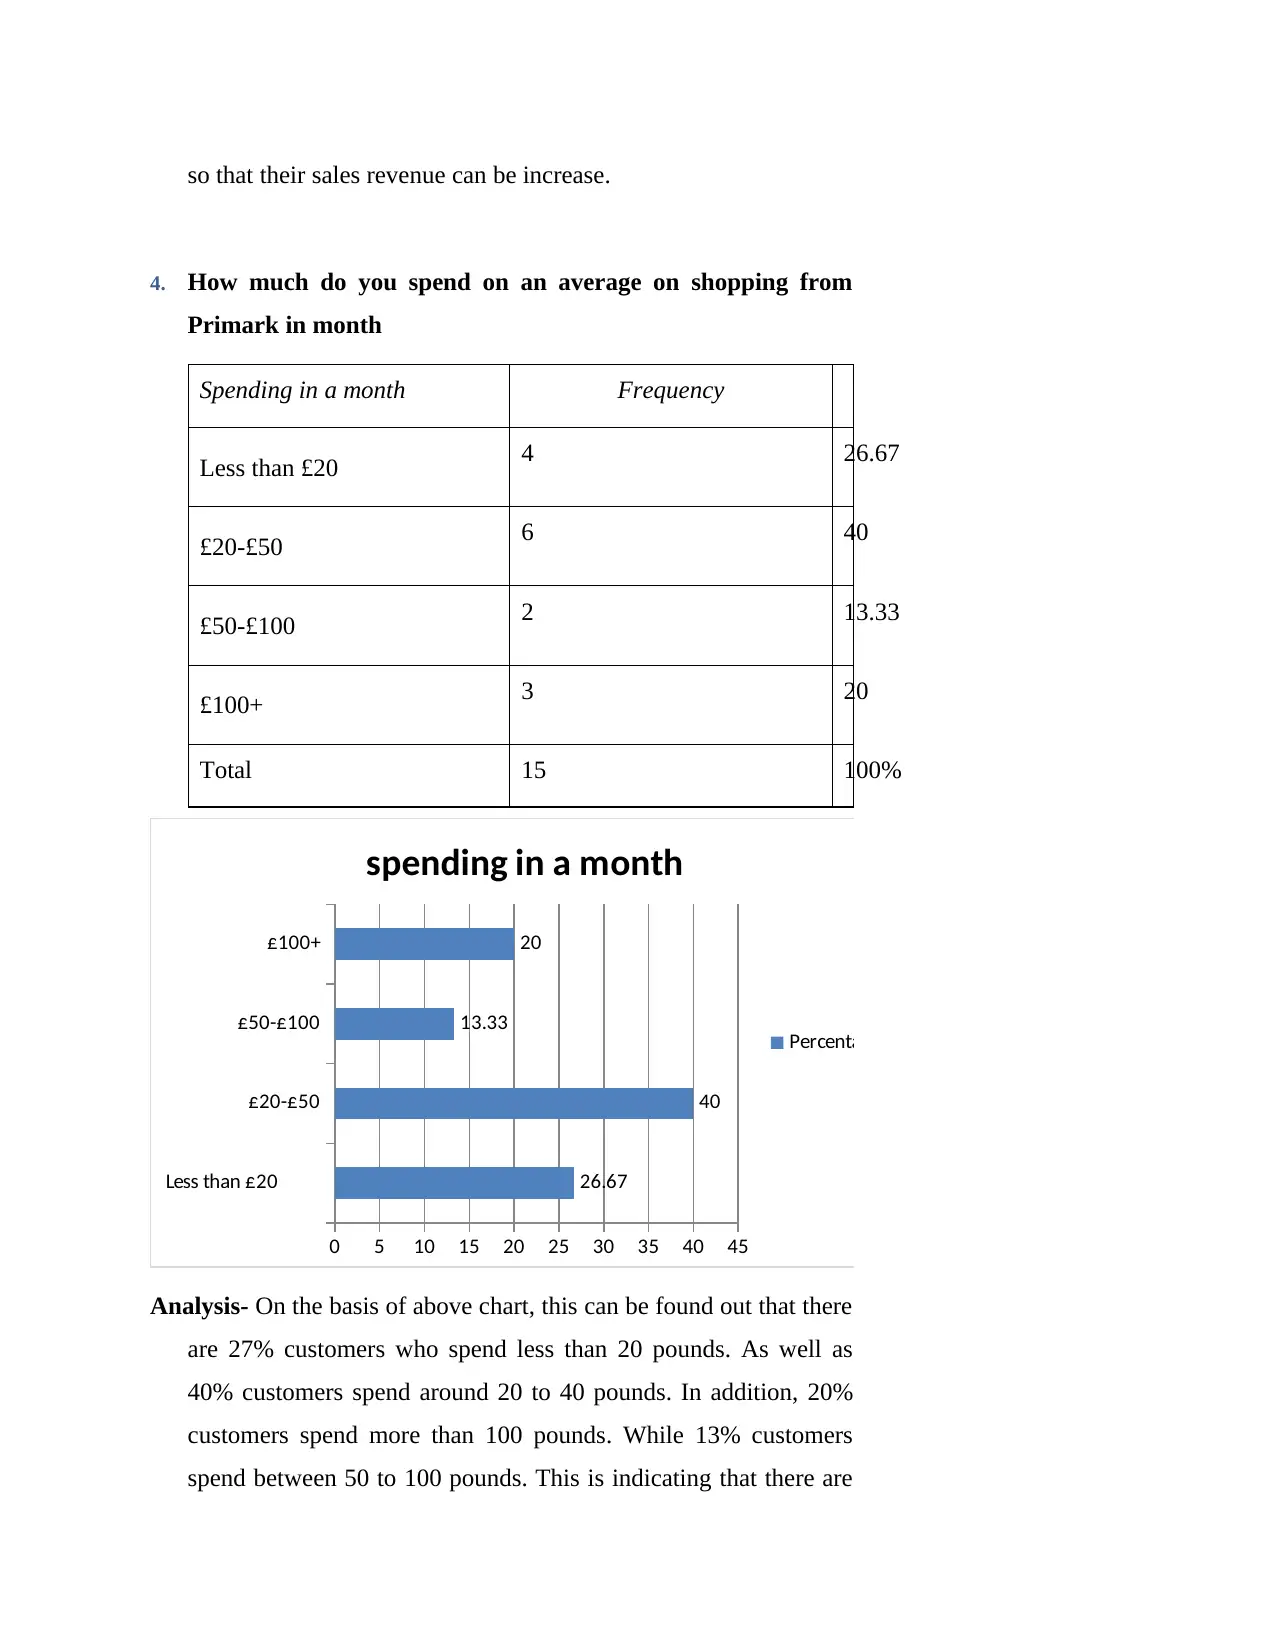
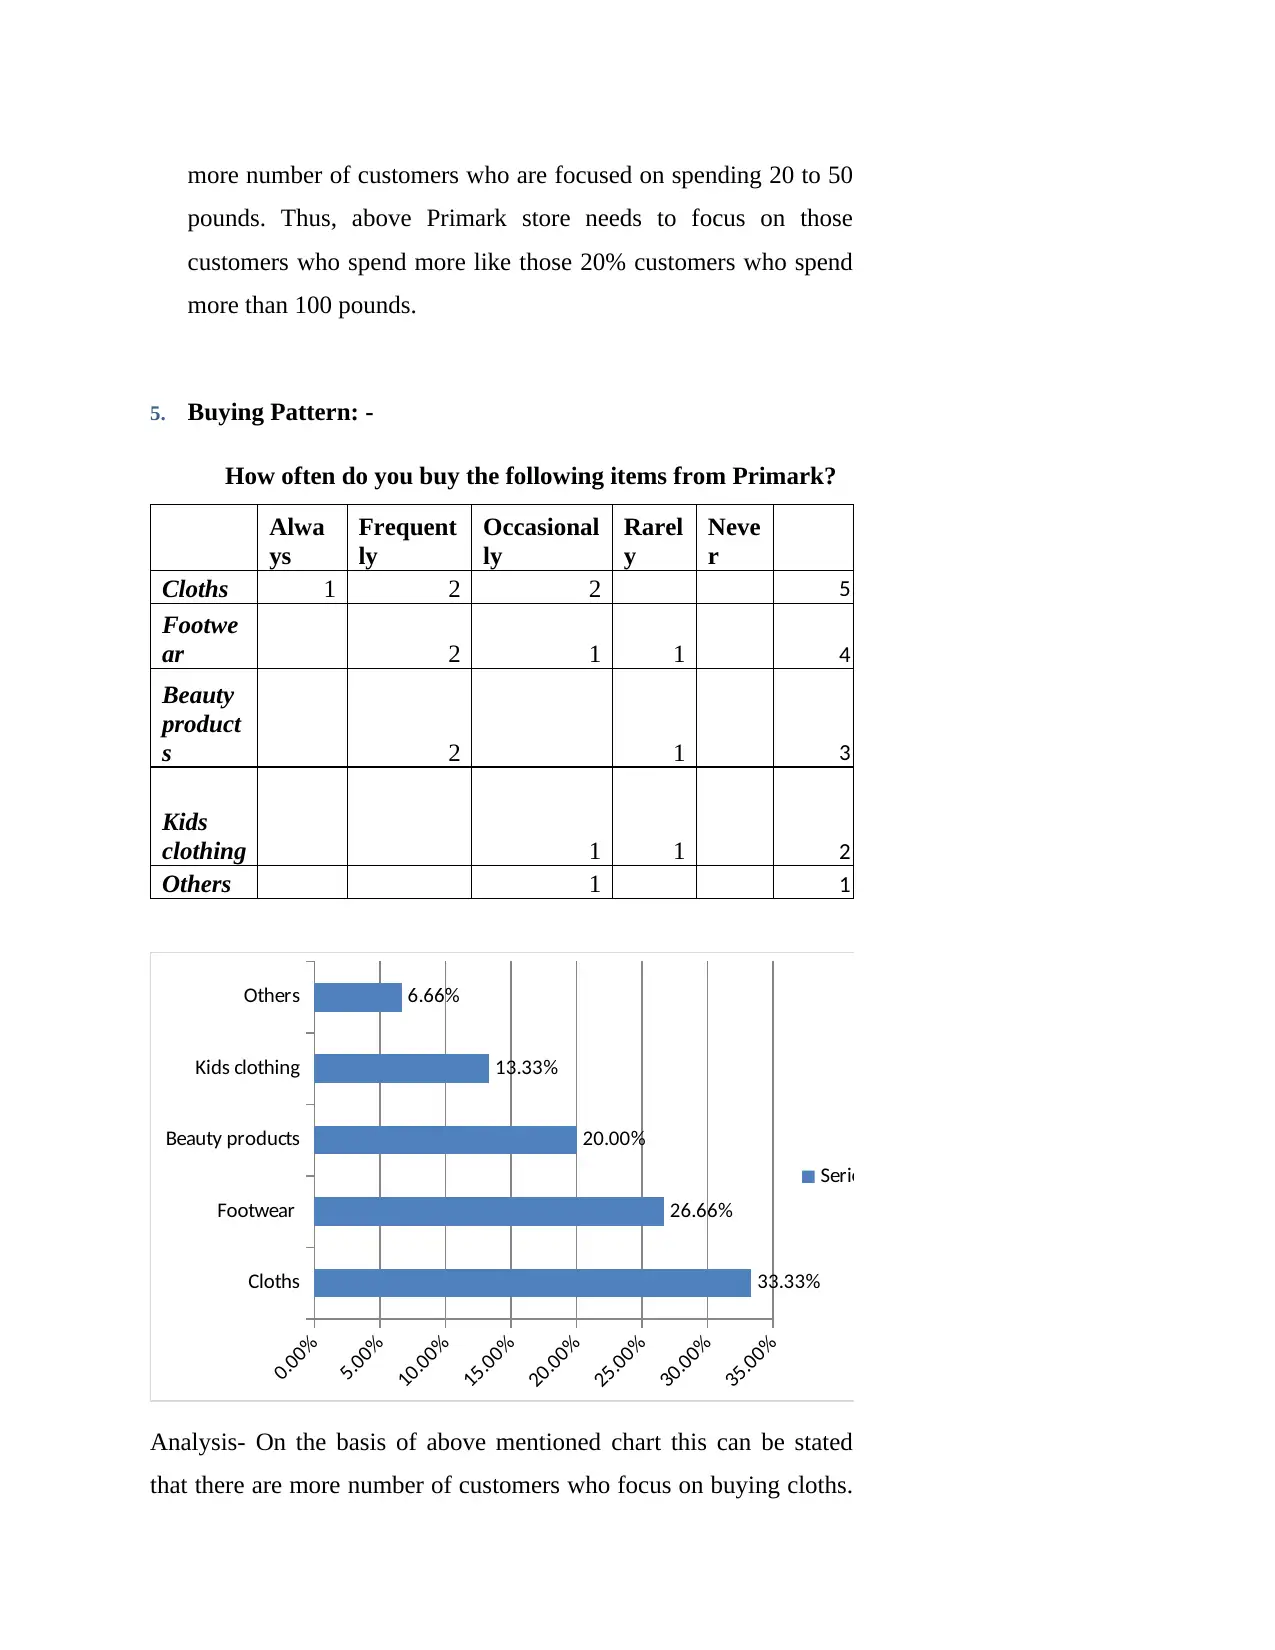
This report provides an executive summary and detailed analysis of Primark's business decision-making processes. It incorporates both primary research, conducted through questionnaires to understand customer demographics, shopping habits, and satisfaction with various aspects of the store (environment, product info, promotional events). The primary research includes analysis of gender, age groups, frequency of visits, spending habits, buying patterns, and the effectiveness of promotional programs. Secondary research involves examining Primark's market share compared to competitors like Marks & Spencer, Next plc, and Tesco plc. The report analyzes financial data and provides key findings, conclusions, and recommendations to inform Primark's expansion strategies and enhance customer satisfaction. The report suggests areas for improvement, such as focusing on product quality, customer service, and promotional events, to increase sales and customer loyalty.

BUSINESS DECISION
MAKING
MAKING
Paraphrase This Document
Need a fresh take? Get an instant paraphrase of this document with our AI Paraphraser

EXECUTIVE SUMMARY
The project report is based on research on a company so that they can take suitable
decisions. Under the report both primary and secondary research has been performed. The
primary research abstracts that company should focus those aspects which are beneficial for
them. As well as secondary research summarize financial performance of three United Kingdom
clothing stores.

Contents
EXECUTIVE SUMMARY.........................................................................................................................2
INTRODUCTION.......................................................................................................................................3
MAIN BODY..............................................................................................................................................3
Task 1. Primary data collection:..............................................................................................................3
Task 2. Secondary data collection.........................................................................................................23
KEY FINDINGS.......................................................................................................................................25
CONCLUSION AND RECOMMENDATION.........................................................................................26
REFERENCES..........................................................................................................................................27
⊘ This is a preview!⊘
Do you want full access?
Subscribe today to unlock all pages.

Trusted by 1+ million students worldwide

INTRODUCTION
The company's judgment-making term is too important. It is related to decision-making
on the basis of proper evaluation and research (Gong, Simpson, Koh and Tan, 2018). Without
proper analysis, it can be difficult for businesses to determine impact of external factors as well
as they will not be able to take correct decisions. The project report is based on a company that is
Primark clothing. This company wants to expand its business and for this purpose both primary,
secondary research has been done. Under the first task, questionnaire is prepared which is a basis
of primary research. While in the secondary research, financial information of chosen company
and its comparative companies is done.
MAIN BODY
Task 1. Primary data collection:
Primary research is described by researchers as a technique used to directly collect
information rather than by the data gathered in the past research (Andjelic and Vesic, 2017).
Companies or entities can perform primary research itself or hire a third party for it. One
important benefit of primary research is that this research method is "pinpointed." Research only
focuses on a particular issue or problem. In regards to above Primark clothing, this research has
been done in such manner by help of different questionnaire:
Designing a questionnaire: A questionnaire is a tool for research comprising a collection of
structured questions to collect data from one or more participants about a statistically valuable
subject (Qin, Liang and Wei, 2017). Herein, below a set of questions is prepared which is based
on 15 respondents:
1. What is your Gender?
Gender Frequency
Male 7 46.66%
Paraphrase This Document
Need a fresh take? Get an instant paraphrase of this document with our AI Paraphraser

Female 8 53.33
Total 15 100.00%
Male
Female
42.00% 44.00% 46.00% 48.00% 50.00% 52.00% 54.00%
47%
53%
Gender
Percentage
Analysis- This diagram reveals that more customers out of 15
respondents are female. Although there are 4 male clients. Thus
above company should focus on female customers. This is
indicating that above needs to focus on those products which are
preferred by female customers. It is so because by doing so, above
company will be able to generate higher revenues.
2. What is your Age group?
Age group Frequency
16-24 3 20%
25-34 4 26.66%
35-44 4 26.66%
44+ 4 26.66%

Total 15 100%
16-24
25-34
35-44
44+
0% 5% 10% 15% 20% 25% 30%
20.00%
26.66%
26.66%
26.66%
Age group
Percentage
Analysis- On the basis of above mentioned chart, this can be find out
that there are only 20% customers whose age is between 16 to 24
years. While 26.67% customers age is of between 25 to 34 years,
35-44 and more than 44 years. This is indicating that above
company needs to focus on those customers whose age is above
24 years. Thus, above mentioned company needs to focus those
products which are being liked by customers whose age is above
24 years. If they will do so then it will be beneficial for them to
generate higher revenues.
3. Frequency of your visit to Primark
⊘ This is a preview!⊘
Do you want full access?
Subscribe today to unlock all pages.

Trusted by 1+ million students worldwide

Frequency of visiting Frequency
Most of the times 8 53.33%
Sometimes 4 26.67%
Rarely 2 13.33%
Never 1 6.67%
Total 15 100%
Most of the times
Sometimes
Rarely
Never
0.00% 10.00% 20.00% 30.00% 40.00% 50.00% 60.00%
53.33%
26.67%
13.33%
6.67%
Frequency of visit
Percentage
Analysis- On the basis of above mentioned chart, this can be find out
that there are 53.33% customers who visits at store most of times.
While 26.67% comes to store sometimes as well as 13.33%
customers rarely visit to store and 6.67% never comes. It indicates
that there is more number of customers who visit most of times in
the store. Herein, this is important to know that above store should
focus on encourage those customers who never visits to the store
Paraphrase This Document
Need a fresh take? Get an instant paraphrase of this document with our AI Paraphraser

so that their sales revenue can be increase.
4. How much do you spend on an average on shopping from
Primark in month
Spending in a month Frequency
Less than £20 4 26.67
£20-£50 6 40
£50-£100 2 13.33
£100+ 3 20
Total 15 100%
Less than £20
£20-£50
£50-£100
£100+
0 5 10 15 20 25 30 35 40 45
26.67
40
13.33
20
spending in a month
Percentage
Analysis- On the basis of above chart, this can be found out that there
are 27% customers who spend less than 20 pounds. As well as
40% customers spend around 20 to 40 pounds. In addition, 20%
customers spend more than 100 pounds. While 13% customers
spend between 50 to 100 pounds. This is indicating that there are

more number of customers who are focused on spending 20 to 50
pounds. Thus, above Primark store needs to focus on those
customers who spend more like those 20% customers who spend
more than 100 pounds.
5. Buying Pattern: -
How often do you buy the following items from Primark?
Alwa
ys
Frequent
ly
Occasional
ly
Rarel
y
Neve
r
Cloths 1 2 2 5
Footwe
ar 2 1 1 4
Beauty
product
s 2 1 3
Kids
clothing 1 1 2
Others 1 1
Cloths
Footwear
Beauty products
Kids clothing
Others
0.00%
5.00%
10.00%
15.00%
20.00%
25.00%
30.00%
35.00%
33.33%
26.66%
20.00%
13.33%
6.66%
Series1
Analysis- On the basis of above mentioned chart this can be stated
that there are more number of customers who focus on buying cloths.
⊘ This is a preview!⊘
Do you want full access?
Subscribe today to unlock all pages.

Trusted by 1+ million students worldwide

As there are 33.33% customers who focus on purchasing of cloths. In
addition 26.66% customers focus on purchasing footwear. 20%
customers buy beauty products and 13.33 % kids’ cloths. This is
showing that there are more number of customers who want to buy
clothing products. Thus above store needs to focus one expansion of
clothing market. If they will do so than it will be easier for them to
attract more number of customers. Along with, second best product is
footwear which is liked by customers hence, above company needs to
increase stock level of footwear so that they can generate higher
revenues.
6. Which one of promotional programs is your favorite?
Promotional event Frequency
Vouchers 2 13.33%
Loyalty card 5 33.33%
Promotions 3 20%
Buy one get one free 5 33.33%
Total 15 100
Paraphrase This Document
Need a fresh take? Get an instant paraphrase of this document with our AI Paraphraser

Vouchers
Loyalty card
Promotions
Buy one get
one free
0.00% 5.00% 10.00%15.00%20.00%25.00%30.00%35.00%
13.33%
33.33%
20.00%
33.33%
Promotional events
Percentage
Analysis- On the basis of above chart this can be find out that there
are 33.33% customers are attracted with loyalty program and buy
one get one free. While only 13.33% customers like vouchers
system of above store. In addition, 20% like promotion of above
store. This is indicating that above store needs to focus on those
events in which customers’ number is higher. The more number
of customers like buy one get one free concept. If they will do so
than there will be more customers.
7. Does the promotional program motivate you to buy more?
a. Yes b. No
Impact of Promotional event Frequency
Yes 9 60%
No 6 40%
Total 15 100

Yes
No
0% 10% 20% 30% 40% 50% 60% 70%
60%
40%
Impact of promotional events
Percentage
Analysis- On the basis of above chart, this can be stated that there are
60% customers who like the promotional events and get attracted to
virssit the store. On the other hand there are 40% customers who do
not like promotional events and do not visit the stores. Hence, above
company needs to focus more on the promotional events so that more
number of customers can come to their store. This can become
possible only possible when they will make invest in the promotional
activities.
Consumer Satisfaction: -
8. Please measure your satisfaction with the following infrastructure factors.
Poo
r Fair Satisfactory Good Excellent Frequency %
Shopping
Environment 2 1 1 5 33.33
Security
Facilities 2 2 4 26.66
⊘ This is a preview!⊘
Do you want full access?
Subscribe today to unlock all pages.

Trusted by 1+ million students worldwide
1 out of 20
Related Documents
Your All-in-One AI-Powered Toolkit for Academic Success.
+13062052269
info@desklib.com
Available 24*7 on WhatsApp / Email
Unlock your academic potential
Copyright © 2020–2025 A2Z Services. All Rights Reserved. Developed and managed by ZUCOL.


