Business Decision Making: Primark and Competitor Analysis Report

Verified

Added on  2023/01/11

|9
|2046
|37
Report
AI Summary
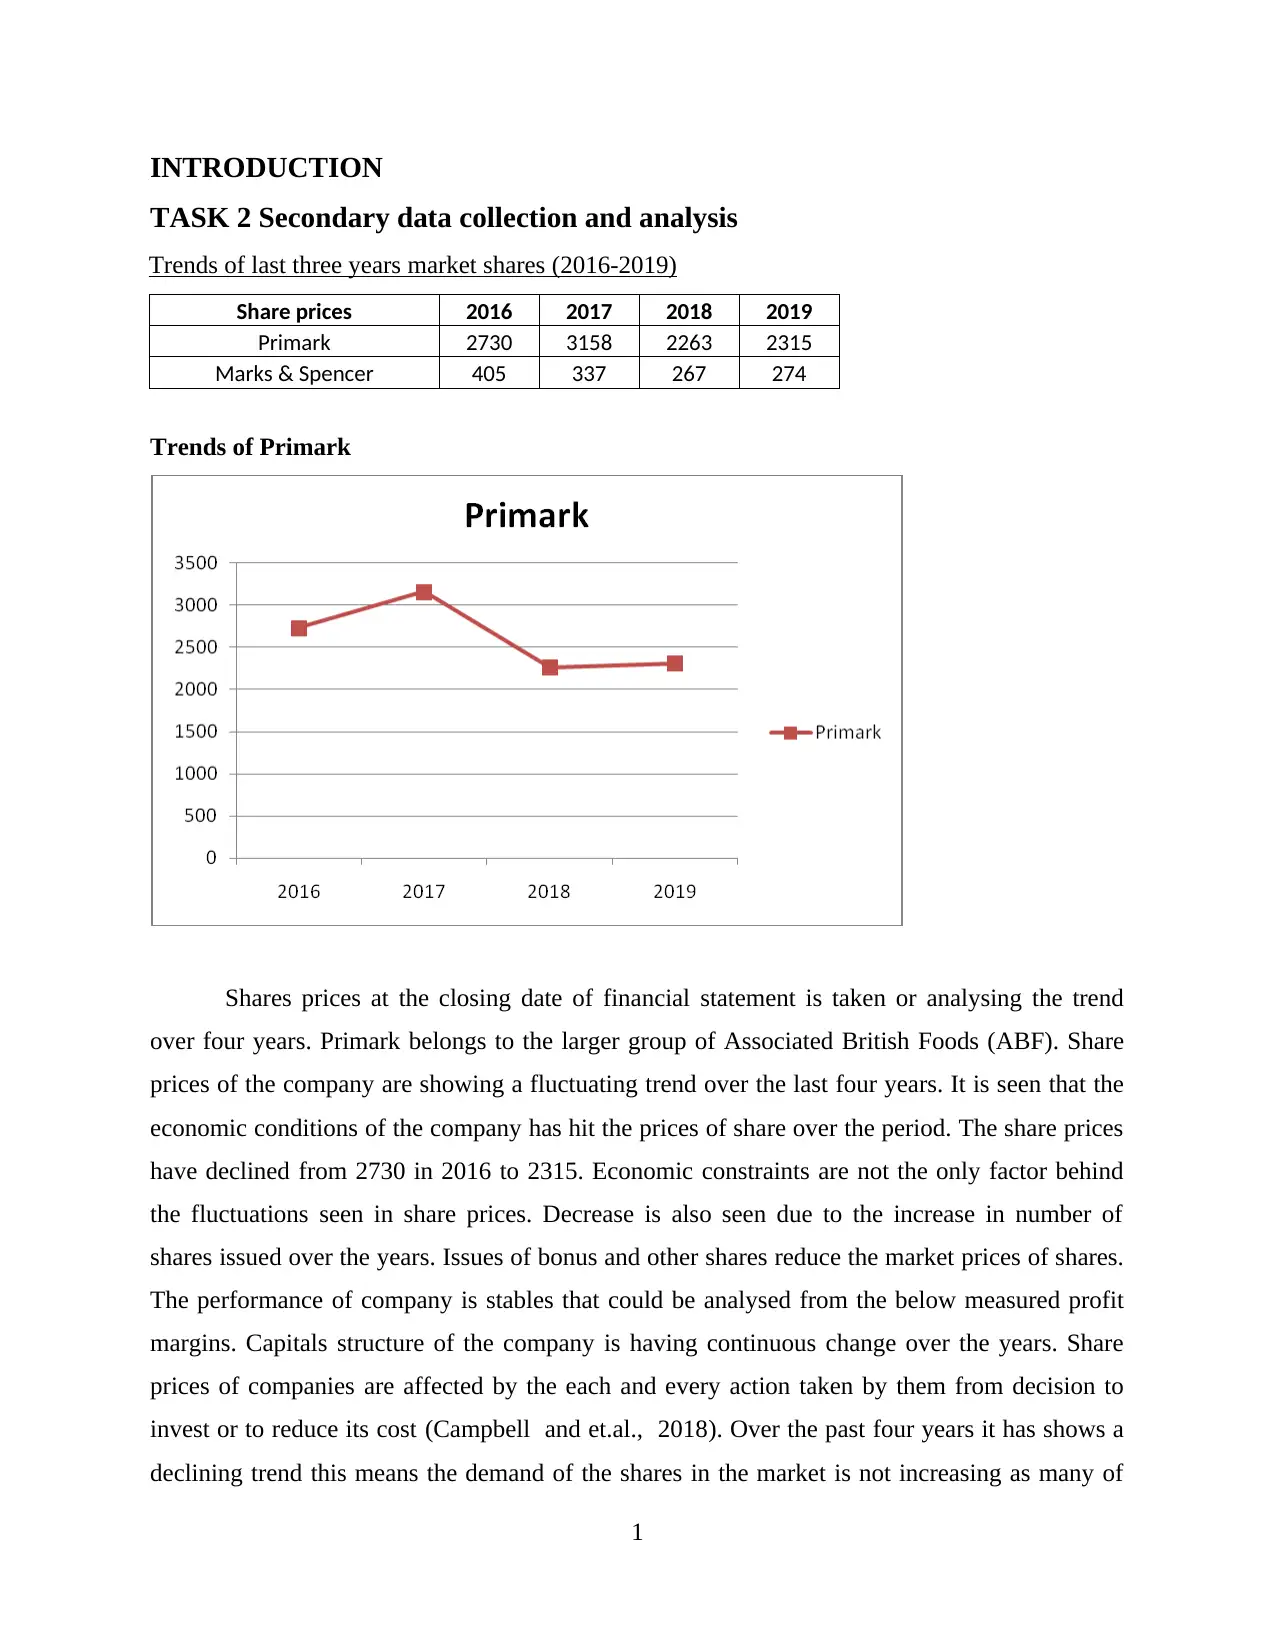
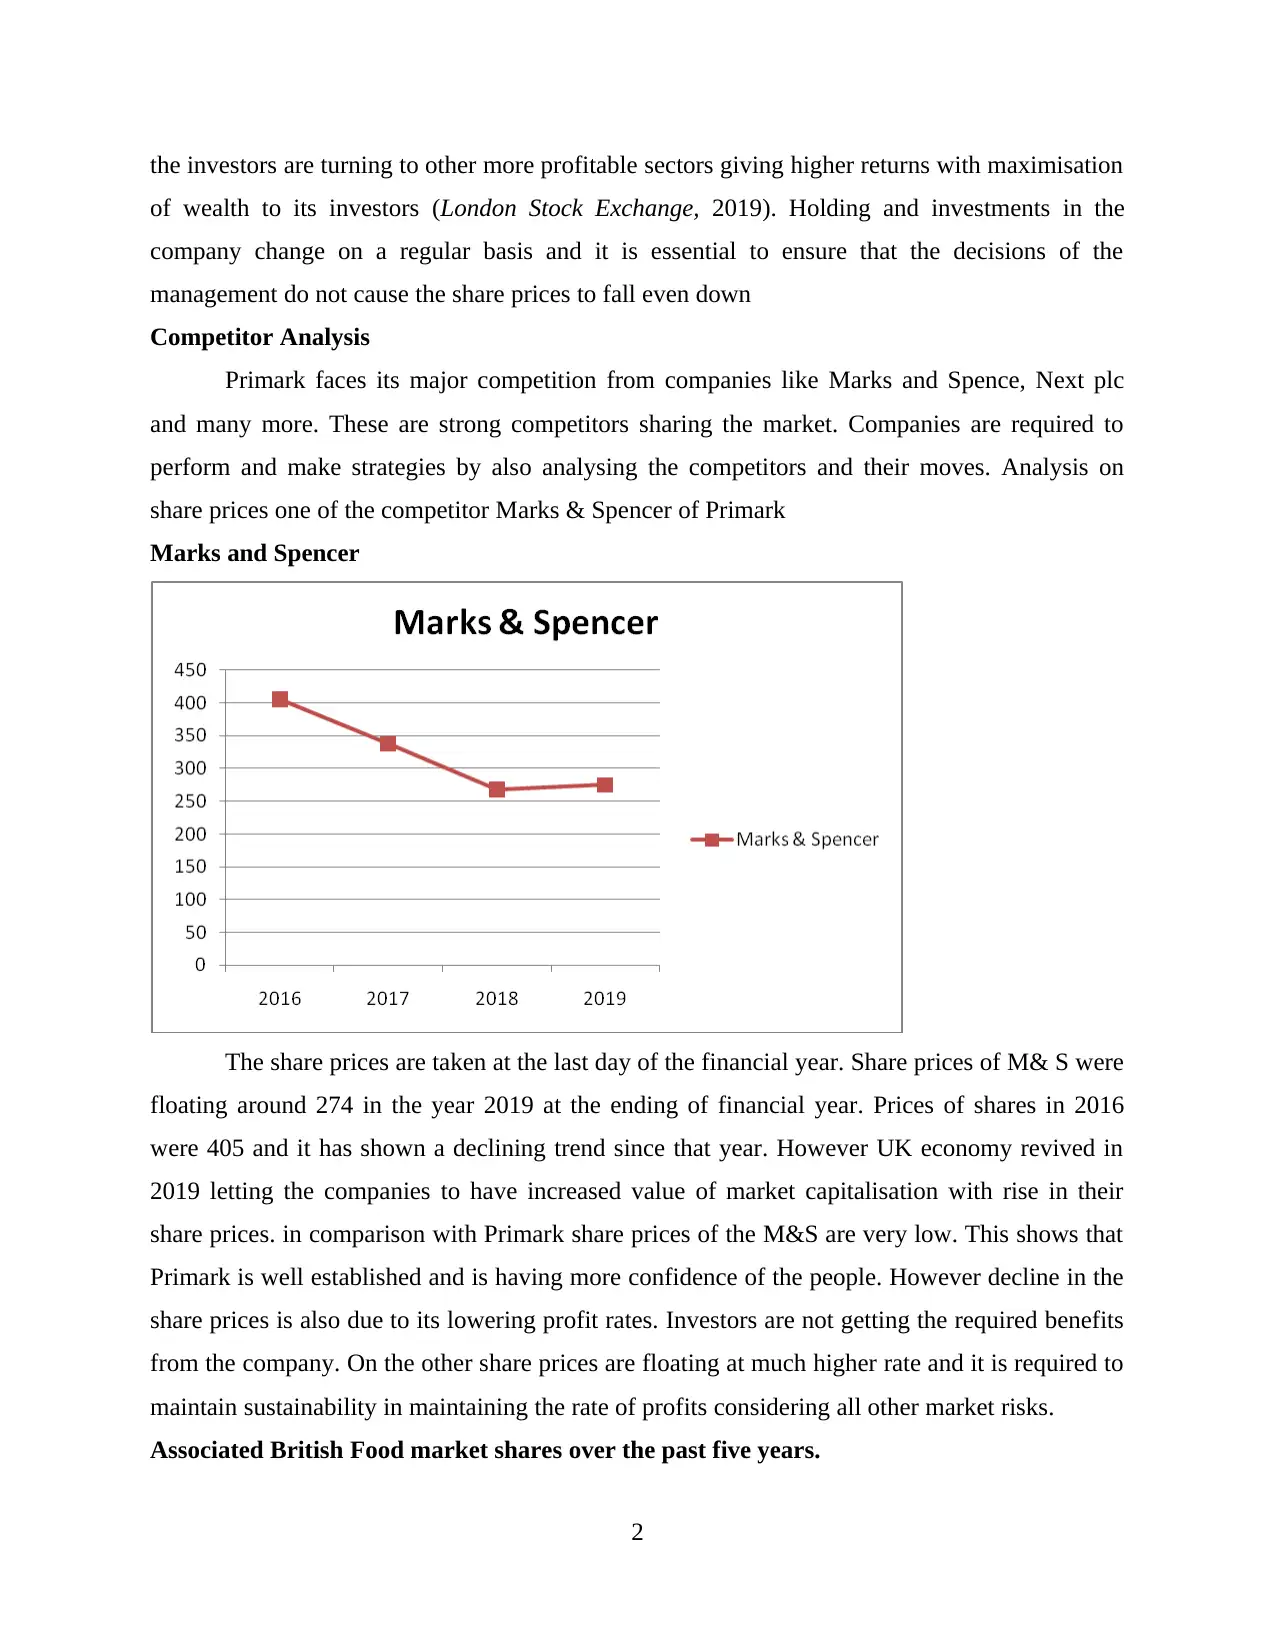
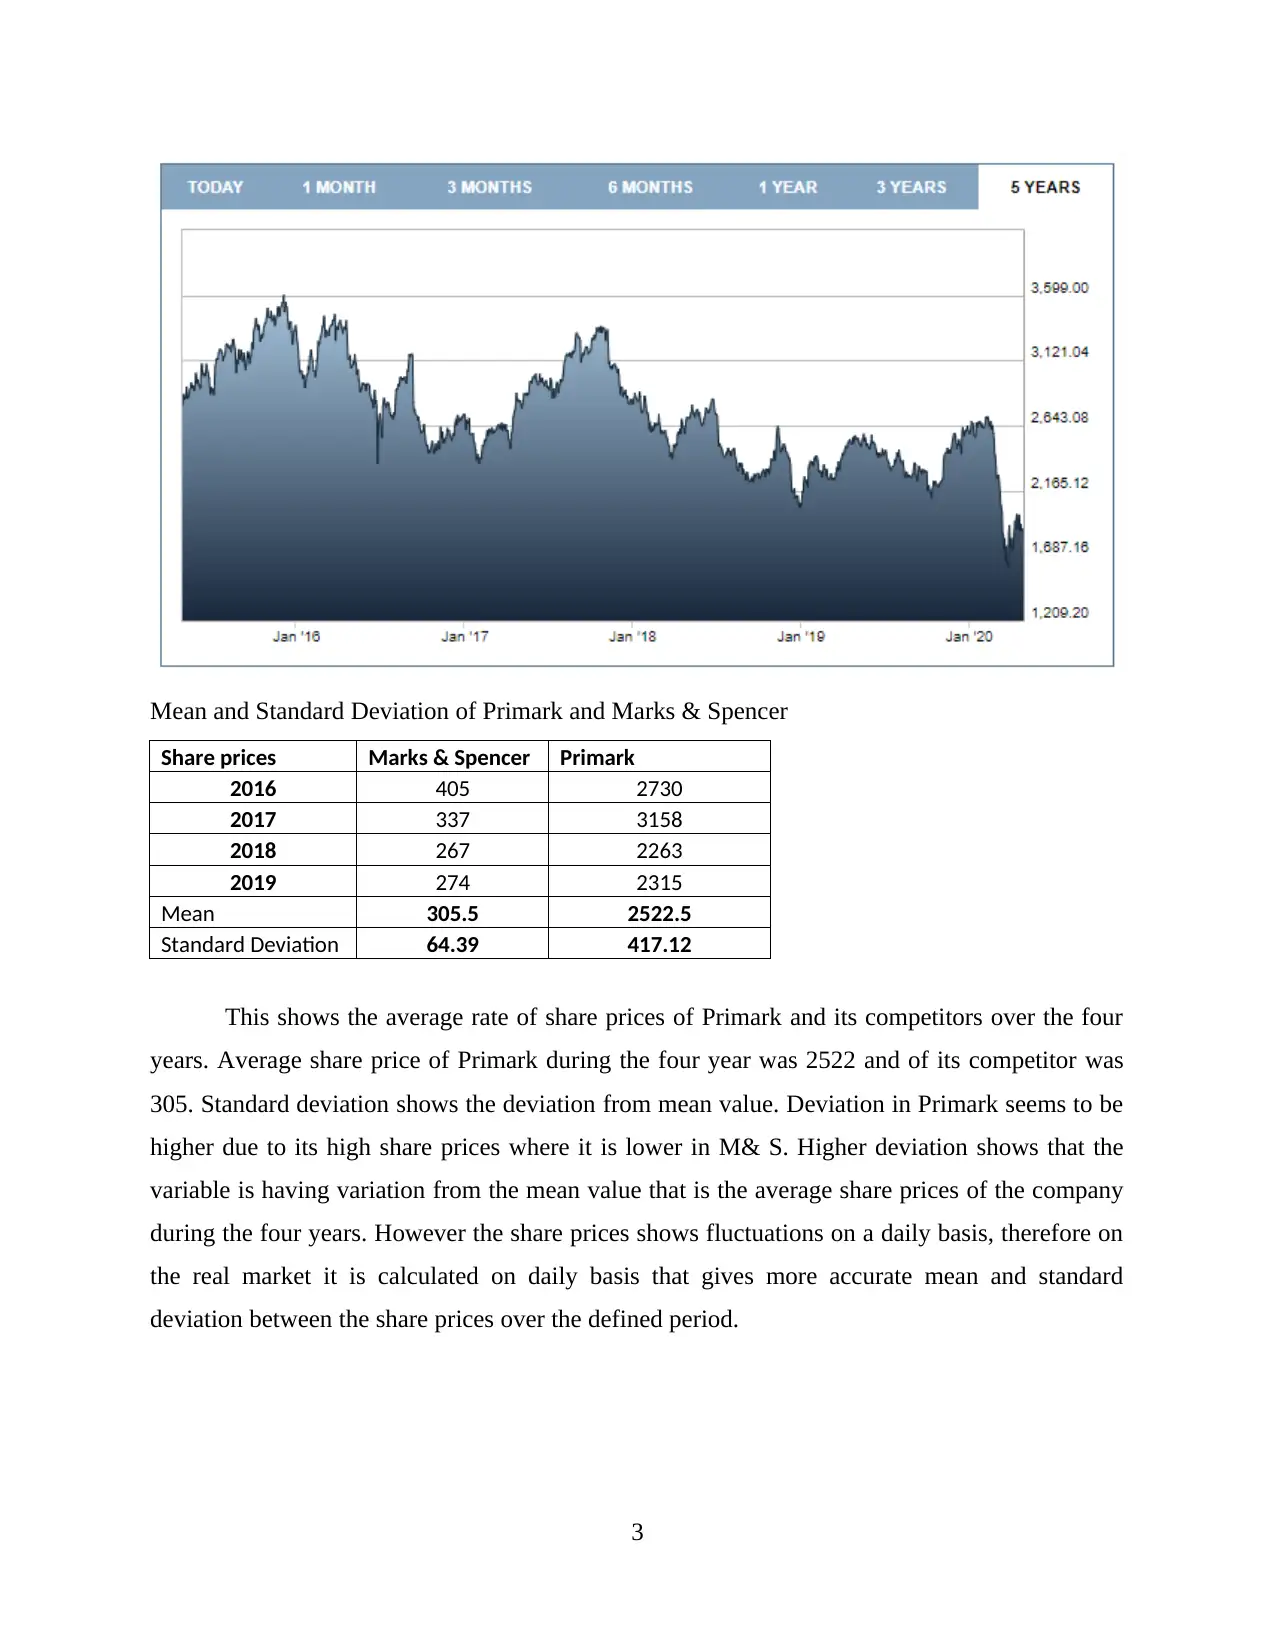
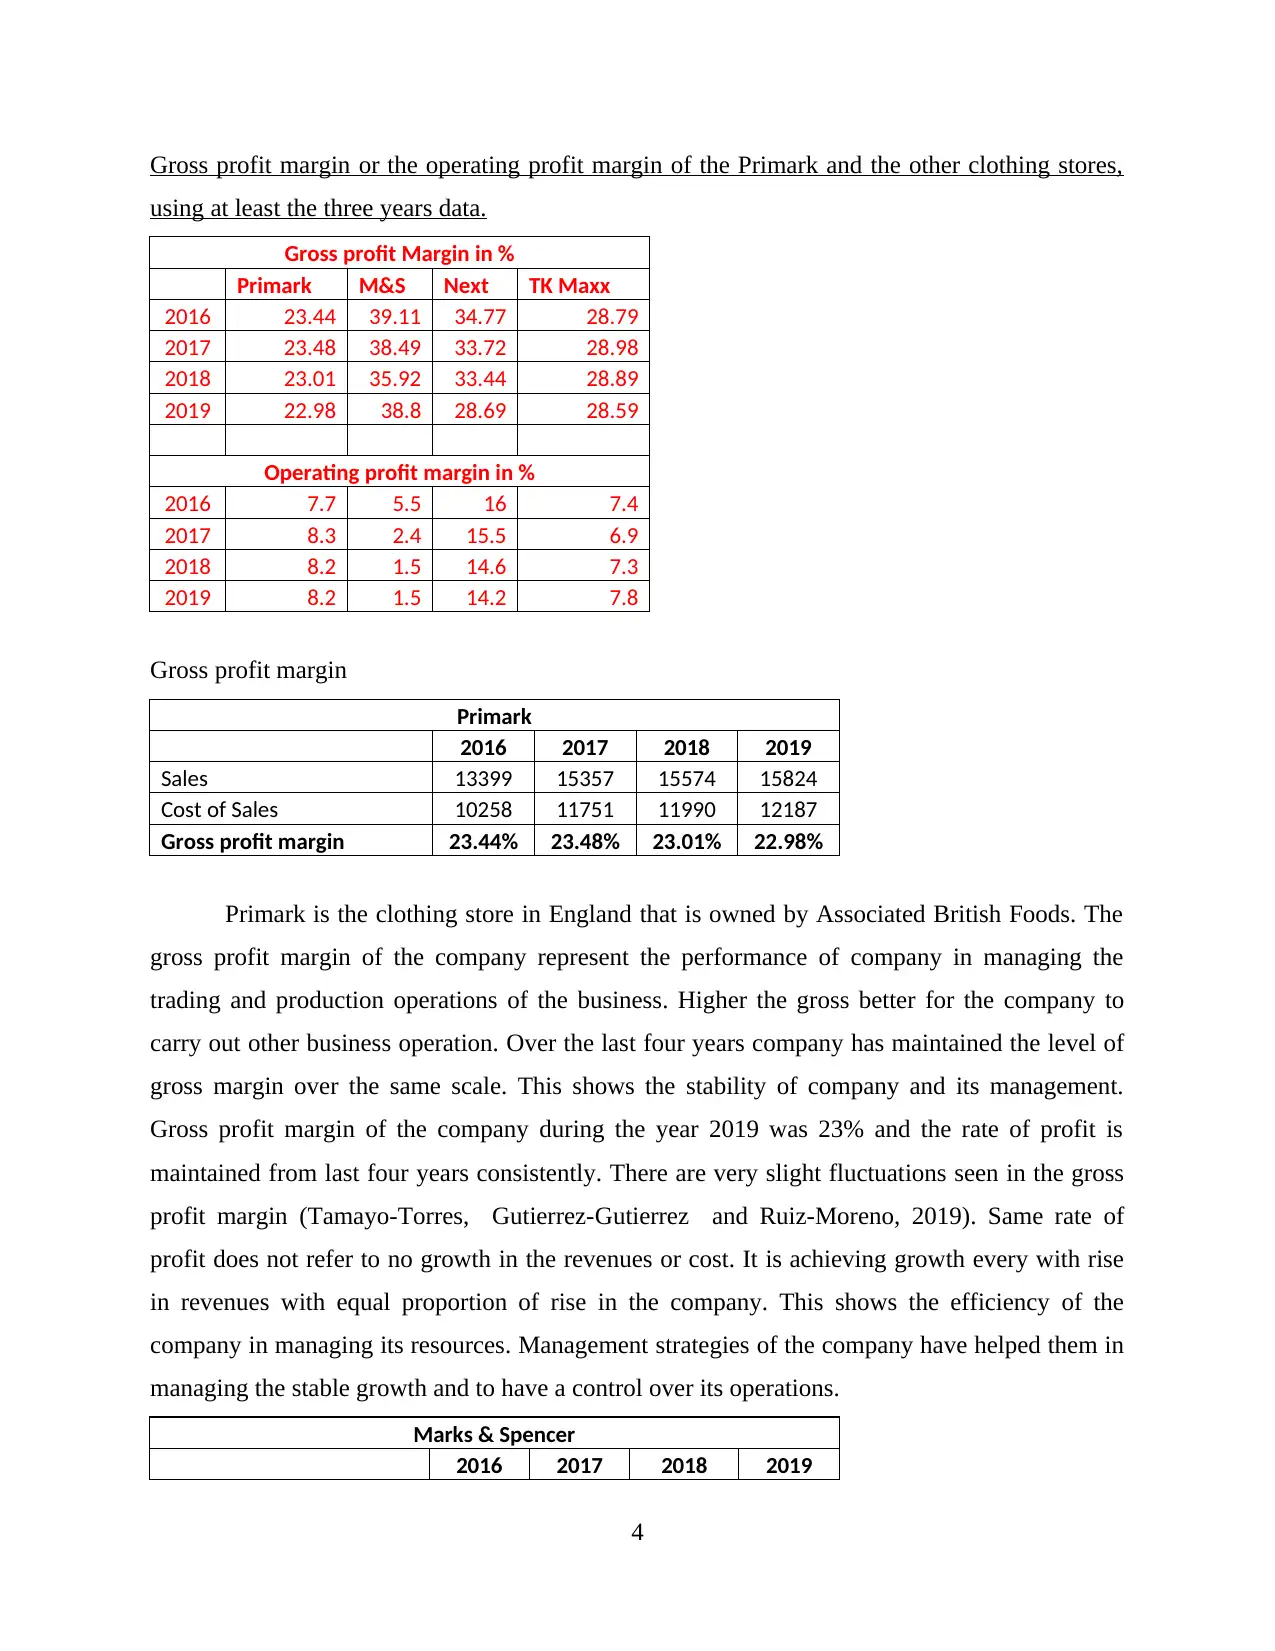
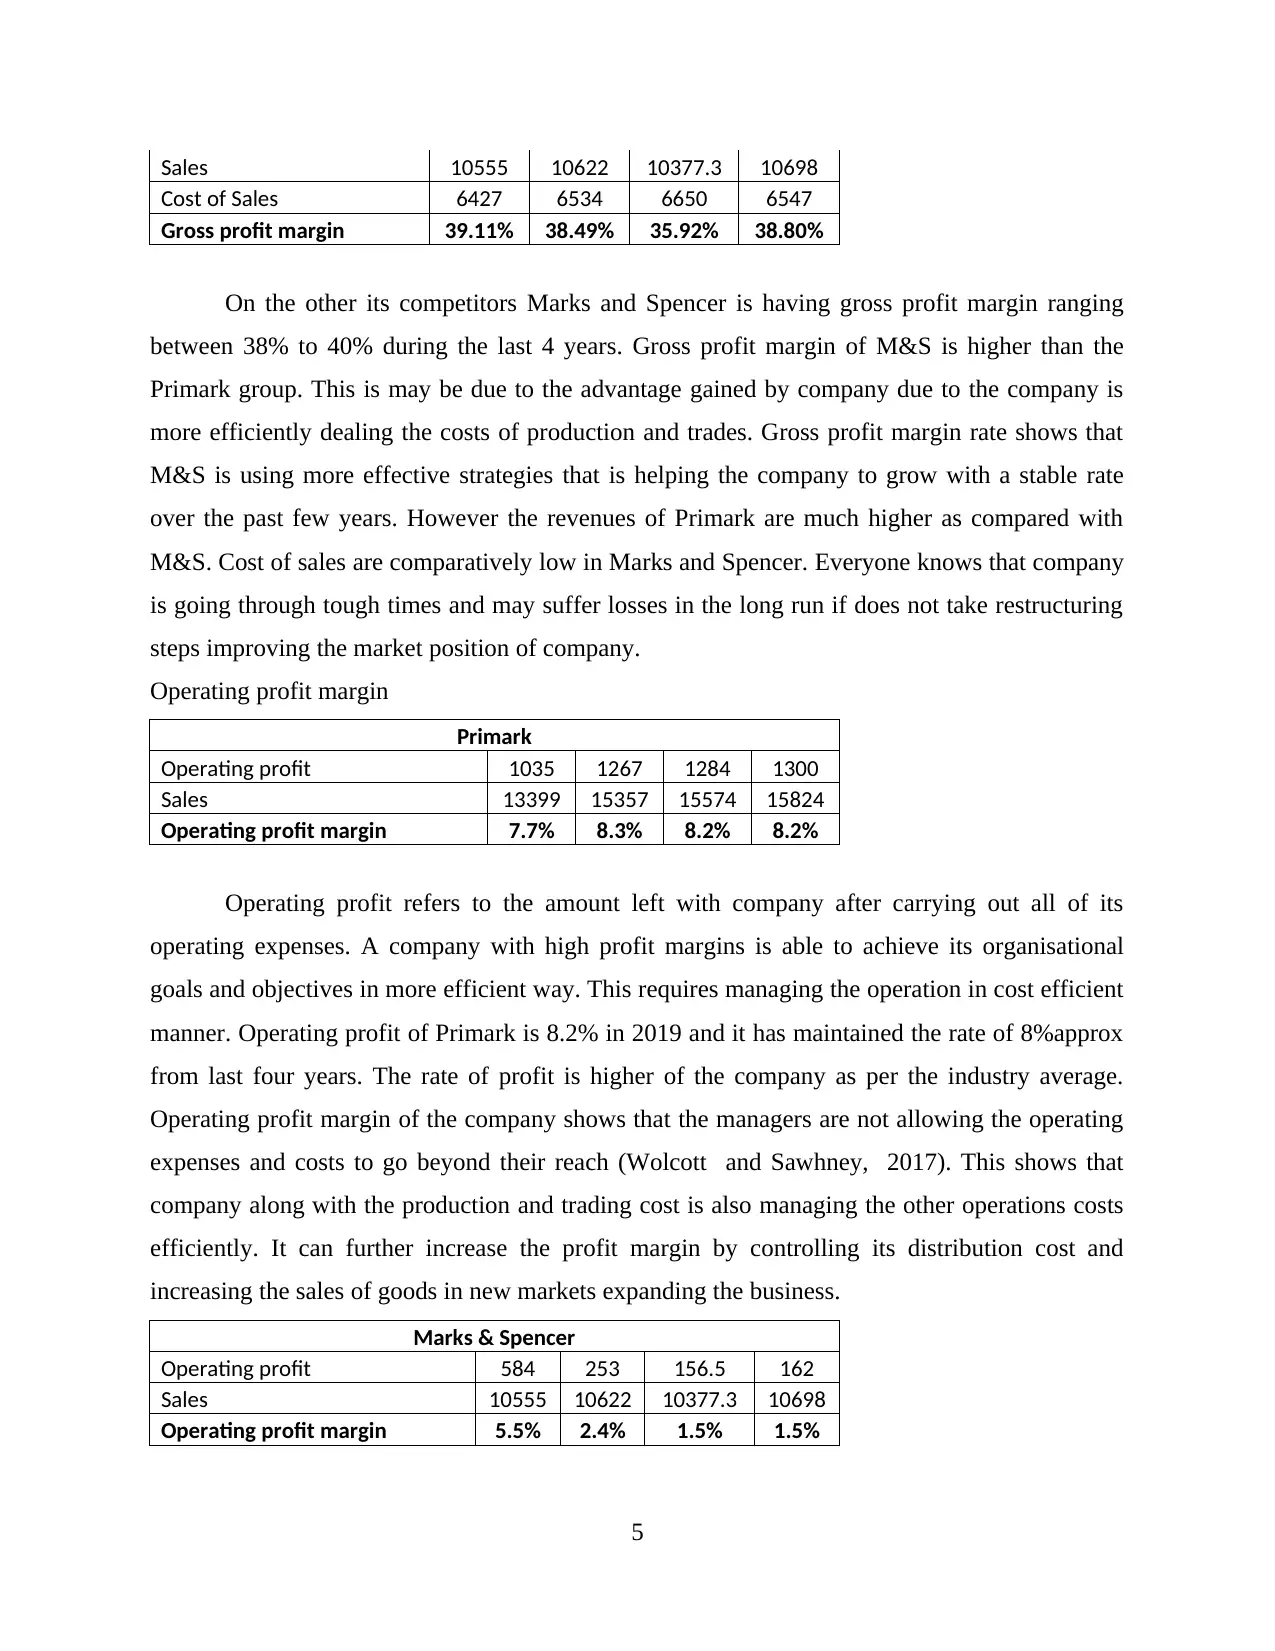
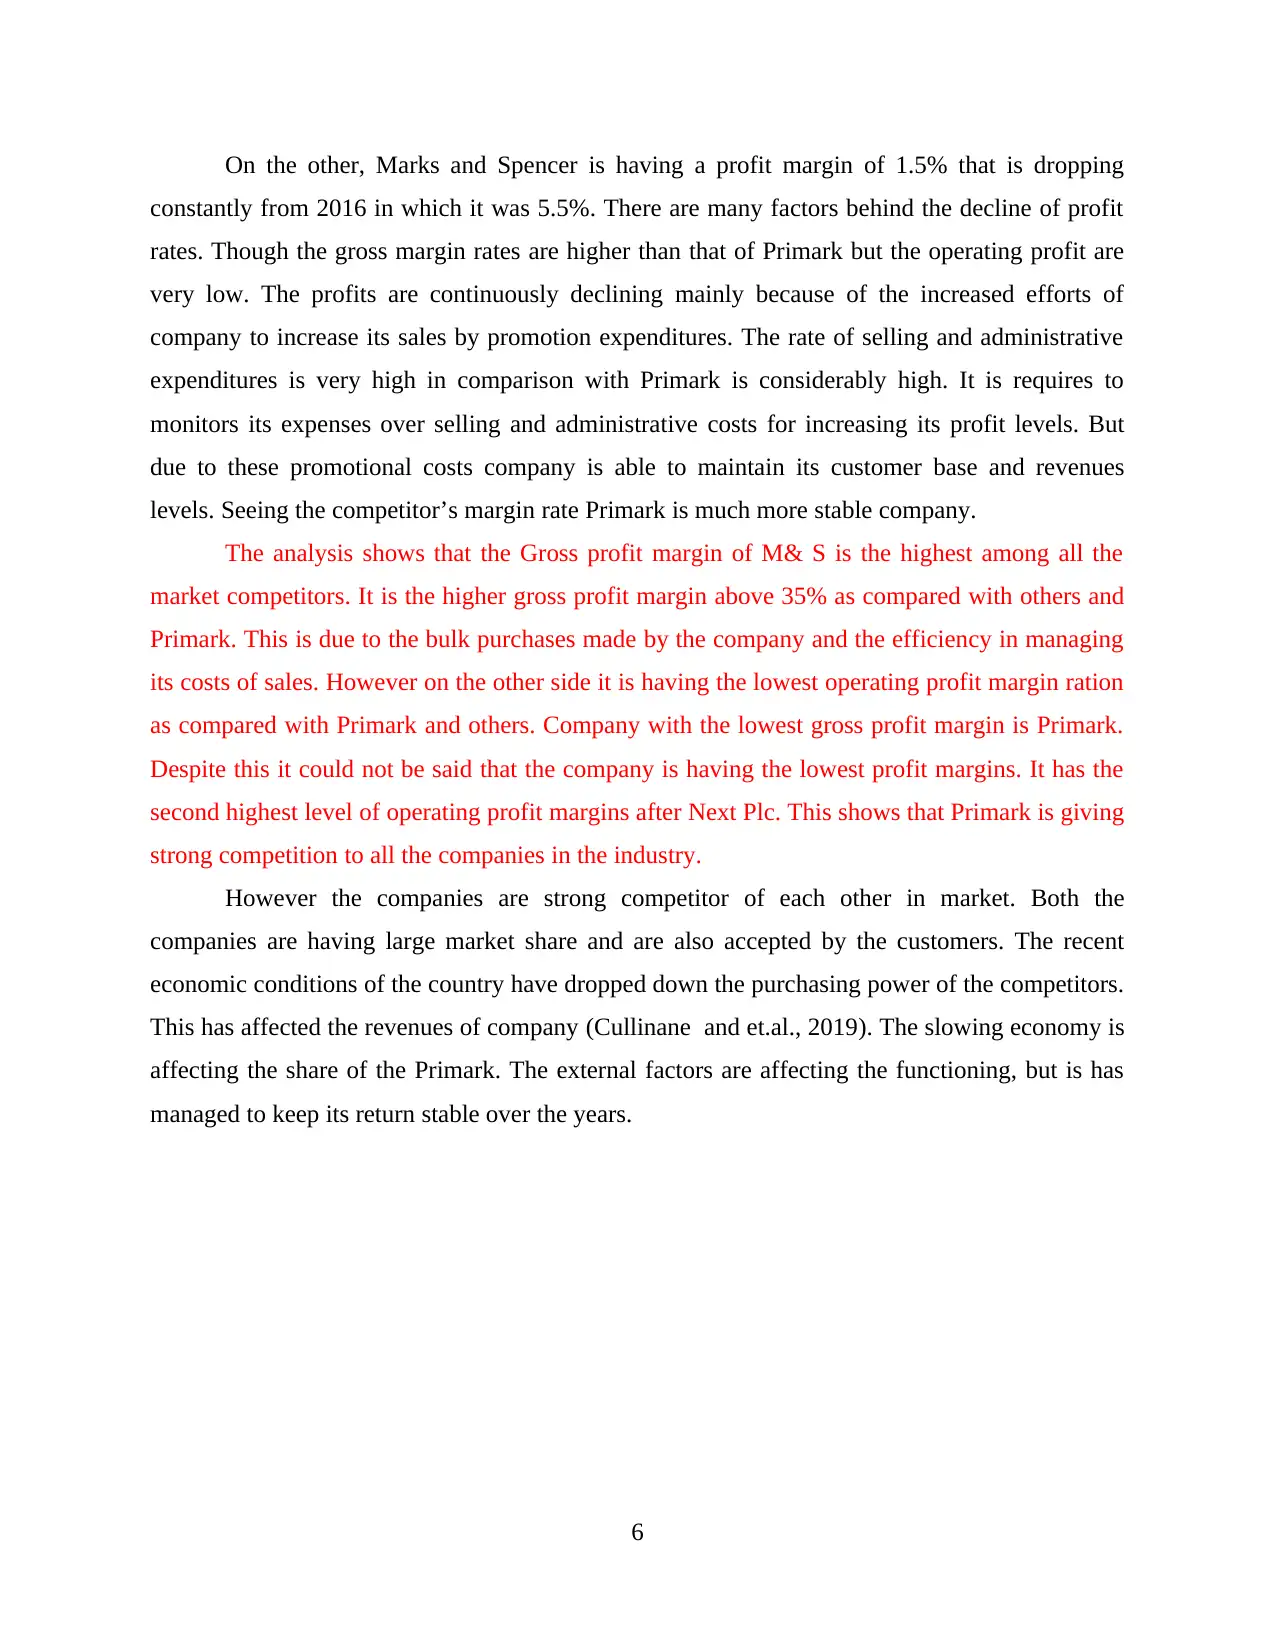
This report provides a detailed analysis of Primark's market performance, focusing on its share prices, gross profit margin, and operating profit margin from 2016 to 2019. The analysis includes a comparison of Primark's financial data with competitors like Marks & Spencer, Next plc, and TK Maxx. The report examines the fluctuating trends of Primark's share prices and discusses factors influencing these trends, such as economic conditions, the issuance of new shares, and competitor strategies. It also delves into the gross and operating profit margins of Primark and its competitors, highlighting the company's efficiency in managing trading, production operations, and overall costs. The report concludes by assessing Primark's market position and its ability to maintain stable returns amidst competitive pressures and economic changes. The data is sourced from financial statements, market data, and industry reports, providing a comprehensive overview of Primark's business decisions and their impact on its financial performance.
Document Page
BUSINESS DECISION
MAKING
tabler-icon-diamond-filled.svg

Paraphrase This Document

Need a fresh take? Get an instant paraphrase of this document with our AI Paraphraser
Document Page
TABLE OF CONTENTS
TABLE OF CONTENTS................................................................................................................2
INTRODUCTION...........................................................................................................................1
TASK 2 Secondary data collection and analysis.............................................................................1
Trends of last three years market shares (2016-2019).................................................................1
Gross profit margin or the operating profit margin of the Primark and the other clothing stores,
using at least the three years data................................................................................................4
Document Page
INTRODUCTION
TASK 2 Secondary data collection and analysis
Trends of last three years market shares (2016-2019)
Share prices 2016 2017 2018 2019
Primark 2730 3158 2263 2315
Marks & Spencer 405 337 267 274
Trends of Primark
Shares prices at the closing date of financial statement is taken or analysing the trend
over four years. Primark belongs to the larger group of Associated British Foods (ABF). Share
prices of the company are showing a fluctuating trend over the last four years. It is seen that the
economic conditions of the company has hit the prices of share over the period. The share prices
have declined from 2730 in 2016 to 2315. Economic constraints are not the only factor behind
the fluctuations seen in share prices. Decrease is also seen due to the increase in number of
shares issued over the years. Issues of bonus and other shares reduce the market prices of shares.
The performance of company is stables that could be analysed from the below measured profit
margins. Capitals structure of the company is having continuous change over the years. Share
prices of companies are affected by the each and every action taken by them from decision to
invest or to reduce its cost (Campbell and et.al., 2018). Over the past four years it has shows a
declining trend this means the demand of the shares in the market is not increasing as many of
1
Document Page
the investors are turning to other more profitable sectors giving higher returns with maximisation
of wealth to its investors (London Stock Exchange, 2019). Holding and investments in the
company change on a regular basis and it is essential to ensure that the decisions of the
management do not cause the share prices to fall even down
Competitor Analysis
Primark faces its major competition from companies like Marks and Spence, Next plc
and many more. These are strong competitors sharing the market. Companies are required to
perform and make strategies by also analysing the competitors and their moves. Analysis on
share prices one of the competitor Marks & Spencer of Primark
Marks and Spencer
The share prices are taken at the last day of the financial year. Share prices of M& S were
floating around 274 in the year 2019 at the ending of financial year. Prices of shares in 2016
were 405 and it has shown a declining trend since that year. However UK economy revived in
2019 letting the companies to have increased value of market capitalisation with rise in their
share prices. in comparison with Primark share prices of the M&S are very low. This shows that
Primark is well established and is having more confidence of the people. However decline in the
share prices is also due to its lowering profit rates. Investors are not getting the required benefits
from the company. On the other share prices are floating at much higher rate and it is required to
maintain sustainability in maintaining the rate of profits considering all other market risks.
Associated British Food market shares over the past five years.
2
tabler-icon-diamond-filled.svg

Paraphrase This Document

Need a fresh take? Get an instant paraphrase of this document with our AI Paraphraser
Document Page
Mean and Standard Deviation of Primark and Marks & Spencer
Share prices Marks & Spencer Primark
2016 405 2730
2017 337 3158
2018 267 2263
2019 274 2315
Mean 305.5 2522.5
Standard Deviation 64.39 417.12
This shows the average rate of share prices of Primark and its competitors over the four
years. Average share price of Primark during the four year was 2522 and of its competitor was
305. Standard deviation shows the deviation from mean value. Deviation in Primark seems to be
higher due to its high share prices where it is lower in M& S. Higher deviation shows that the
variable is having variation from the mean value that is the average share prices of the company
during the four years. However the share prices shows fluctuations on a daily basis, therefore on
the real market it is calculated on daily basis that gives more accurate mean and standard
deviation between the share prices over the defined period.
3
Document Page
Gross profit margin or the operating profit margin of the Primark and the other clothing stores,
using at least the three years data.
Gross profit Margin in %
Primark M&S Next TK Maxx
2016 23.44 39.11 34.77 28.79
2017 23.48 38.49 33.72 28.98
2018 23.01 35.92 33.44 28.89
2019 22.98 38.8 28.69 28.59
Operating profit margin in %
2016 7.7 5.5 16 7.4
2017 8.3 2.4 15.5 6.9
2018 8.2 1.5 14.6 7.3
2019 8.2 1.5 14.2 7.8
Gross profit margin
Primark
2016 2017 2018 2019
Sales 13399 15357 15574 15824
Cost of Sales 10258 11751 11990 12187
Gross profit margin 23.44% 23.48% 23.01% 22.98%
Primark is the clothing store in England that is owned by Associated British Foods. The
gross profit margin of the company represent the performance of company in managing the
trading and production operations of the business. Higher the gross better for the company to
carry out other business operation. Over the last four years company has maintained the level of
gross margin over the same scale. This shows the stability of company and its management.
Gross profit margin of the company during the year 2019 was 23% and the rate of profit is
maintained from last four years consistently. There are very slight fluctuations seen in the gross
profit margin (Tamayo-Torres, Gutierrez-Gutierrez and Ruiz-Moreno, 2019). Same rate of
profit does not refer to no growth in the revenues or cost. It is achieving growth every with rise
in revenues with equal proportion of rise in the company. This shows the efficiency of the
company in managing its resources. Management strategies of the company have helped them in
managing the stable growth and to have a control over its operations.
Marks & Spencer
2016 2017 2018 2019
4
Document Page
Sales 10555 10622 10377.3 10698
Cost of Sales 6427 6534 6650 6547
Gross profit margin 39.11% 38.49% 35.92% 38.80%
On the other its competitors Marks and Spencer is having gross profit margin ranging
between 38% to 40% during the last 4 years. Gross profit margin of M&S is higher than the
Primark group. This is may be due to the advantage gained by company due to the company is
more efficiently dealing the costs of production and trades. Gross profit margin rate shows that
M&S is using more effective strategies that is helping the company to grow with a stable rate
over the past few years. However the revenues of Primark are much higher as compared with
M&S. Cost of sales are comparatively low in Marks and Spencer. Everyone knows that company
is going through tough times and may suffer losses in the long run if does not take restructuring
steps improving the market position of company.
Operating profit margin
Primark
Operating profit 1035 1267 1284 1300
Sales 13399 15357 15574 15824
Operating profit margin 7.7% 8.3% 8.2% 8.2%
Operating profit refers to the amount left with company after carrying out all of its
operating expenses. A company with high profit margins is able to achieve its organisational
goals and objectives in more efficient way. This requires managing the operation in cost efficient
manner. Operating profit of Primark is 8.2% in 2019 and it has maintained the rate of 8%approx
from last four years. The rate of profit is higher of the company as per the industry average.
Operating profit margin of the company shows that the managers are not allowing the operating
expenses and costs to go beyond their reach (Wolcott and Sawhney, 2017). This shows that
company along with the production and trading cost is also managing the other operations costs
efficiently. It can further increase the profit margin by controlling its distribution cost and
increasing the sales of goods in new markets expanding the business.
Marks & Spencer
Operating profit 584 253 156.5 162
Sales 10555 10622 10377.3 10698
Operating profit margin 5.5% 2.4% 1.5% 1.5%
5
tabler-icon-diamond-filled.svg

Paraphrase This Document

Need a fresh take? Get an instant paraphrase of this document with our AI Paraphraser
Document Page
On the other, Marks and Spencer is having a profit margin of 1.5% that is dropping
constantly from 2016 in which it was 5.5%. There are many factors behind the decline of profit
rates. Though the gross margin rates are higher than that of Primark but the operating profit are
very low. The profits are continuously declining mainly because of the increased efforts of
company to increase its sales by promotion expenditures. The rate of selling and administrative
expenditures is very high in comparison with Primark is considerably high. It is requires to
monitors its expenses over selling and administrative costs for increasing its profit levels. But
due to these promotional costs company is able to maintain its customer base and revenues
levels. Seeing the competitor’s margin rate Primark is much more stable company.
The analysis shows that the Gross profit margin of M& S is the highest among all the
market competitors. It is the higher gross profit margin above 35% as compared with others and
Primark. This is due to the bulk purchases made by the company and the efficiency in managing
its costs of sales. However on the other side it is having the lowest operating profit margin ration
as compared with Primark and others. Company with the lowest gross profit margin is Primark.
Despite this it could not be said that the company is having the lowest profit margins. It has the
second highest level of operating profit margins after Next Plc. This shows that Primark is giving
strong competition to all the companies in the industry.
However the companies are strong competitor of each other in market. Both the
companies are having large market share and are also accepted by the customers. The recent
economic conditions of the country have dropped down the purchasing power of the competitors.
This has affected the revenues of company (Cullinane and et.al., 2019). The slowing economy is
affecting the share of the Primark. The external factors are affecting the functioning, but is has
managed to keep its return stable over the years.
6
Document Page
REFERENCES
Books and Journals
Tamayo-Torres, I., Gutierrez-Gutierrez, L. and Ruiz-Moreno, A., 2019. Boosting sustainability
and financial performance: the role of supply chain controversies. International Journal of
Production Research. 57(11). pp.3719-3734.
Wolcott, R.C. and Sawhney, M., 2017. Thomson financial: Building the customer-centric
firm. Kellogg School of Management Cases.
Cullinane, S., and et.al., 2019. Retail Clothing Returns: A Review of Key Issues.
In Contemporary Operations and Logistics (pp. 301-322). Palgrave Macmillan, Cham.
Campbell, G., and et.al., 2018. What moved share prices in the nineteenth‐century London stock
market?. The Economic History Review. 71(1). pp.157-189.
Online
ABF Annual Report. 2019. [Online]. Available through :
< http://www.abf.co.uk/file.axd?pointerID=d03ec6ad15eb4ccda8017a15d5bd50d7>.
London Stock Exchange. 2019. [Online]. Available through :
<https://www.londonstockexchange.com/exchange/prices-and-markets/stocks/summary/
company-summary-chart.html?fourWayKey=GB0006731235GBGBXSET1>.
7
chevron_up_icon
1 out of 9
circle_padding
hide_on_mobile
zoom_out_icon
[object Object]