Business Analysis Report: Sampling Techniques and Data Analysis
VerifiedAdded on 2023/01/10
|14
|5204
|68
Report
AI Summary
This report provides a comprehensive business analysis, focusing on a case study of Debenhams Plc. It begins with an introduction to business analysis, highlighting its importance in identifying company needs and providing solutions, including software development and process improvement. The report then delves into the significance of population and sampling techniques, explaining their roles in conducting surveys and collecting data. It explores the Malthus theory of population and differentiates between population and sampling, emphasizing the characteristics of a population and the importance of selecting appropriate sampling techniques to minimize bias. The report also contrasts primary and secondary data, outlining their differences, advantages, and disadvantages, and how they are used in research. It further discusses quantitative measures like mean, mode, and standard deviation, and concludes with the importance of effective management information systems for better decision-making. The analysis uses relevant concepts, models, and a case study of Debenhams Plc to support its findings.

Business Analysis
Paraphrase This Document
Need a fresh take? Get an instant paraphrase of this document with our AI Paraphraser
Table of Contents
INTRODUCTION......................................................................................................................3
QUESTION 1.............................................................................................................................3
Significance of Population.....................................................................................................3
Significance of sampling techniques......................................................................................4
QUESTION 2.............................................................................................................................6
Difference between primary and secondary data...................................................................6
Advantage and Disadvantage of primary and secondary data...............................................7
QUESTION 3.............................................................................................................................7
Mean ......................................................................................................................................7
Mode ......................................................................................................................................7
Standard deviation..................................................................................................................7
QUESTION 4.............................................................................................................................7
Importance of using effective management information system ..........................................7
CONCLUSION..........................................................................................................................7
INTRODUCTION
Business analysis is a research through which companies needs are identified and
provide a solutions of a specific problem as well. These solutions may also include the
software system development component and also consist of process improvement. In the
same way, current study is based upon the case study of Debenhams Plc which is top UK
retail firm and provide best shopping experience to their customers by providing best brands.
The current study main purpose is to provide an importance of business analysis so that
company may meet the further level of success.
The study will provide the significance of using sampling technique and population
by using relevant concept and models. Further, study will describe the difference between the
primary and secondary data with their pros and cons in which concepts and theories are
applied. Further, with the help of case study, scholar also choose proper quantitative measure
in order to calculate mean, mode and standard deviation by using excel. Lastly, study will
explain the importance of effective management information system in order to make better
decision for a company by using concepts and theories.
QUESTION 1
Significance of Population
While conducting a survey, populations plays an important role because it is an actual
population from which the survey data are collected from the data collection operations. In
the same way, when survey is conducted of the fellow colleagues to determine their response
of introducing a holiday pay scheme, researcher have to select the best sample from the
population (Wang and et.al., 2017). As it is not possible to involve entire population to get
their response and that is why, some are selected from a range of population. So, population
is refers as a number of people in a particular place.
Malthus’ Theory is consider the best theory for population which was introduced by
Thomas Robert Malthus who was a key figure to determine the population statistic which can
be used for conducting survey. The theory is fall under the principle such that there is a
strong attraction of two gender and thus, population could also be increased by multiples in
many years (Ernsting and et.al., 2017). Even there are many author who also criticize, as a
result, many new theories are further developed in order to examine the correct concepts.
⊘ This is a preview!⊘
Do you want full access?
Subscribe today to unlock all pages.
Trusted by 1+ million students worldwide
Moreover, there is a big difference between the population and sampling such that
population is a broader group of people from which researcher collect the answer and the
population will depend upon the scope of a study. In the presence scenario, for conducting a
survey, some sample is selected form the population and here population is the fellow
colleagues who provide answer whether holiday pay scheme is good or not. Even there are
many characteristic of population such that age, location, socio- economic data and race. So it
is depend upon the study through which sample is selected from the population size
(Formeister and et.al., 2018). Or else it can be stated that population can thus be said to be an
aggregate observation of subjects grouped together by a common feature.
In addition to this, the concept of a population also shows that unlike a sample, when
carrying out a statistical analysis of a population, there is no standard error to report because
such error inform the analysts using a sample how far their estimate may deviate the true
population. That is why, it can be vague or specific, which is based upon the need or scope of
a study (Shuva and et.al., 2016). For example, if a company wanted to know whether their all
customer are satisfied with the offered service and product and there are around more than
50000 customers. So it is quite challenging for the company to get answer from all, that is
why, survey is conducted in which sample is selected by using appropriate sampling
techniques that help to determine the answer. In this situation, 50000 is termed as a
population whereas, selected respondents for survey is known as sample size. Therefore, it is
clearly reflected that population is an aggregated observation of subjects that is grouped
together by a common feature.
Significance of sampling techniques
To conduct a survey, it is essential for the investigator to have a good knowledge of a
sampling technique because it is not possible to select entire population, so sample size is
selected by using techniques. Also, there are different sampling techniques available for the
qualitative as well as quantitative study. Sampling and sampling techniques are consider
important element of a primary research because it is impossible to conduct survey from an
entire population and thus to make sure that people in sample reflect the population or else
mislead the results too (Taherdoost, 2016). That is why, with the help of sampling and
sampling techniques, bias can be minimized and also investigator get their accurate results as
well. As there are two sampling techniques such that purposive and non- purposive.
Paraphrase This Document
Need a fresh take? Get an instant paraphrase of this document with our AI Paraphraser
Under purposive sampling technique, researcher completely relies upon the own
judgment while choosing members of a population to participate in a study. Also, the
significance of using this method is such that it is focus on the particular characteristic of a
population i.e. interest which assist the researcher to answer the research questions. This
method is used under qualitative as well as quantitative study, and the logic behind using this
sampling technique is to extract the sample from a population. On the other side, it is also
critically evaluated that under this sampling techniques there is a low level of reliability and
high level of bias but it help to generalize the results findings by getting proper results.
On the other side, non- purposive sampling technique is that sampling technique
where researcher select sample that is based upon the subjective judgment of a researcher
instead of random selection (Etikan, Alkassim and Abubakar, 2016). This method is cost and
time effective, it is simple to use as compared to probability method. Even it also have some
types which can be used by the researcher i.e. quote sampling, convenience sampling,
purposive sampling and snowball. These type of methods are used when researcher is based
upon quantitative study. This type of sampling method is used when member of population
are chosen during haphazard or accidental sampling. This is clearly stated that when a
researcher need to observe some specific issue in depth, they generally applied this method
and it is aim at conducting pilot studies mainly.
Also, as per the requirement, in order to conduct the survey of the fellow colleagues
to get the response of possibility of introducing a holiday pay scheme, researcher is selected
simple random sampling method in which some colleagues are selected through which
scholar get the answer in better manner. Moreover, purposive sampling method is selected
when investigator have only limited number of primary data sources who can easily
contribute to the study. That is why, as per the define task, it is clearly mention to collect
information from the fellow and as there is a limited source of primary data collection
method and that is why, it is essential to use the same (Leevy and et.al., 2018). On the other
hand, another importance of using this sampling technique which help to conduct the study
more effective is such that it develop the best meaning which will definitely benefit from an
intuitive approach and this in turn assist to collect the answer in better manner. Overall, it is
clearly analyzed that in order to reduce the sampling bias and also create accurate results
probability or purposive sampling technique is used that assist to provide a chance to
everyone in a population in order to provide best results.
QUESTION 2
Difference between primary and secondary data
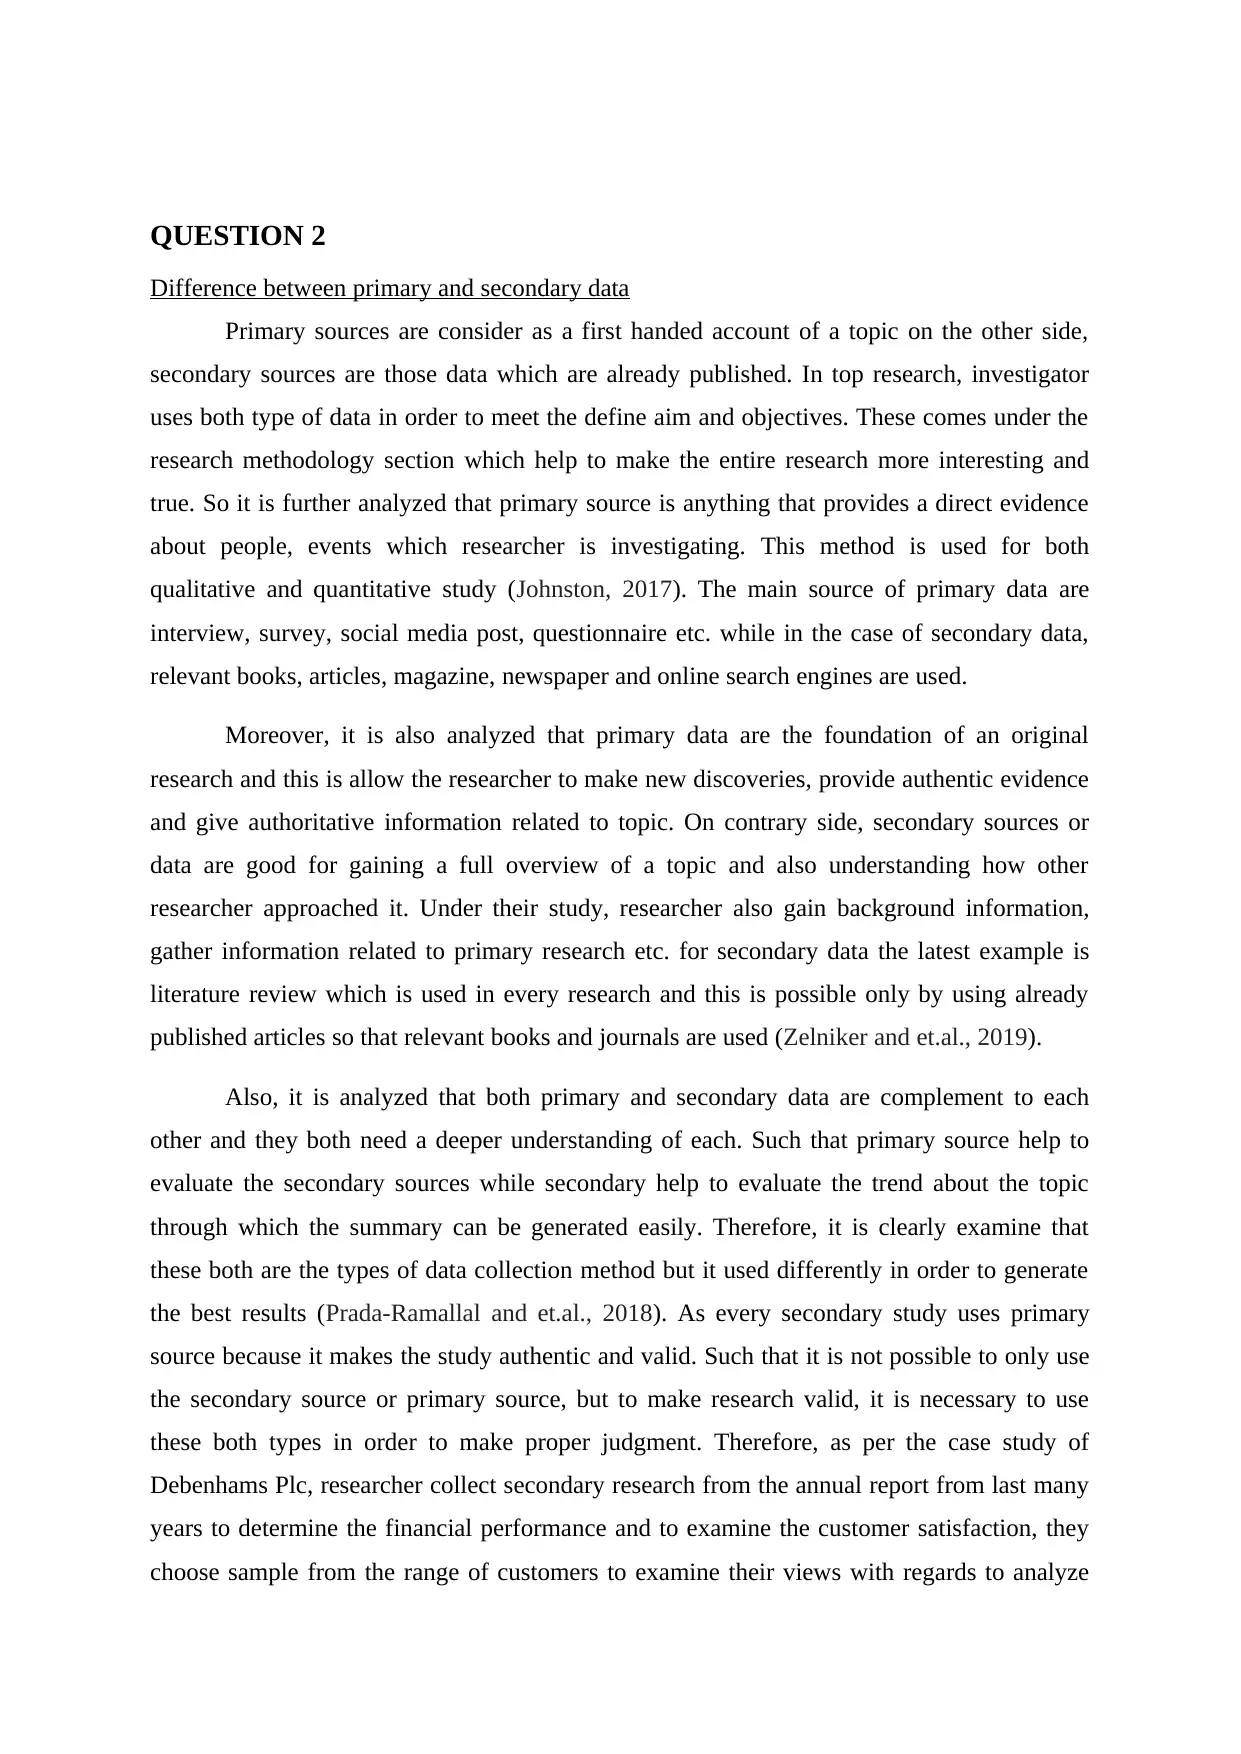
Primary sources are consider as a first handed account of a topic on the other side,
secondary sources are those data which are already published. In top research, investigator
uses both type of data in order to meet the define aim and objectives. These comes under the
research methodology section which help to make the entire research more interesting and
true. So it is further analyzed that primary source is anything that provides a direct evidence
about people, events which researcher is investigating. This method is used for both
qualitative and quantitative study (Johnston, 2017). The main source of primary data are
interview, survey, social media post, questionnaire etc. while in the case of secondary data,
relevant books, articles, magazine, newspaper and online search engines are used.
Moreover, it is also analyzed that primary data are the foundation of an original
research and this is allow the researcher to make new discoveries, provide authentic evidence
and give authoritative information related to topic. On contrary side, secondary sources or
data are good for gaining a full overview of a topic and also understanding how other
researcher approached it. Under their study, researcher also gain background information,
gather information related to primary research etc. for secondary data the latest example is
literature review which is used in every research and this is possible only by using already
published articles so that relevant books and journals are used (Zelniker and et.al., 2019).
Also, it is analyzed that both primary and secondary data are complement to each
other and they both need a deeper understanding of each. Such that primary source help to
evaluate the secondary sources while secondary help to evaluate the trend about the topic
through which the summary can be generated easily. Therefore, it is clearly examine that
these both are the types of data collection method but it used differently in order to generate
the best results (Prada-Ramallal and et.al., 2018). As every secondary study uses primary
source because it makes the study authentic and valid. Such that it is not possible to only use
the secondary source or primary source, but to make research valid, it is necessary to use
these both types in order to make proper judgment. Therefore, as per the case study of
Debenhams Plc, researcher collect secondary research from the annual report from last many
years to determine the financial performance and to examine the customer satisfaction, they
choose sample from the range of customers to examine their views with regards to analyze
Difference between primary and secondary data
Primary sources are consider as a first handed account of a topic on the other side,
secondary sources are those data which are already published. In top research, investigator
uses both type of data in order to meet the define aim and objectives. These comes under the
research methodology section which help to make the entire research more interesting and
true. So it is further analyzed that primary source is anything that provides a direct evidence
about people, events which researcher is investigating. This method is used for both
qualitative and quantitative study (Johnston, 2017). The main source of primary data are
interview, survey, social media post, questionnaire etc. while in the case of secondary data,
relevant books, articles, magazine, newspaper and online search engines are used.
Moreover, it is also analyzed that primary data are the foundation of an original
research and this is allow the researcher to make new discoveries, provide authentic evidence
and give authoritative information related to topic. On contrary side, secondary sources or
data are good for gaining a full overview of a topic and also understanding how other
researcher approached it. Under their study, researcher also gain background information,
gather information related to primary research etc. for secondary data the latest example is
literature review which is used in every research and this is possible only by using already
published articles so that relevant books and journals are used (Zelniker and et.al., 2019).
Also, it is analyzed that both primary and secondary data are complement to each
other and they both need a deeper understanding of each. Such that primary source help to
evaluate the secondary sources while secondary help to evaluate the trend about the topic
through which the summary can be generated easily. Therefore, it is clearly examine that
these both are the types of data collection method but it used differently in order to generate
the best results (Prada-Ramallal and et.al., 2018). As every secondary study uses primary
source because it makes the study authentic and valid. Such that it is not possible to only use
the secondary source or primary source, but to make research valid, it is necessary to use
these both types in order to make proper judgment. Therefore, as per the case study of
Debenhams Plc, researcher collect secondary research from the annual report from last many
years to determine the financial performance and to examine the customer satisfaction, they
choose sample from the range of customers to examine their views with regards to analyze
⊘ This is a preview!⊘
Do you want full access?
Subscribe today to unlock all pages.
Trusted by 1+ million students worldwide
whether company offer the best range of product to customer or not. So, it is clearly
determine that there is a use of both data in order to make the study valid and true.
Hence, as per the view of....the nature of primary data is in the form of raw material,
while in the case of secondary data, it is in the finished form. Also, collecting information by
using primary data is quite expensive in both term i.e. money and time terms while in the
case of secondary data, it is just opposite. In the terms of reliability and validity, primary data
is consider more reliable because it is collected for a particular purpose as compared to
secondary data because it may not match perfectly with the define purpose.
Advantage and Disadvantage of primary and secondary data
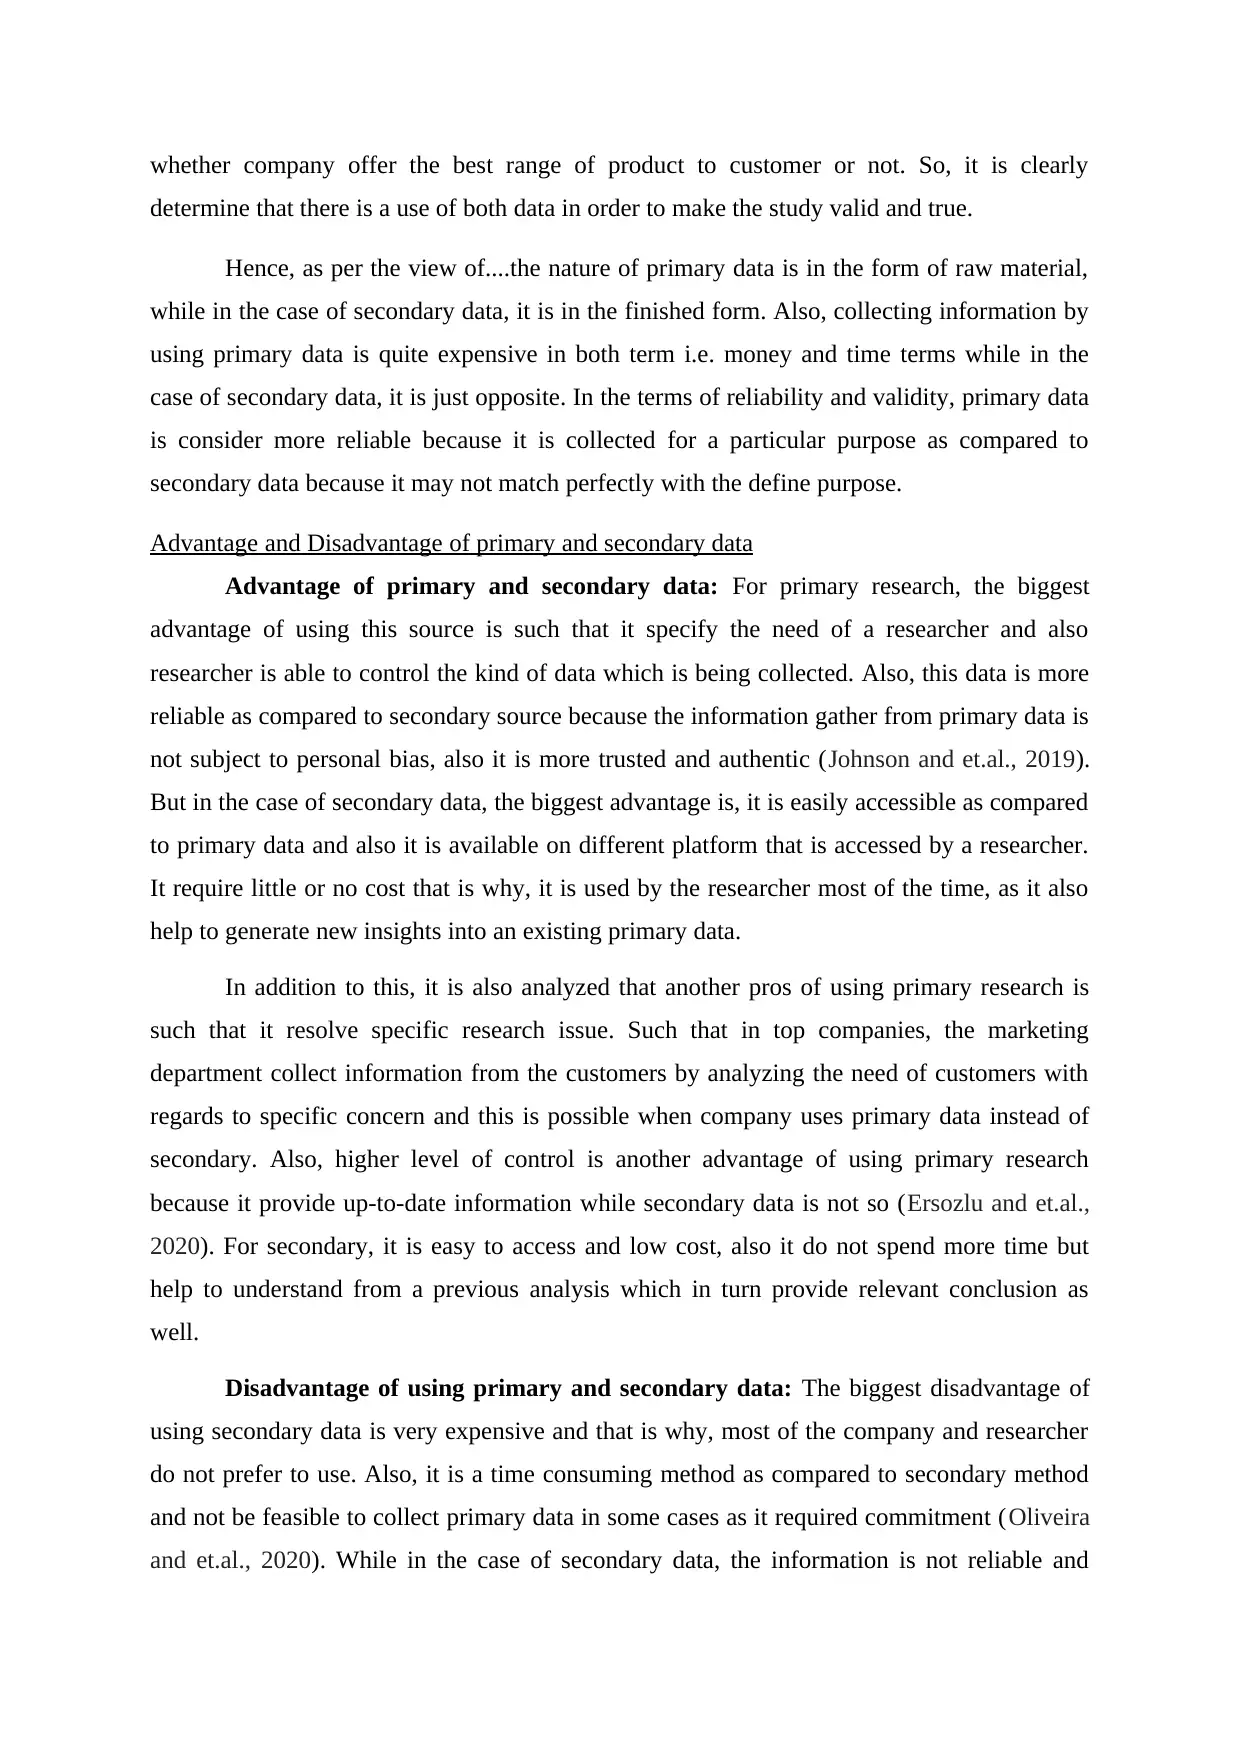
Advantage of primary and secondary data: For primary research, the biggest
advantage of using this source is such that it specify the need of a researcher and also
researcher is able to control the kind of data which is being collected. Also, this data is more
reliable as compared to secondary source because the information gather from primary data is
not subject to personal bias, also it is more trusted and authentic (Johnson and et.al., 2019).
But in the case of secondary data, the biggest advantage is, it is easily accessible as compared
to primary data and also it is available on different platform that is accessed by a researcher.
It require little or no cost that is why, it is used by the researcher most of the time, as it also
help to generate new insights into an existing primary data.
In addition to this, it is also analyzed that another pros of using primary research is
such that it resolve specific research issue. Such that in top companies, the marketing
department collect information from the customers by analyzing the need of customers with
regards to specific concern and this is possible when company uses primary data instead of
secondary. Also, higher level of control is another advantage of using primary research
because it provide up-to-date information while secondary data is not so (Ersozlu and et.al.,
2020). For secondary, it is easy to access and low cost, also it do not spend more time but
help to understand from a previous analysis which in turn provide relevant conclusion as
well.
Disadvantage of using primary and secondary data: The biggest disadvantage of
using secondary data is very expensive and that is why, most of the company and researcher
do not prefer to use. Also, it is a time consuming method as compared to secondary method
and not be feasible to collect primary data in some cases as it required commitment (Oliveira
and et.al., 2020). While in the case of secondary data, the information is not reliable and
determine that there is a use of both data in order to make the study valid and true.
Hence, as per the view of....the nature of primary data is in the form of raw material,
while in the case of secondary data, it is in the finished form. Also, collecting information by
using primary data is quite expensive in both term i.e. money and time terms while in the
case of secondary data, it is just opposite. In the terms of reliability and validity, primary data
is consider more reliable because it is collected for a particular purpose as compared to
secondary data because it may not match perfectly with the define purpose.
Advantage and Disadvantage of primary and secondary data
Advantage of primary and secondary data: For primary research, the biggest
advantage of using this source is such that it specify the need of a researcher and also
researcher is able to control the kind of data which is being collected. Also, this data is more
reliable as compared to secondary source because the information gather from primary data is
not subject to personal bias, also it is more trusted and authentic (Johnson and et.al., 2019).
But in the case of secondary data, the biggest advantage is, it is easily accessible as compared
to primary data and also it is available on different platform that is accessed by a researcher.
It require little or no cost that is why, it is used by the researcher most of the time, as it also
help to generate new insights into an existing primary data.
In addition to this, it is also analyzed that another pros of using primary research is
such that it resolve specific research issue. Such that in top companies, the marketing
department collect information from the customers by analyzing the need of customers with
regards to specific concern and this is possible when company uses primary data instead of
secondary. Also, higher level of control is another advantage of using primary research
because it provide up-to-date information while secondary data is not so (Ersozlu and et.al.,
2020). For secondary, it is easy to access and low cost, also it do not spend more time but
help to understand from a previous analysis which in turn provide relevant conclusion as
well.
Disadvantage of using primary and secondary data: The biggest disadvantage of
using secondary data is very expensive and that is why, most of the company and researcher
do not prefer to use. Also, it is a time consuming method as compared to secondary method
and not be feasible to collect primary data in some cases as it required commitment (Oliveira
and et.al., 2020). While in the case of secondary data, the information is not reliable and
Paraphrase This Document
Need a fresh take? Get an instant paraphrase of this document with our AI Paraphraser
authentic, that is why, scholar need to verify the data collected from a available sources. Also
lack of control is consider another disadvantage for secondary data. Such that in comparison
with primary method, there is a largely controlled by data driven marketer while secondary
information is lack quality. Also, while using secondary data, there is a need to evaluate the
reliability of an information by finding how an information is collected in better manner.
Beside this, it is also examine that, it sometimes do not provide proper information
because it is available at many places and that is why, it creates confusion. For example, in
order to determine the Debenhams Plc current position, every source of secondary data
provide different information which is more time consuming, though it is free to access.
Thus, it can be stated that there is no guarantee that the available information will be reliable
in most of the cases (Advantage and disadvantage of using secondary analysis, 2020). To
determine the market trend, consumer behavior secondary data is not reliable because it is not
static. While in the case of primary source, researcher find it more difficult to find sincere and
honest interviewers or there may be chances to face problem of non- response which
somehow affect the overall results in opposite manner.
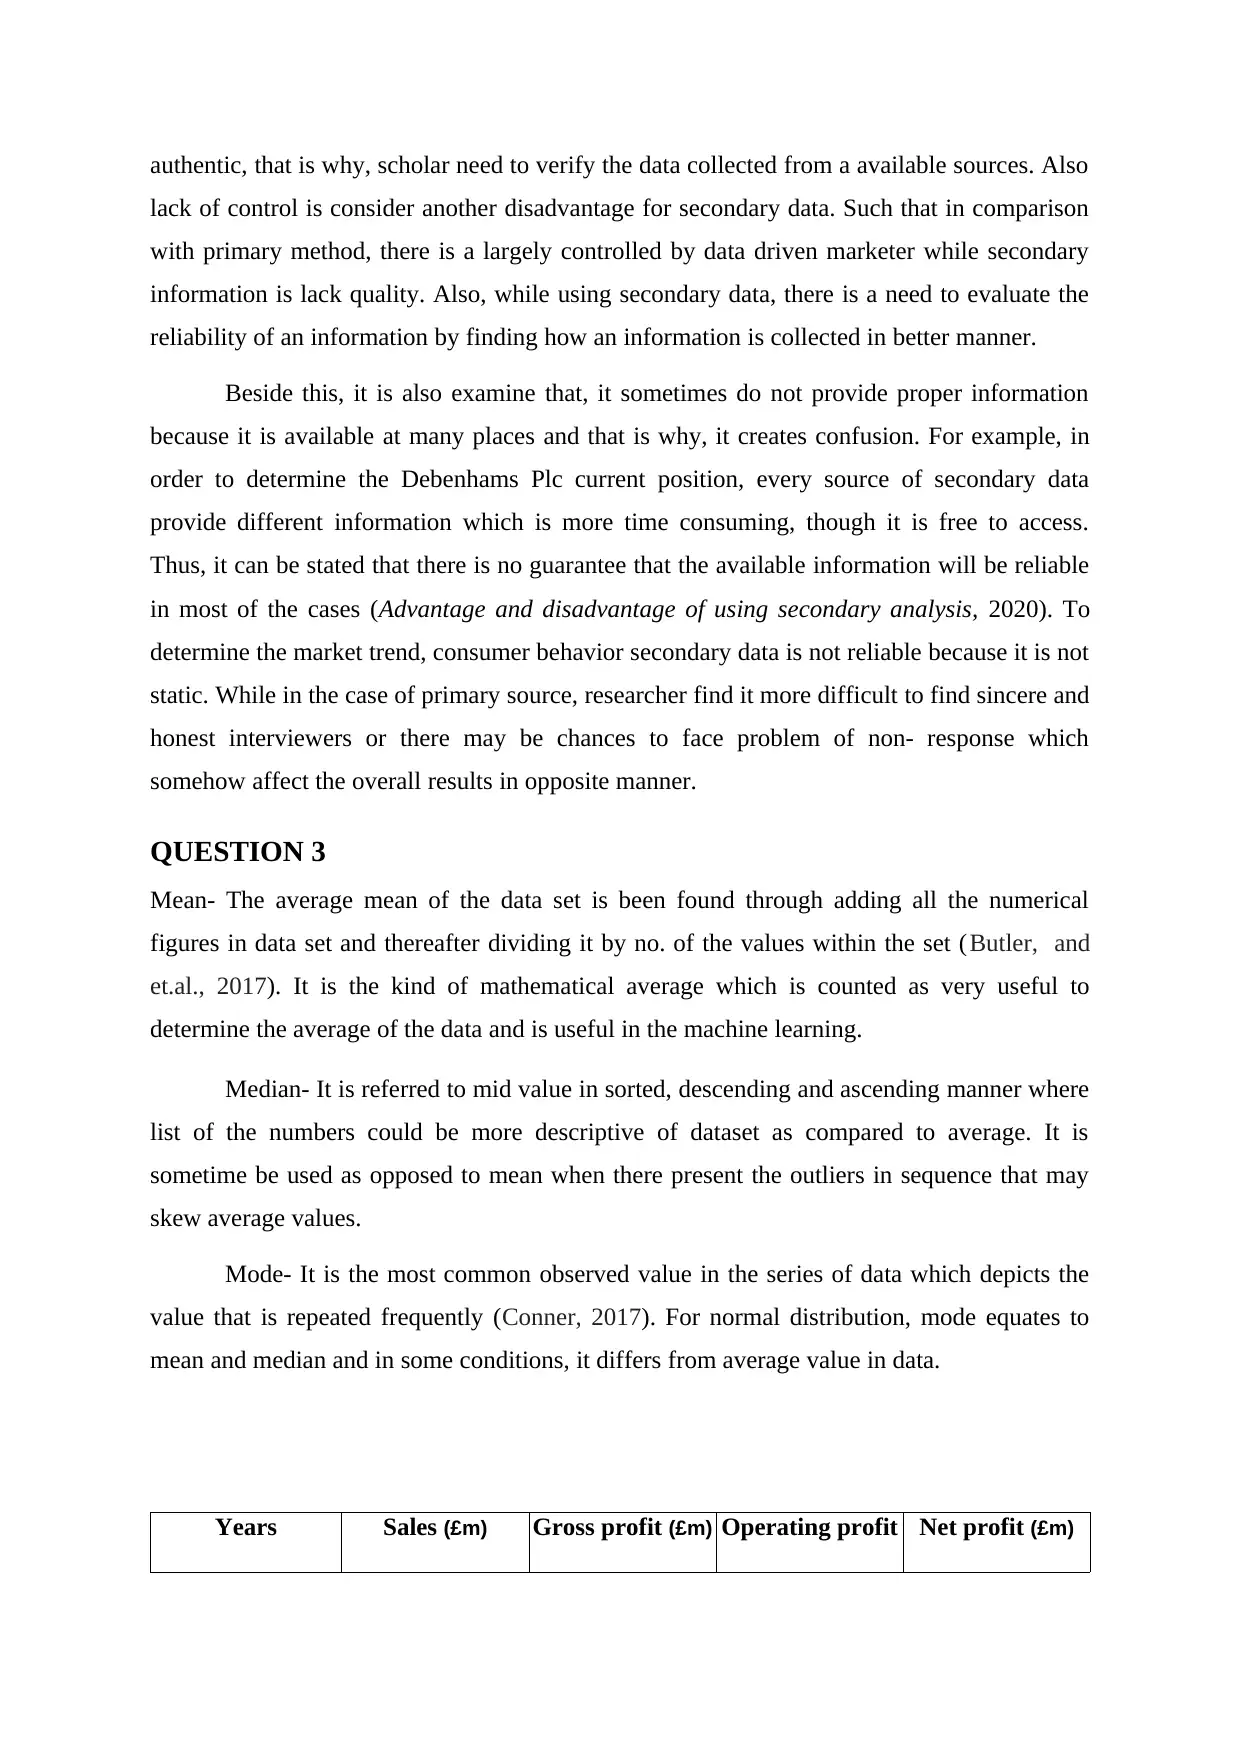
QUESTION 3
Mean- The average mean of the data set is been found through adding all the numerical
figures in data set and thereafter dividing it by no. of the values within the set (Butler, and
et.al., 2017). It is the kind of mathematical average which is counted as very useful to
determine the average of the data and is useful in the machine learning.
Median- It is referred to mid value in sorted, descending and ascending manner where
list of the numbers could be more descriptive of dataset as compared to average. It is
sometime be used as opposed to mean when there present the outliers in sequence that may
skew average values.
Mode- It is the most common observed value in the series of data which depicts the
value that is repeated frequently (Conner, 2017). For normal distribution, mode equates to
mean and median and in some conditions, it differs from average value in data.
Years Sales (£m) Gross profit (£m) Operating profit Net profit (£m)
lack of control is consider another disadvantage for secondary data. Such that in comparison
with primary method, there is a largely controlled by data driven marketer while secondary
information is lack quality. Also, while using secondary data, there is a need to evaluate the
reliability of an information by finding how an information is collected in better manner.
Beside this, it is also examine that, it sometimes do not provide proper information
because it is available at many places and that is why, it creates confusion. For example, in
order to determine the Debenhams Plc current position, every source of secondary data
provide different information which is more time consuming, though it is free to access.
Thus, it can be stated that there is no guarantee that the available information will be reliable
in most of the cases (Advantage and disadvantage of using secondary analysis, 2020). To
determine the market trend, consumer behavior secondary data is not reliable because it is not
static. While in the case of primary source, researcher find it more difficult to find sincere and
honest interviewers or there may be chances to face problem of non- response which
somehow affect the overall results in opposite manner.
QUESTION 3
Mean- The average mean of the data set is been found through adding all the numerical
figures in data set and thereafter dividing it by no. of the values within the set (Butler, and
et.al., 2017). It is the kind of mathematical average which is counted as very useful to
determine the average of the data and is useful in the machine learning.
Median- It is referred to mid value in sorted, descending and ascending manner where
list of the numbers could be more descriptive of dataset as compared to average. It is
sometime be used as opposed to mean when there present the outliers in sequence that may
skew average values.
Mode- It is the most common observed value in the series of data which depicts the
value that is repeated frequently (Conner, 2017). For normal distribution, mode equates to
mean and median and in some conditions, it differs from average value in data.
Years Sales (£m) Gross profit (£m) Operating profit Net profit (£m)
(£m)
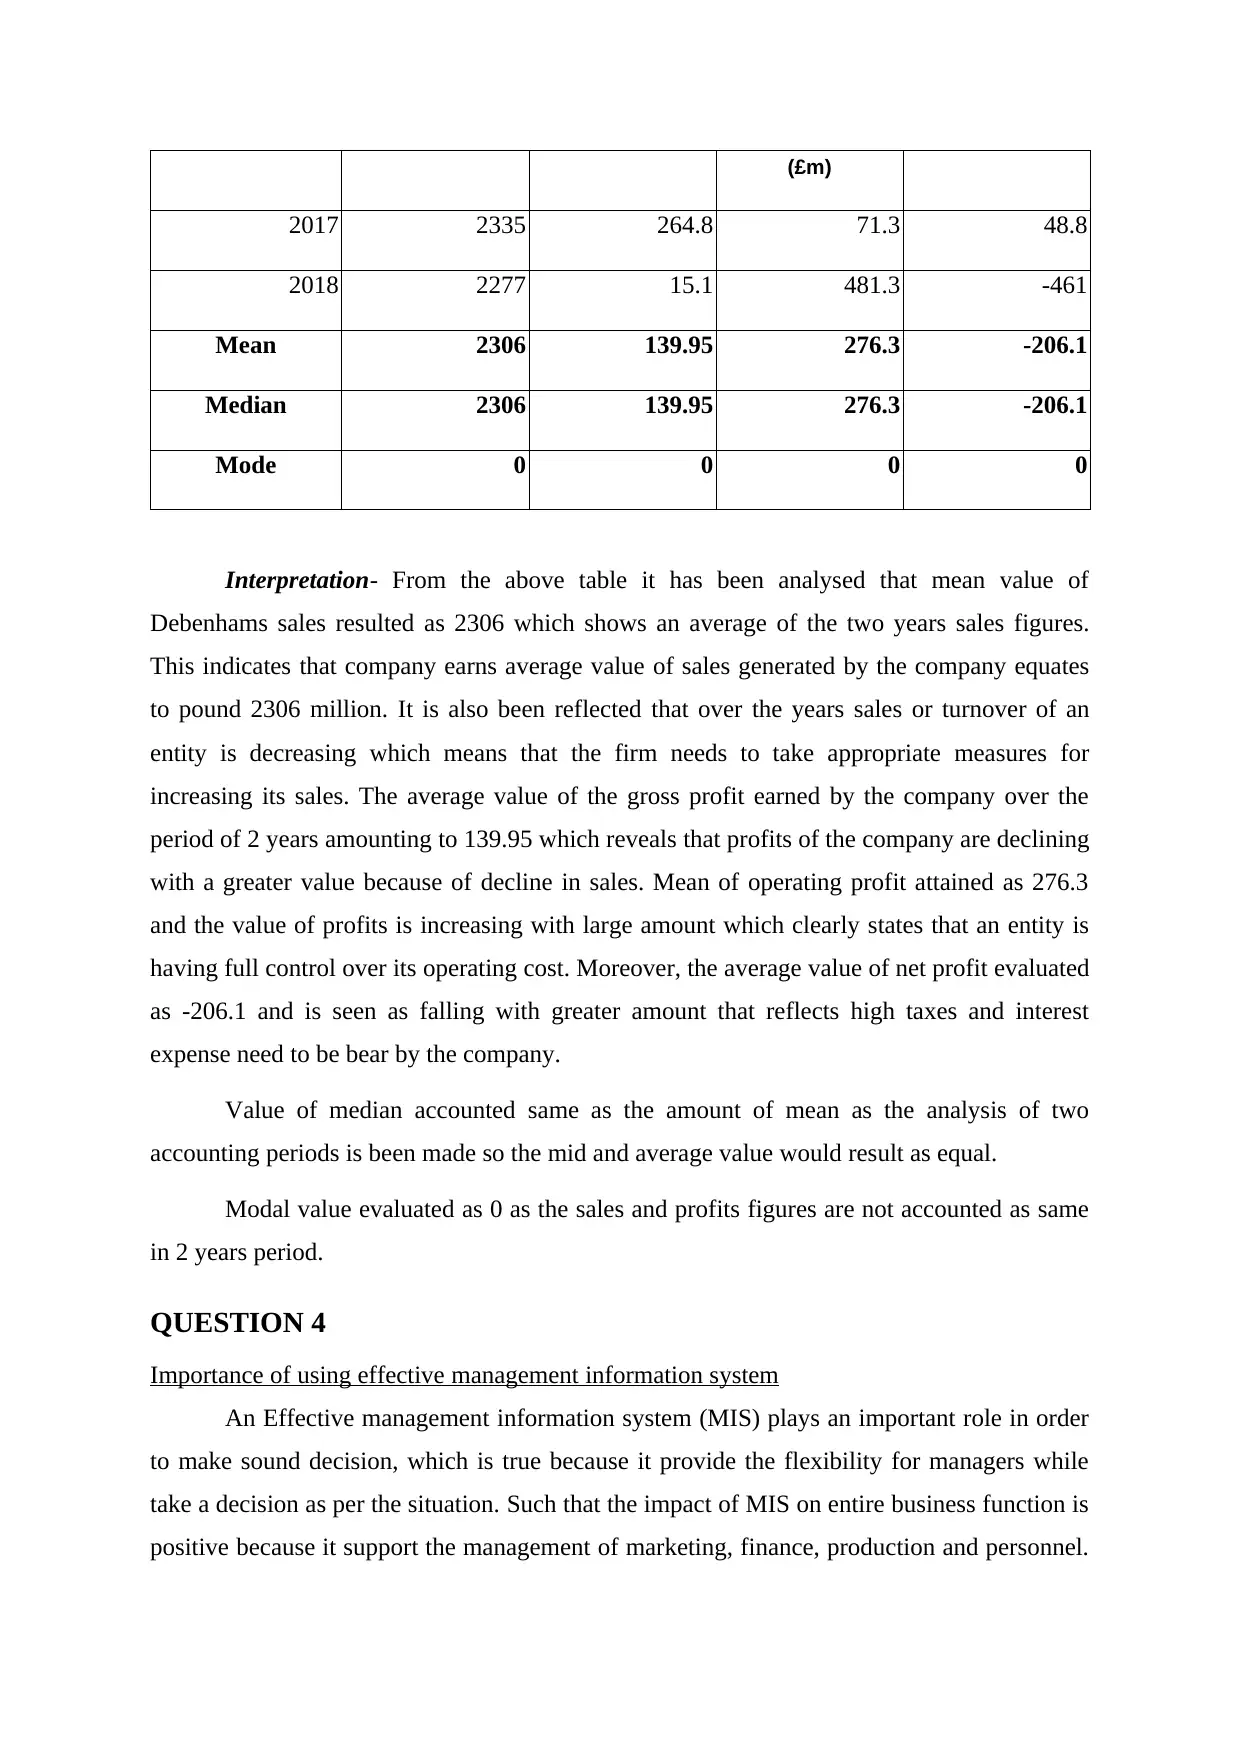
2017 2335 264.8 71.3 48.8
2018 2277 15.1 481.3 -461
Mean 2306 139.95 276.3 -206.1
Median 2306 139.95 276.3 -206.1
Mode 0 0 0 0
Interpretation- From the above table it has been analysed that mean value of
Debenhams sales resulted as 2306 which shows an average of the two years sales figures.
This indicates that company earns average value of sales generated by the company equates
to pound 2306 million. It is also been reflected that over the years sales or turnover of an
entity is decreasing which means that the firm needs to take appropriate measures for
increasing its sales. The average value of the gross profit earned by the company over the
period of 2 years amounting to 139.95 which reveals that profits of the company are declining
with a greater value because of decline in sales. Mean of operating profit attained as 276.3
and the value of profits is increasing with large amount which clearly states that an entity is
having full control over its operating cost. Moreover, the average value of net profit evaluated
as -206.1 and is seen as falling with greater amount that reflects high taxes and interest
expense need to be bear by the company.
Value of median accounted same as the amount of mean as the analysis of two
accounting periods is been made so the mid and average value would result as equal.
Modal value evaluated as 0 as the sales and profits figures are not accounted as same
in 2 years period.
QUESTION 4
Importance of using effective management information system
An Effective management information system (MIS) plays an important role in order
to make sound decision, which is true because it provide the flexibility for managers while
take a decision as per the situation. Such that the impact of MIS on entire business function is
positive because it support the management of marketing, finance, production and personnel.
⊘ This is a preview!⊘
Do you want full access?
Subscribe today to unlock all pages.
Trusted by 1+ million students worldwide
There are range of MIS that show the current performance that further contrast with projected
performance so that manager learn how the business lacking behind to meet the goals
(Beynon-Davies, 2020). In the same way, Debenhams Plc uses decision support system to
make the organizational decision. Like, it help to determine the poor performing employee
and in order to solve the issue, company may provide effective training system that help to
meet the define aim.
On the other side, Executive support system is another type of MIS which help top
executive to make decision by review the data and also provide direction to the company as
well. Thus, it is clearly stated that with the help of Management information system,
company is able to track the performance and this In turn assist to sustain the brand image of
the firm at different level. This system not only help the firm to track financial performance
bit it also report the things like employee performance, employee efficiency and compare the
performance with the projection as well as exceptions. So this is clearly shows that with the
help of this, company increase profit and quality in order to decrease cost which in turn help
to meet the define aim or needs of a customer as well (Glass, 2020). For example, for smooth
functioning of a daily operations, quoted firm uses Office- automation system which include
voicemail system, word processing programs and email. Though this is a basic system but it
is almost used by the employees within every organization for the better functioning of a
daily operations.
Also, decision making demand accurate and relevant information and that is why,
using effective MIS for timely information also assist to facilitate the decision making
process and assist in organization planning, control and operational functions to be carry out
in effective manner. This system help top level management for goal setting, strategic
planning and also evolve the business plans for their implementation (Selviyanti and
Sardjono, 2020). So, by using an effective MIS, that improve the operational flow by
providing required information at a right time in order to improve the productivity of a
business as well. Hence, it is examine that MIS help the company for making better decision
and raise brand image as well.
MIS plays a crucial role for the decision-making in the personal and professional life
and is required for effective and efficient functioning of the company. In today's world there
is a intense competition and is seen as imperative in taking suitable decisions. It facilitates
better flow of an information and is executes at each and every level of an entity. MIS helps
in obtaining, processing and controlling the information through the use of its applications.
Paraphrase This Document
Need a fresh take? Get an instant paraphrase of this document with our AI Paraphraser
It is needed for functioning role, for the support and for performing the task as per the set
strategies and the policies (Bertolino, S. and et.al). An effective MIS determines and gathers
data on all significant metrics of business operations of the firm. For instance- MIS facilitates
data relating to sales, profitability of the customers and level of market penetration.
Employees and the supervisors receives the report relating to productivity no. of the sick
leaves taken & payroll budgets. This type of data is been used for evaluating the performance
& in finding out the amount of funds that needs to be raised by the corporation.
MIS enables an entity in becoming as more competitive and identifies or reports the
relevant or irrelevant activity. This report provides an information to the owners which they
need for making the best possible decisions and improves performance of their staff and
entire business. It also assists the managers in strategic planning, operational control,
transaction processing and management control (Dennis, 2017). This system provides
answers for the queries on data pertaining to transaction, status of the particular record and
the reference on several documents.
There are several theories of MIS which can help the firm in running their operations
smoothly along with appropriate strategies and core competencies. The theories are as
follows-
Cognitive theory- There are mainly 2 types of the cognitive theories that includes fit
& dissonance theory. The former type of theory represents presentation of an information that
impacts the performance of the tasks. However, latter kind of theory is majorly concerned
with change for eliminating the inconsistencies between behaviours and the attitudes. For
example- Debenhams could use this theory for performing the task optimally and can
eliminate any kind of inconsistency present in attitudes of the workforce.
Task Technology- It means as the theory which holds an information with regard to
the technological capabilities that should be matched with the user tasks for the purpose of
gaining positive effect of technology on the activities of business. For example- Debenhams
can use this MIS technology for ensuring proper control and matching with set standards.
Interpersonal deception theory- This MIS theory views the deception by way of
theoretical lens of an interpersonal communication. Under this deception is counted as
interactive process that is present between the receiver & sender (Abdulrahman, Saleh and
Onuigbo, 2017). For instance- Debenhams in using this theory of MIS for improving
internal communication in the premises.
Socio-technical theory- It is seen as the best fit which is achieved through designing
the process aiming at joint optimization of sub-systems. This will helps in increasing the
productivity and enhancing performance of staff. By applying this theory an entity could
design its aims and objective in effective manner for ensuing the superior results and results
to harmony at the workplace.
CONCLUSION
By summing up above report is has been concluded that with the help for business
analysis help the company to meet the define need and make effective decision. On the other
side, as per the report, it is further concluded that population and different sampling
techniques are also essential while collecting primary research and that is why, there is a need
to select proper method of sampling in order to generate accurate results. Also, from the
study it has been concluded that both primary and secondary data analysis is used as per the
purpose but these both are different or complement of each other. Such that primary data
requires more time but collect authentic data, in secondary data, it is just opposite.
Also, by applying mean, mode and standard deviation, it has been further summarized
that the overall profit of the company is declining and by using MIS, company is also make
an effective decision making so that it will assist to meet the define target by using different
Management Information systems within a firm.
⊘ This is a preview!⊘
Do you want full access?
Subscribe today to unlock all pages.
Trusted by 1+ million students worldwide
1 out of 14
Related Documents


Your All-in-One AI-Powered Toolkit for Academic Success.
+13062052269
info@desklib.com
Available 24*7 on WhatsApp / Email
![[object Object]](/_next/static/media/star-bottom.7253800d.svg)
Unlock your academic potential
Copyright © 2020–2026 A2Z Services. All Rights Reserved. Developed and managed by ZUCOL.