Factors Affecting Academic Performance: Data Analysis Project
VerifiedAdded on 2022/07/28
|9
|2112
|24
Project
AI Summary
This research project analyzes factors influencing student academic performance using principal component analysis and factor analysis on a dataset from the Computer Science Department. The study aims to identify differential factors, focusing on variables such as gender, raising hands in class, resources visited, announcements viewed, discussions, student absence days, and class. The methodology includes descriptive statistics, principal component analysis, and factor analysis to determine the significance of each variable. Results show that male students are more than female students, student absence days are below 7 days. The study also explores the impact of class and participation. The project concludes with a discussion of the significant predictors of academic performance and references relevant studies. The project also includes an initial proposal, dataset analysis, and mathematical modeling.
Running head: RESEARCH PAPER 1
Research paper
<Name>
<University Name>
Research paper
<Name>
<University Name>
Paraphrase This Document
Need a fresh take? Get an instant paraphrase of this document with our AI Paraphraser
RESEARCH PAPER 2
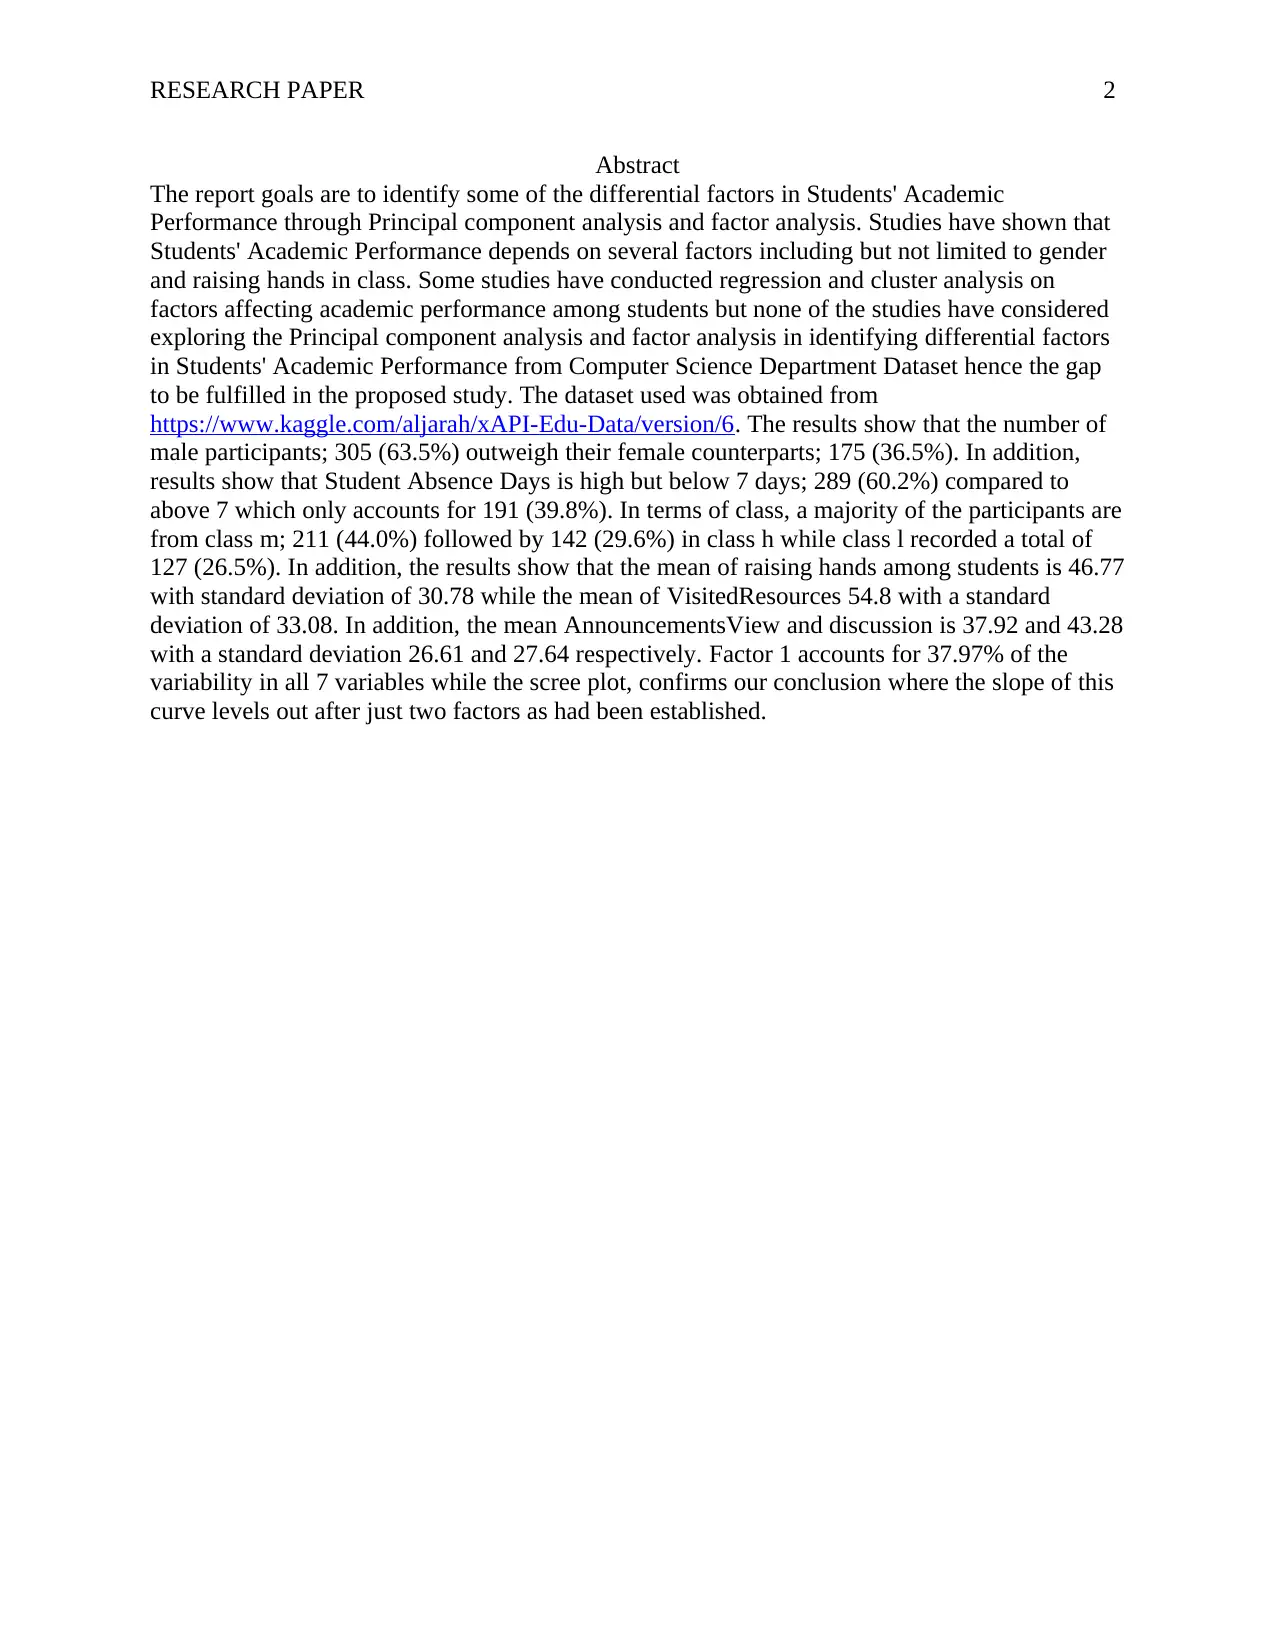
Abstract
The report goals are to identify some of the differential factors in Students' Academic
Performance through Principal component analysis and factor analysis. Studies have shown that
Students' Academic Performance depends on several factors including but not limited to gender
and raising hands in class. Some studies have conducted regression and cluster analysis on
factors affecting academic performance among students but none of the studies have considered
exploring the Principal component analysis and factor analysis in identifying differential factors
in Students' Academic Performance from Computer Science Department Dataset hence the gap
to be fulfilled in the proposed study. The dataset used was obtained from
https://www.kaggle.com/aljarah/xAPI-Edu-Data/version/6. The results show that the number of
male participants; 305 (63.5%) outweigh their female counterparts; 175 (36.5%). In addition,
results show that Student Absence Days is high but below 7 days; 289 (60.2%) compared to
above 7 which only accounts for 191 (39.8%). In terms of class, a majority of the participants are
from class m; 211 (44.0%) followed by 142 (29.6%) in class h while class l recorded a total of
127 (26.5%). In addition, the results show that the mean of raising hands among students is 46.77
with standard deviation of 30.78 while the mean of VisitedResources 54.8 with a standard
deviation of 33.08. In addition, the mean AnnouncementsView and discussion is 37.92 and 43.28
with a standard deviation 26.61 and 27.64 respectively. Factor 1 accounts for 37.97% of the
variability in all 7 variables while the scree plot, confirms our conclusion where the slope of this
curve levels out after just two factors as had been established.
RESEARCH PAPER 3
Table of Contents
Abstract............................................................................................................................................2
Deliverable 1: Research Project Initial Proposal.............................................................................3
1-Title of the project:.......................................................................................................................3
2- Problem Statement:.....................................................................................................................3
3- Background:................................................................................................................................3
4- Significance:................................................................................................................................3
5- Project description:......................................................................................................................4
6- Study gap:....................................................................................................................................4
7- Data analysis plan:.......................................................................................................................4
Deliverable 2: Dataset, Data Analysis, and Mathematical Modeling .............................................5
Descriptive results...........................................................................................................................5
Principal component analysis and factor analysis...........................................................................6
Factor analysis.................................................................................................................................6
References........................................................................................................................................8
⊘ This is a preview!⊘
Do you want full access?
Subscribe today to unlock all pages.
Trusted by 1+ million students worldwide
RESEARCH PAPER 4
Deliverable 1: Research Project Initial Proposal
1-Title of the project:
Principal component analysis and factor analysis in identifying differential factors in Students'
Academic Performance from Computer Science Department Dataset
2- Problem Statement:
The goals of the proposed research are to identify some of the differential factors in Students'
Academic Performance through Principal component analysis and factor analysis.
3- Background:
Normally, Students' Academic Performance depends on several factors. For instance, a study by
(Terrell, et, al, 2017) indicate that male students normally tend to perform better than female
students in computer science related subjects like IT. Furthermore, some authors (Good, &
Lavigne, 2017) also established that the performance of a student in class can be traced back
with how frequent the student was raising hands while in class. From this literature, there is
evidence that students who are likely to raise their hands most frequently in class are expected to
perform better in their academics, (Reynolds, 2019).
Furthermore, the number of resources visited by a student during their academic sessions in one
way or the other can determine their performance, (Vohs, et, al, 2018). Consistently, a study by
(Kraushaar, & Novak, 2019) indicate that students who least visit their resources are likely not to
do well in their academics compared to students with frequent visitations to resources assigned
by teachers.
Again, group discussion in class is expected to improve the academic performance of students in
class especially those taking computer related subjects, (Olakanmi, 2017). Therefore, through the
proposed study, predictions on the importance of group discussion in academic students will be
established, (Ognjanovic, Gasevic, & Dawson, 2016). Furthermore, several learning institutions
are known to group students per the stream, (Braun, 2017), hence it is prudent to find out
whether different class perform differently among computer students.
Most importantly, absenteeism is expected to influence academic performance of the students,
Robinson, et, al, 2018). Hence, the proposed study aims to identify how the student’s number of
absence days affects their academic performance and whether it is a good predictor in academic
performance.
4- Significance:
Through the study, contributing factors that influence academic performance are to be identified
so that appropriate actions are taken. Hence, the significant findings can help the policy makers
including curriculum developers can adopt the results in designing appropriate syllabus which
can be followed by all learners to improve their academic performance, (Cubillos, & Ilvento,
2019).
5- Project description:
With the research goal, the Principal component analysis and factor analysis in identifying
differential factors in Students' Academic Performance from Computer Science Department
Paraphrase This Document
Need a fresh take? Get an instant paraphrase of this document with our AI Paraphraser
RESEARCH PAPER 5
Dataset will be used so that significant associations can be identified as well as identifying gaps
that can inform other future studies.
6- Study gap:
Some studies have conducted regression and cluster analysis on factors affecting academic
performance among students but none of the studies have considered exploring the Principal
component analysis and factor analysis in identifying differential factors in Students' Academic
Performance from Computer Science Department Dataset hence the gap to be fulfilled in the
proposed study.
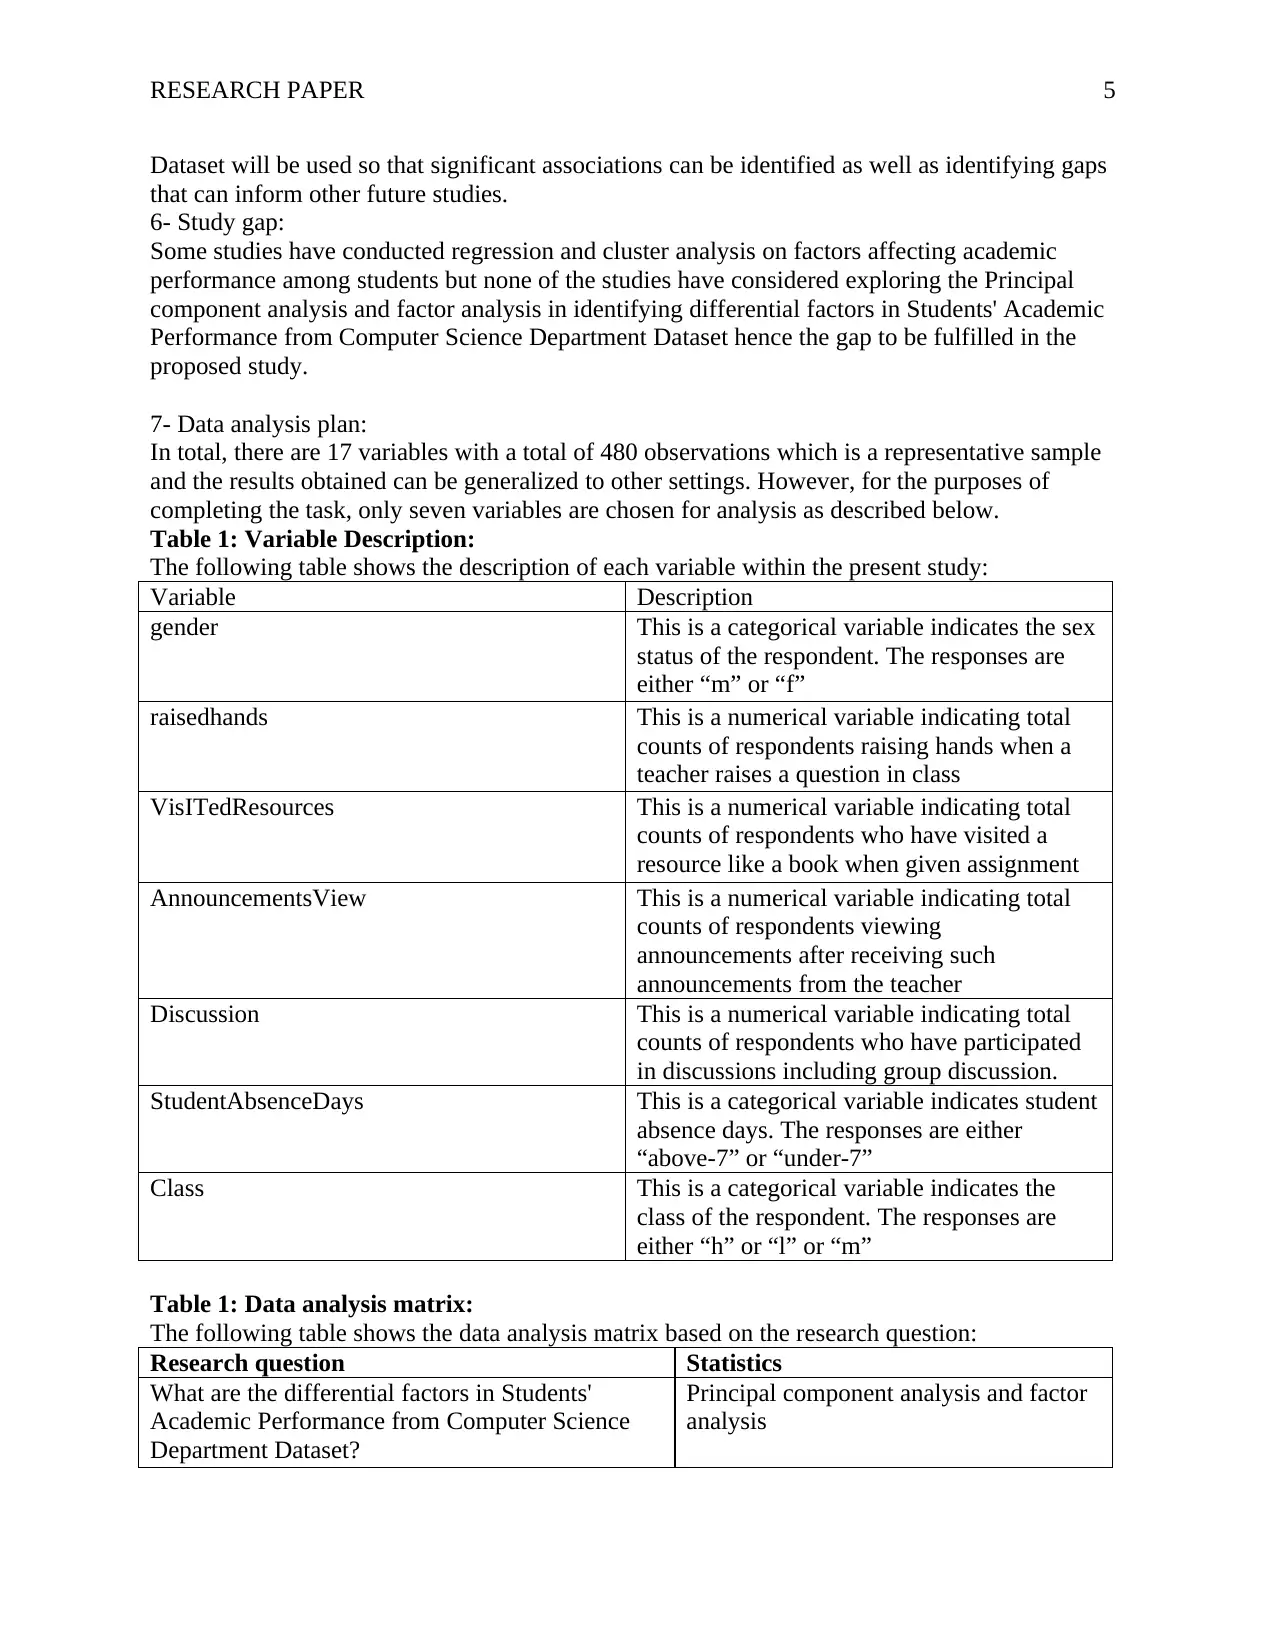
7- Data analysis plan:
In total, there are 17 variables with a total of 480 observations which is a representative sample
and the results obtained can be generalized to other settings. However, for the purposes of
completing the task, only seven variables are chosen for analysis as described below.
Table 1: Variable Description:
The following table shows the description of each variable within the present study:
Variable Description
gender This is a categorical variable indicates the sex
status of the respondent. The responses are
either “m” or “f”
raisedhands This is a numerical variable indicating total
counts of respondents raising hands when a
teacher raises a question in class
VisITedResources This is a numerical variable indicating total
counts of respondents who have visited a
resource like a book when given assignment
AnnouncementsView This is a numerical variable indicating total
counts of respondents viewing
announcements after receiving such
announcements from the teacher
Discussion This is a numerical variable indicating total
counts of respondents who have participated
in discussions including group discussion.
StudentAbsenceDays This is a categorical variable indicates student
absence days. The responses are either
“above-7” or “under-7”
Class This is a categorical variable indicates the
class of the respondent. The responses are
either “h” or “l” or “m”
Table 1: Data analysis matrix:
The following table shows the data analysis matrix based on the research question:
Research question Statistics
What are the differential factors in Students'
Academic Performance from Computer Science
Department Dataset?
Principal component analysis and factor
analysis
Dataset will be used so that significant associations can be identified as well as identifying gaps
that can inform other future studies.
6- Study gap:
Some studies have conducted regression and cluster analysis on factors affecting academic
performance among students but none of the studies have considered exploring the Principal
component analysis and factor analysis in identifying differential factors in Students' Academic
Performance from Computer Science Department Dataset hence the gap to be fulfilled in the
proposed study.
7- Data analysis plan:
In total, there are 17 variables with a total of 480 observations which is a representative sample
and the results obtained can be generalized to other settings. However, for the purposes of
completing the task, only seven variables are chosen for analysis as described below.
Table 1: Variable Description:
The following table shows the description of each variable within the present study:
Variable Description
gender This is a categorical variable indicates the sex
status of the respondent. The responses are
either “m” or “f”
raisedhands This is a numerical variable indicating total
counts of respondents raising hands when a
teacher raises a question in class
VisITedResources This is a numerical variable indicating total
counts of respondents who have visited a
resource like a book when given assignment
AnnouncementsView This is a numerical variable indicating total
counts of respondents viewing
announcements after receiving such
announcements from the teacher
Discussion This is a numerical variable indicating total
counts of respondents who have participated
in discussions including group discussion.
StudentAbsenceDays This is a categorical variable indicates student
absence days. The responses are either
“above-7” or “under-7”
Class This is a categorical variable indicates the
class of the respondent. The responses are
either “h” or “l” or “m”
Table 1: Data analysis matrix:
The following table shows the data analysis matrix based on the research question:
Research question Statistics
What are the differential factors in Students'
Academic Performance from Computer Science
Department Dataset?
Principal component analysis and factor
analysis
RESEARCH PAPER 6
Deliverable 2: Dataset, Data Analysis, and Mathematical Modeling
The dataset to be used in the analysis is obtained from https://www.kaggle.com/aljarah/xAPI-
Edu-Data/version/6.
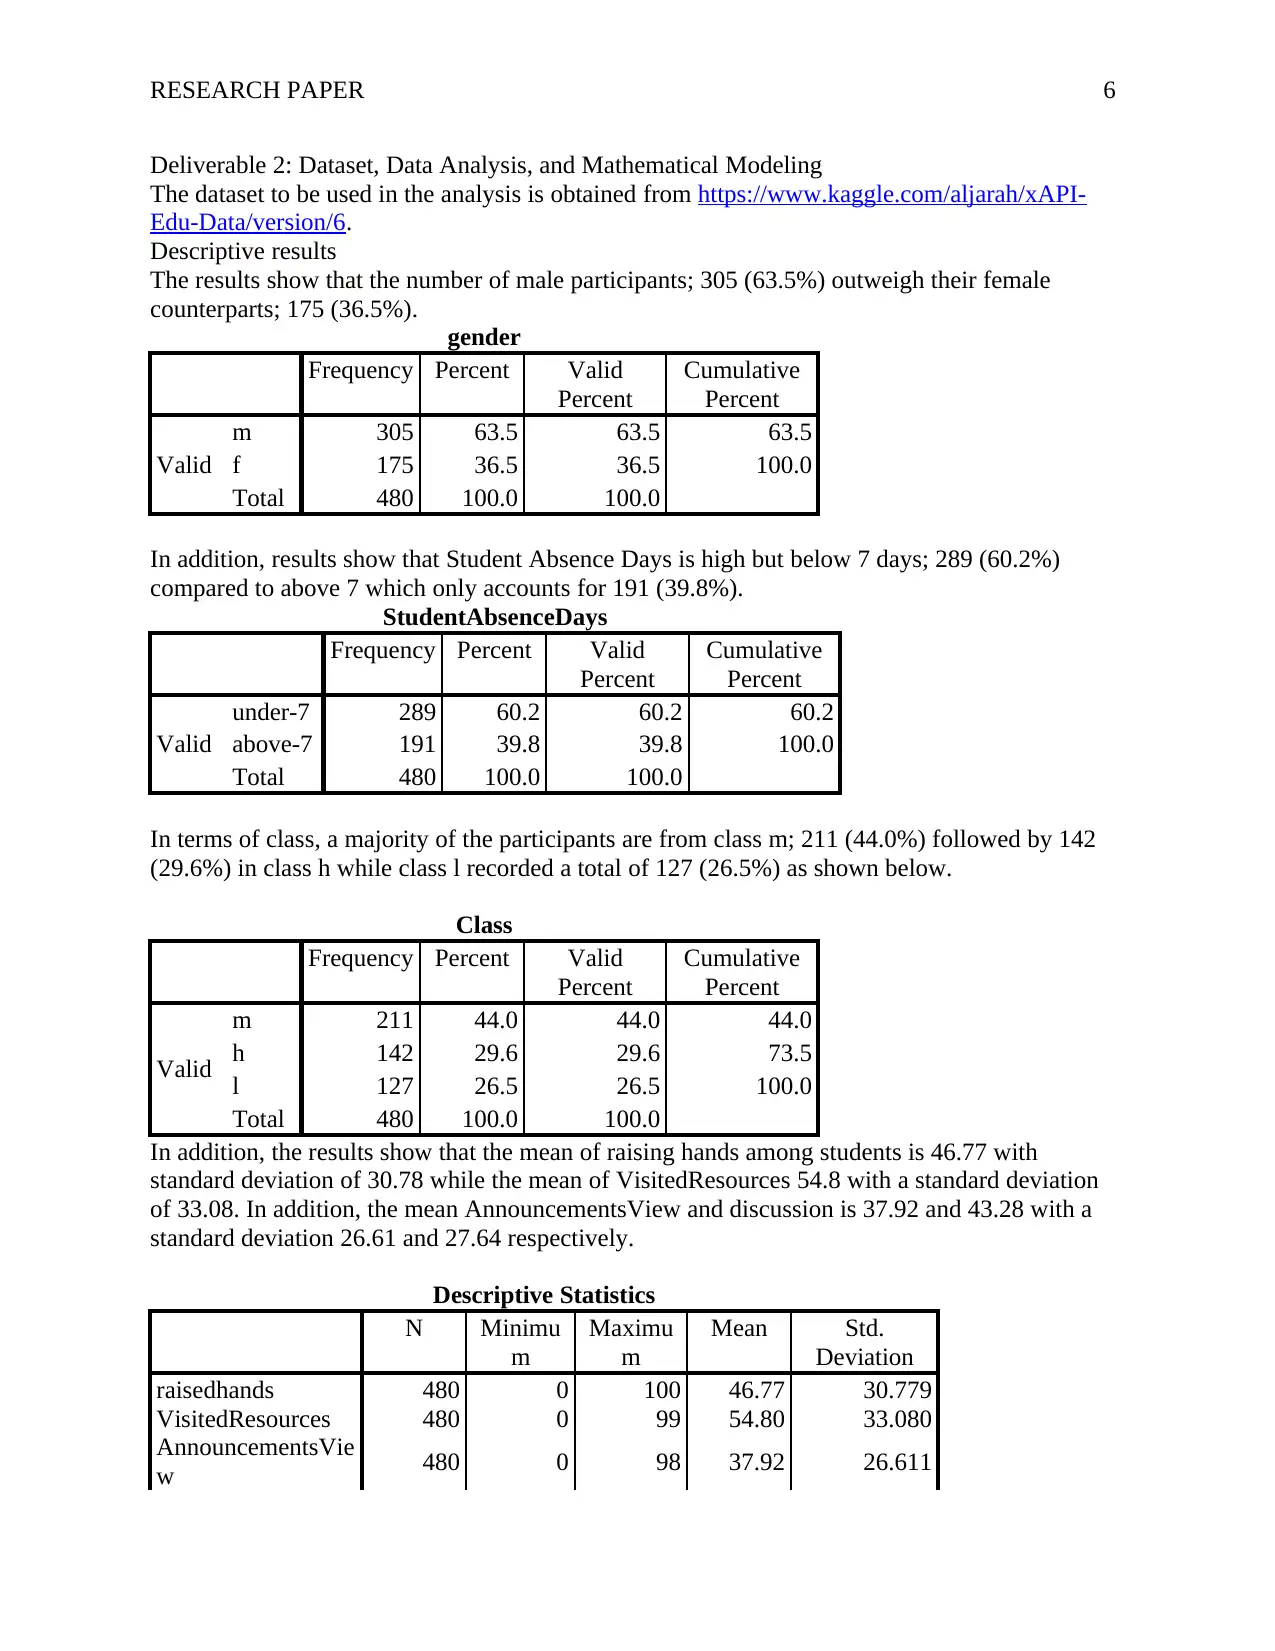
Descriptive results
The results show that the number of male participants; 305 (63.5%) outweigh their female
counterparts; 175 (36.5%).
gender
Frequency Percent Valid
Percent
Cumulative
Percent
Valid
m 305 63.5 63.5 63.5
f 175 36.5 36.5 100.0
Total 480 100.0 100.0
In addition, results show that Student Absence Days is high but below 7 days; 289 (60.2%)
compared to above 7 which only accounts for 191 (39.8%).
StudentAbsenceDays
Frequency Percent Valid
Percent
Cumulative
Percent
Valid
under-7 289 60.2 60.2 60.2
above-7 191 39.8 39.8 100.0
Total 480 100.0 100.0
In terms of class, a majority of the participants are from class m; 211 (44.0%) followed by 142
(29.6%) in class h while class l recorded a total of 127 (26.5%) as shown below.
Class
Frequency Percent Valid
Percent
Cumulative
Percent
Valid
m 211 44.0 44.0 44.0
h 142 29.6 29.6 73.5
l 127 26.5 26.5 100.0
Total 480 100.0 100.0
In addition, the results show that the mean of raising hands among students is 46.77 with
standard deviation of 30.78 while the mean of VisitedResources 54.8 with a standard deviation
of 33.08. In addition, the mean AnnouncementsView and discussion is 37.92 and 43.28 with a
standard deviation 26.61 and 27.64 respectively.
Descriptive Statistics
N Minimu
m
Maximu
m
Mean Std.
Deviation
raisedhands 480 0 100 46.77 30.779
VisitedResources 480 0 99 54.80 33.080
AnnouncementsVie
w 480 0 98 37.92 26.611
Deliverable 2: Dataset, Data Analysis, and Mathematical Modeling
The dataset to be used in the analysis is obtained from https://www.kaggle.com/aljarah/xAPI-
Edu-Data/version/6.
Descriptive results
The results show that the number of male participants; 305 (63.5%) outweigh their female
counterparts; 175 (36.5%).
gender
Frequency Percent Valid
Percent
Cumulative
Percent
Valid
m 305 63.5 63.5 63.5
f 175 36.5 36.5 100.0
Total 480 100.0 100.0
In addition, results show that Student Absence Days is high but below 7 days; 289 (60.2%)
compared to above 7 which only accounts for 191 (39.8%).
StudentAbsenceDays
Frequency Percent Valid
Percent
Cumulative
Percent
Valid
under-7 289 60.2 60.2 60.2
above-7 191 39.8 39.8 100.0
Total 480 100.0 100.0
In terms of class, a majority of the participants are from class m; 211 (44.0%) followed by 142
(29.6%) in class h while class l recorded a total of 127 (26.5%) as shown below.
Class
Frequency Percent Valid
Percent
Cumulative
Percent
Valid
m 211 44.0 44.0 44.0
h 142 29.6 29.6 73.5
l 127 26.5 26.5 100.0
Total 480 100.0 100.0
In addition, the results show that the mean of raising hands among students is 46.77 with
standard deviation of 30.78 while the mean of VisitedResources 54.8 with a standard deviation
of 33.08. In addition, the mean AnnouncementsView and discussion is 37.92 and 43.28 with a
standard deviation 26.61 and 27.64 respectively.
Descriptive Statistics
N Minimu
m
Maximu
m
Mean Std.
Deviation
raisedhands 480 0 100 46.77 30.779
VisitedResources 480 0 99 54.80 33.080
AnnouncementsVie
w 480 0 98 37.92 26.611
⊘ This is a preview!⊘
Do you want full access?
Subscribe today to unlock all pages.
Trusted by 1+ million students worldwide
RESEARCH PAPER 7
Discussion 480 1 99 43.28 27.638
Valid N (listwise) 480
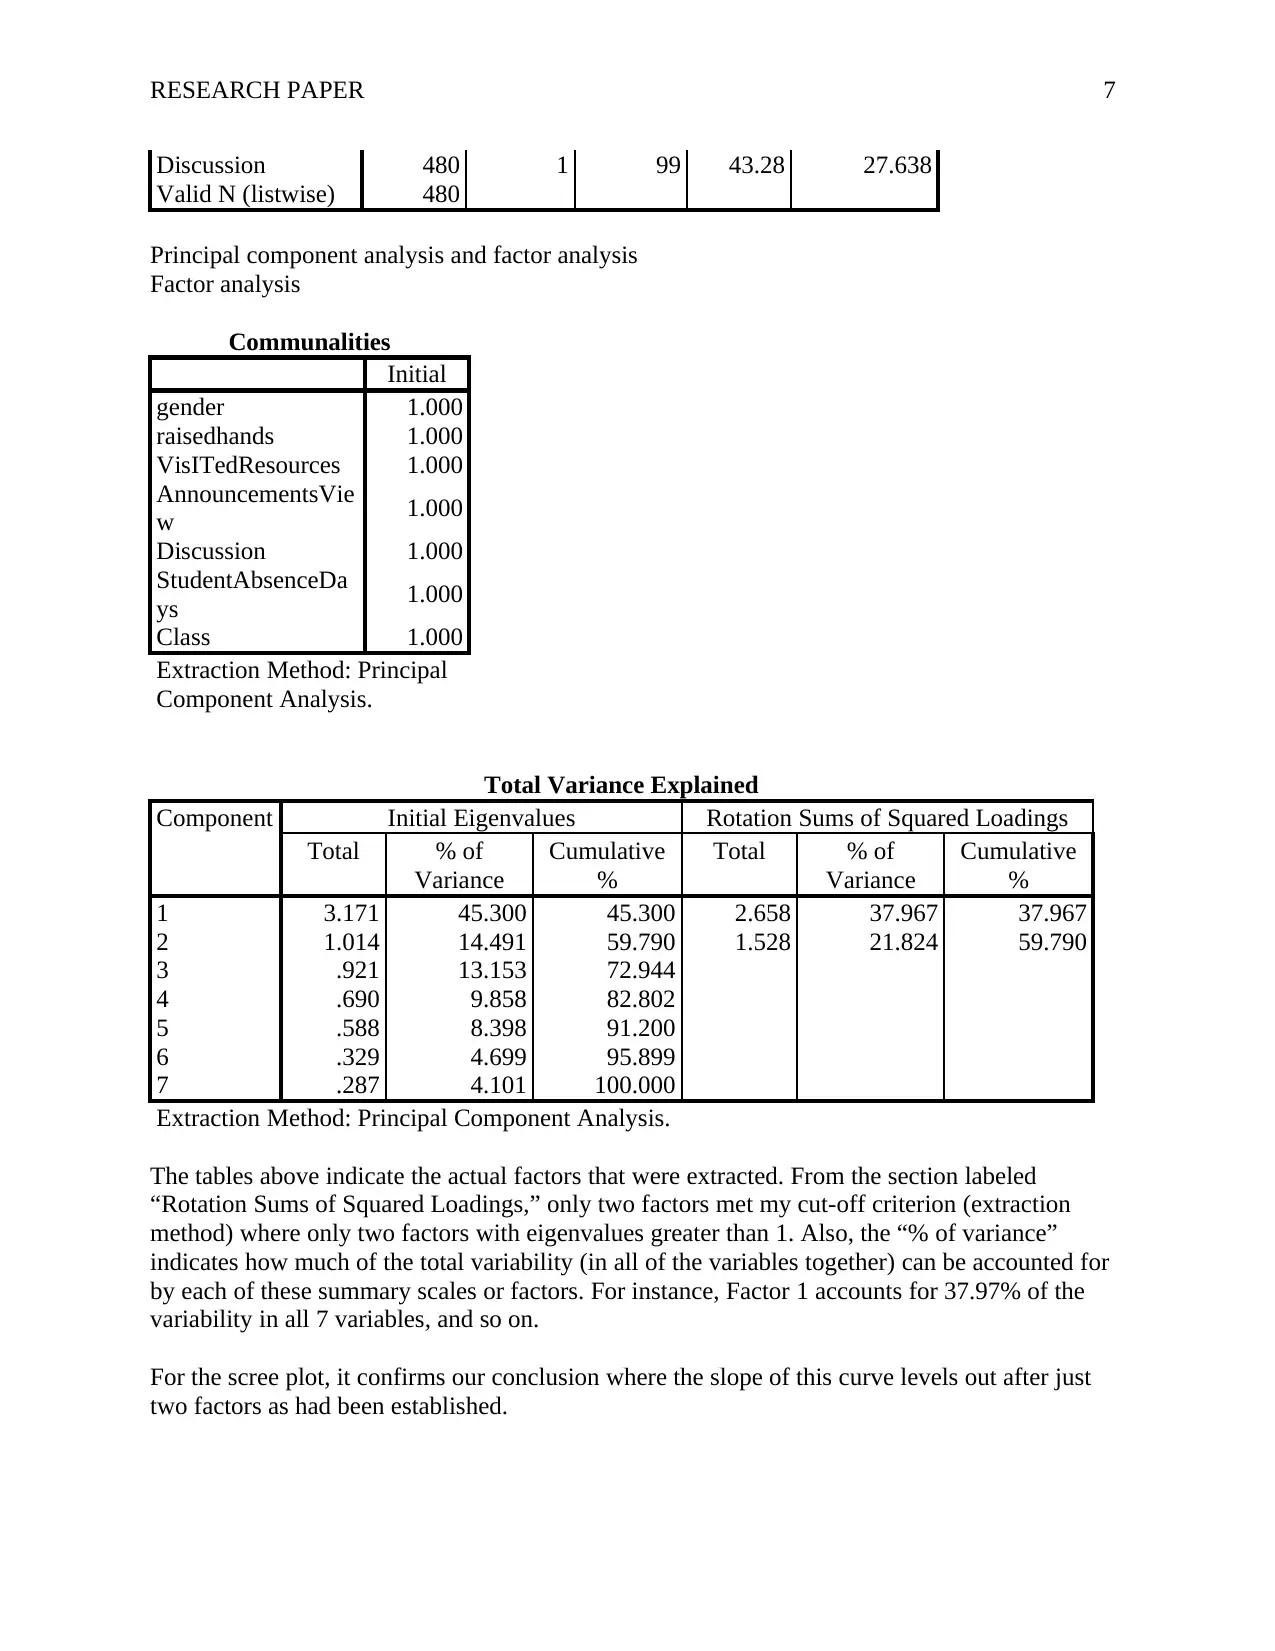
Principal component analysis and factor analysis
Factor analysis
Communalities
Initial
gender 1.000
raisedhands 1.000
VisITedResources 1.000
AnnouncementsVie
w 1.000
Discussion 1.000
StudentAbsenceDa
ys 1.000
Class 1.000
Extraction Method: Principal
Component Analysis.
Total Variance Explained
Component Initial Eigenvalues Rotation Sums of Squared Loadings
Total % of
Variance
Cumulative
%
Total % of
Variance
Cumulative
%
1 3.171 45.300 45.300 2.658 37.967 37.967
2 1.014 14.491 59.790 1.528 21.824 59.790
3 .921 13.153 72.944
4 .690 9.858 82.802
5 .588 8.398 91.200
6 .329 4.699 95.899
7 .287 4.101 100.000
Extraction Method: Principal Component Analysis.
The tables above indicate the actual factors that were extracted. From the section labeled
“Rotation Sums of Squared Loadings,” only two factors met my cut-off criterion (extraction
method) where only two factors with eigenvalues greater than 1. Also, the “% of variance”
indicates how much of the total variability (in all of the variables together) can be accounted for
by each of these summary scales or factors. For instance, Factor 1 accounts for 37.97% of the
variability in all 7 variables, and so on.
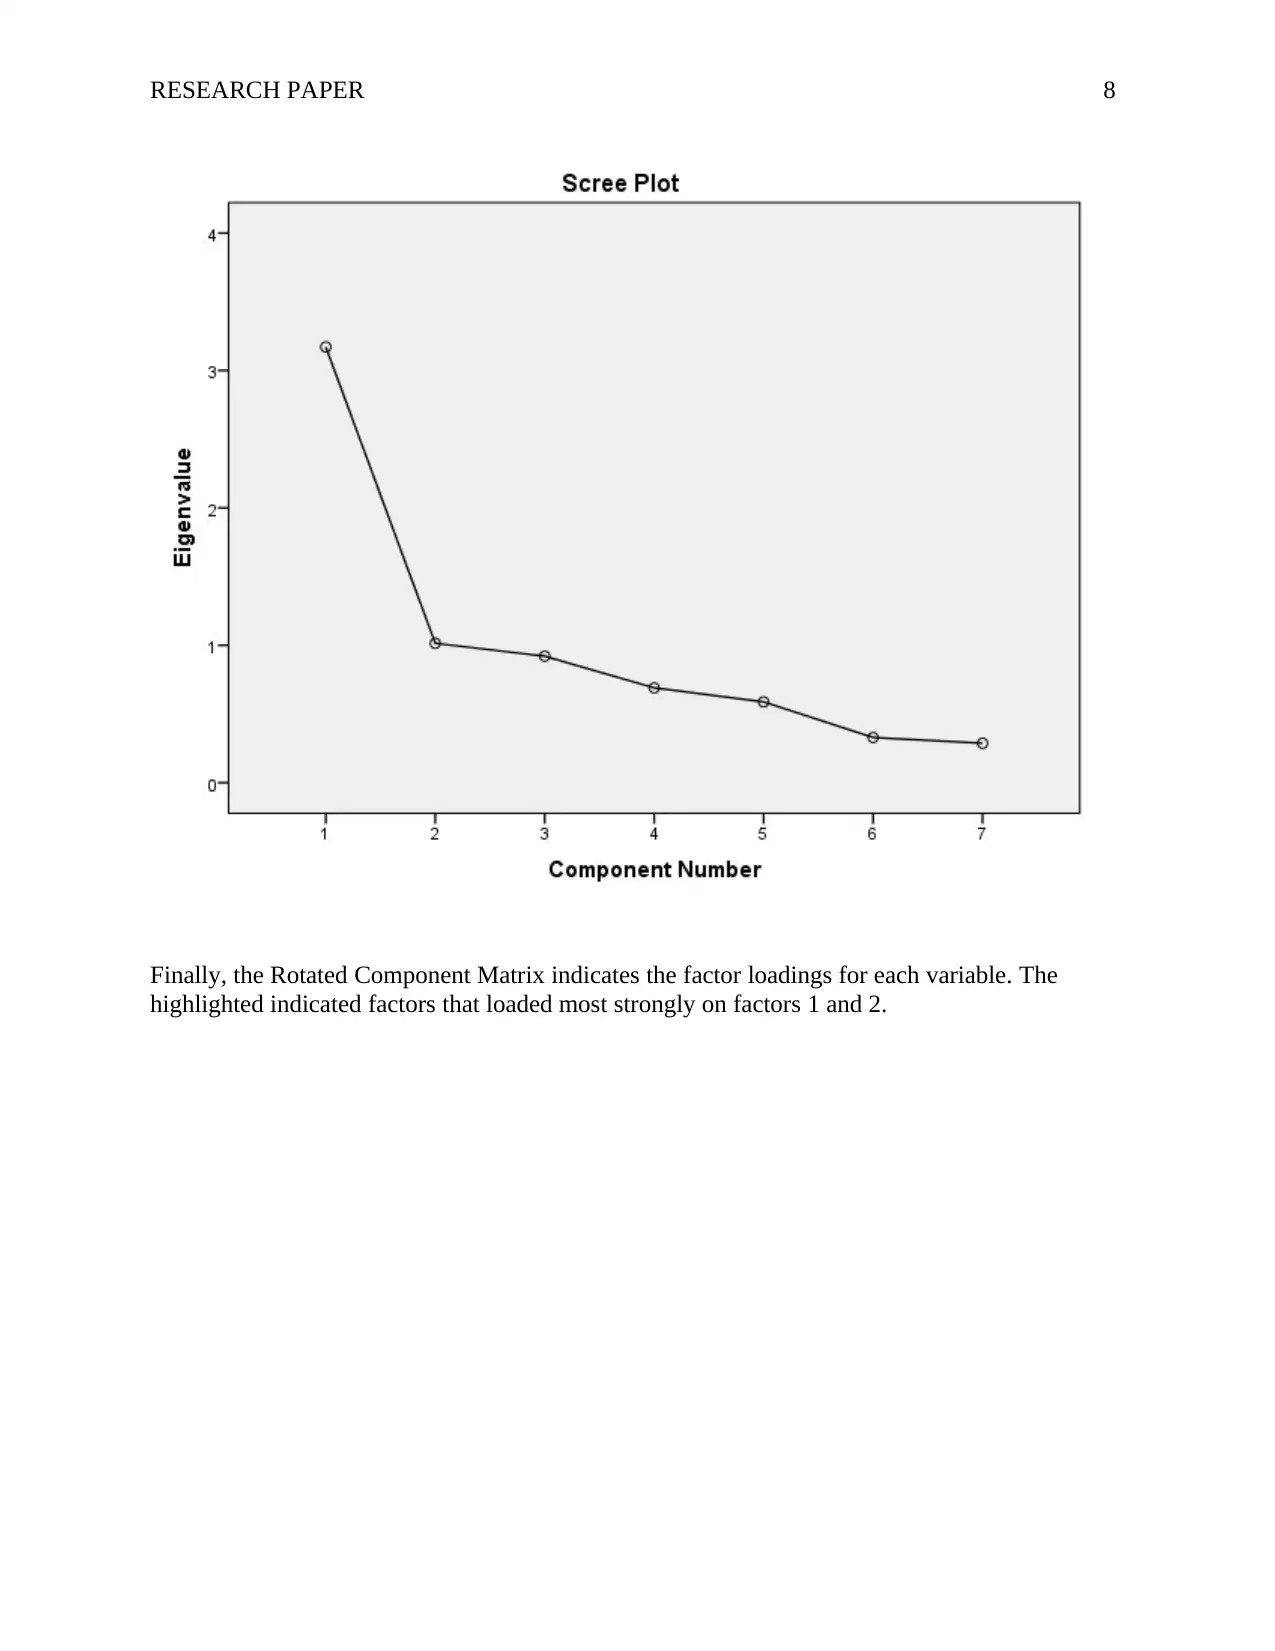
For the scree plot, it confirms our conclusion where the slope of this curve levels out after just
two factors as had been established.
Discussion 480 1 99 43.28 27.638
Valid N (listwise) 480
Principal component analysis and factor analysis
Factor analysis
Communalities
Initial
gender 1.000
raisedhands 1.000
VisITedResources 1.000
AnnouncementsVie
w 1.000
Discussion 1.000
StudentAbsenceDa
ys 1.000
Class 1.000
Extraction Method: Principal
Component Analysis.
Total Variance Explained
Component Initial Eigenvalues Rotation Sums of Squared Loadings
Total % of
Variance
Cumulative
%
Total % of
Variance
Cumulative
%
1 3.171 45.300 45.300 2.658 37.967 37.967
2 1.014 14.491 59.790 1.528 21.824 59.790
3 .921 13.153 72.944
4 .690 9.858 82.802
5 .588 8.398 91.200
6 .329 4.699 95.899
7 .287 4.101 100.000
Extraction Method: Principal Component Analysis.
The tables above indicate the actual factors that were extracted. From the section labeled
“Rotation Sums of Squared Loadings,” only two factors met my cut-off criterion (extraction
method) where only two factors with eigenvalues greater than 1. Also, the “% of variance”
indicates how much of the total variability (in all of the variables together) can be accounted for
by each of these summary scales or factors. For instance, Factor 1 accounts for 37.97% of the
variability in all 7 variables, and so on.
For the scree plot, it confirms our conclusion where the slope of this curve levels out after just
two factors as had been established.
Paraphrase This Document
Need a fresh take? Get an instant paraphrase of this document with our AI Paraphraser
RESEARCH PAPER 8
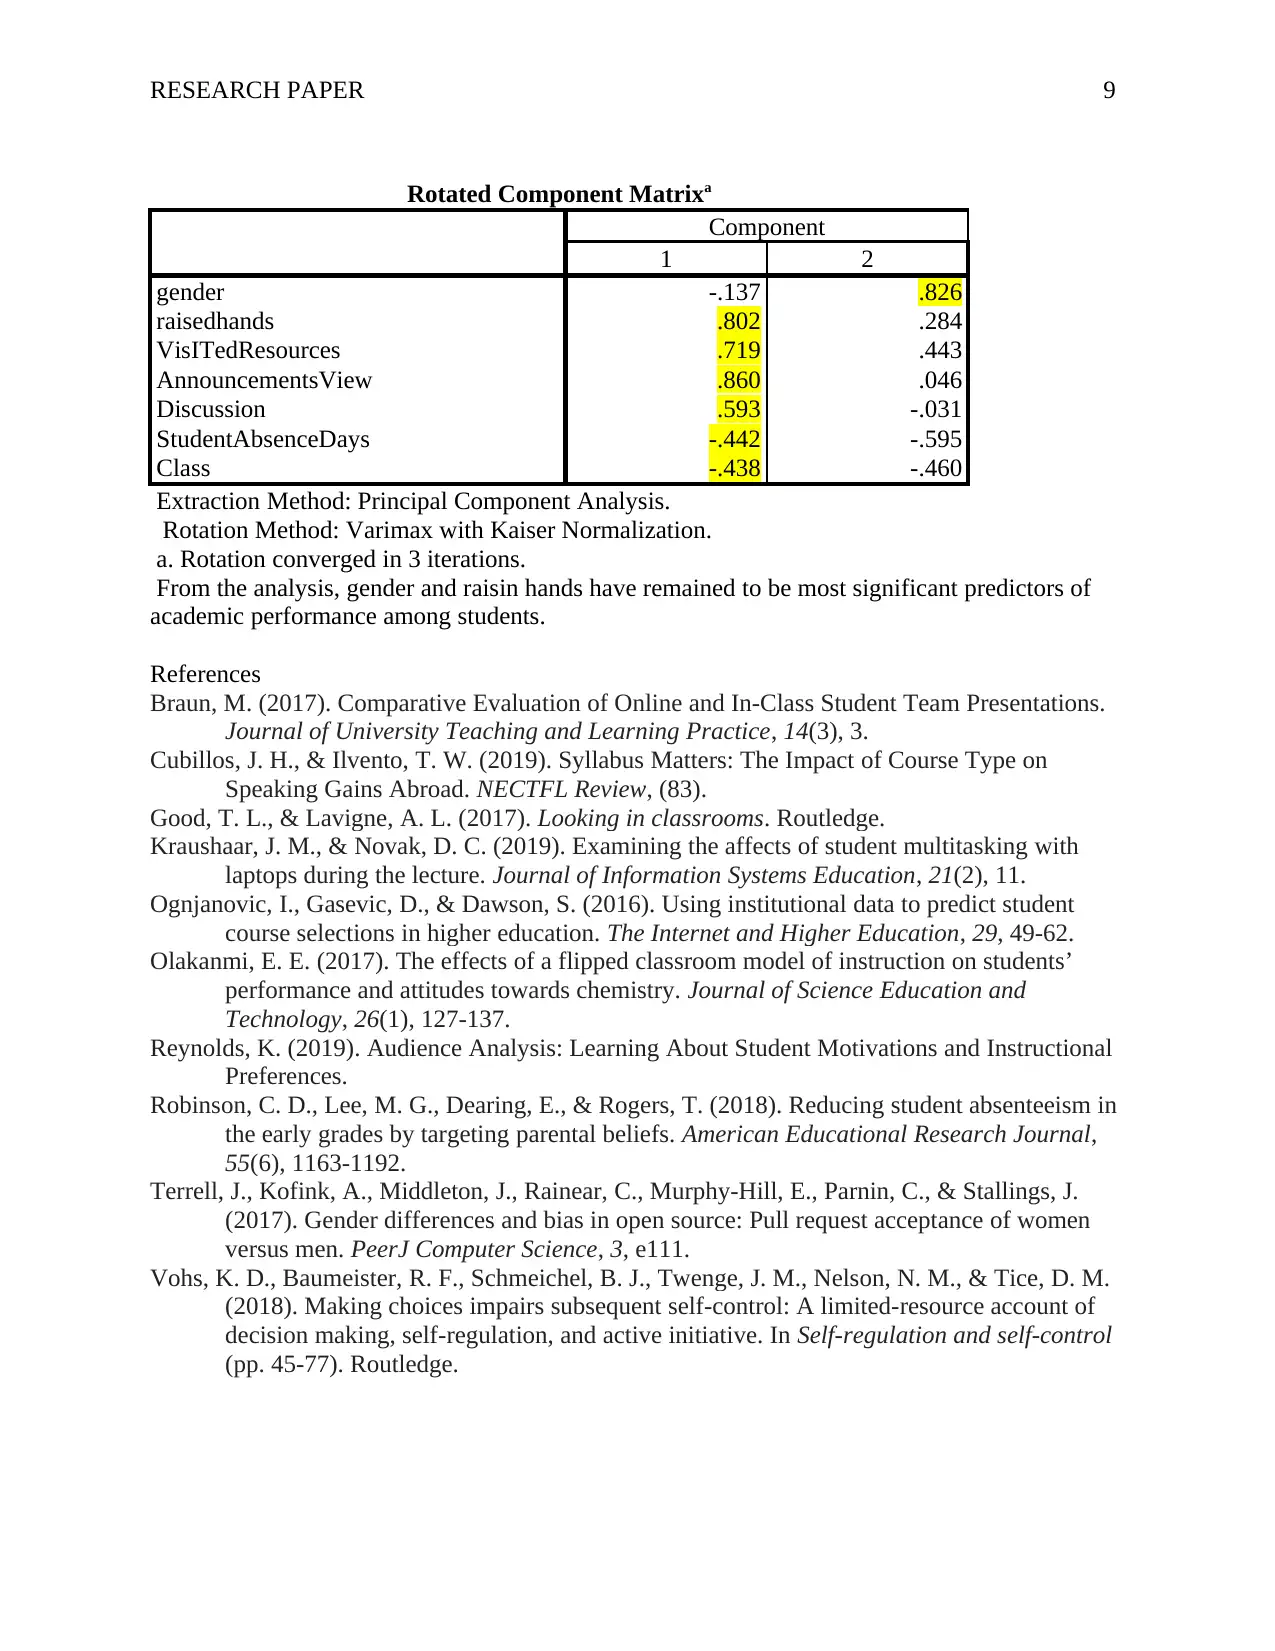
Finally, the Rotated Component Matrix indicates the factor loadings for each variable. The
highlighted indicated factors that loaded most strongly on factors 1 and 2.
Finally, the Rotated Component Matrix indicates the factor loadings for each variable. The
highlighted indicated factors that loaded most strongly on factors 1 and 2.
RESEARCH PAPER 9
Rotated Component Matrixa
Component
1 2
gender -.137 .826
raisedhands .802 .284
VisITedResources .719 .443
AnnouncementsView .860 .046
Discussion .593 -.031
StudentAbsenceDays -.442 -.595
Class -.438 -.460
Extraction Method: Principal Component Analysis.
Rotation Method: Varimax with Kaiser Normalization.
a. Rotation converged in 3 iterations.
From the analysis, gender and raisin hands have remained to be most significant predictors of
academic performance among students.
References
Braun, M. (2017). Comparative Evaluation of Online and In-Class Student Team Presentations.
Journal of University Teaching and Learning Practice, 14(3), 3.
Cubillos, J. H., & Ilvento, T. W. (2019). Syllabus Matters: The Impact of Course Type on
Speaking Gains Abroad. NECTFL Review, (83).
Good, T. L., & Lavigne, A. L. (2017). Looking in classrooms. Routledge.
Kraushaar, J. M., & Novak, D. C. (2019). Examining the affects of student multitasking with
laptops during the lecture. Journal of Information Systems Education, 21(2), 11.
Ognjanovic, I., Gasevic, D., & Dawson, S. (2016). Using institutional data to predict student
course selections in higher education. The Internet and Higher Education, 29, 49-62.
Olakanmi, E. E. (2017). The effects of a flipped classroom model of instruction on students’
performance and attitudes towards chemistry. Journal of Science Education and
Technology, 26(1), 127-137.
Reynolds, K. (2019). Audience Analysis: Learning About Student Motivations and Instructional
Preferences.
Robinson, C. D., Lee, M. G., Dearing, E., & Rogers, T. (2018). Reducing student absenteeism in
the early grades by targeting parental beliefs. American Educational Research Journal,
55(6), 1163-1192.
Terrell, J., Kofink, A., Middleton, J., Rainear, C., Murphy-Hill, E., Parnin, C., & Stallings, J.
(2017). Gender differences and bias in open source: Pull request acceptance of women
versus men. PeerJ Computer Science, 3, e111.
Vohs, K. D., Baumeister, R. F., Schmeichel, B. J., Twenge, J. M., Nelson, N. M., & Tice, D. M.
(2018). Making choices impairs subsequent self-control: A limited-resource account of
decision making, self-regulation, and active initiative. In Self-regulation and self-control
(pp. 45-77). Routledge.
⊘ This is a preview!⊘
Do you want full access?
Subscribe today to unlock all pages.
Trusted by 1+ million students worldwide
1 out of 9
Related Documents


Your All-in-One AI-Powered Toolkit for Academic Success.
+13062052269
info@desklib.com
Available 24*7 on WhatsApp / Email
![[object Object]](/_next/static/media/star-bottom.7253800d.svg)
Unlock your academic potential
Copyright © 2020–2026 A2Z Services. All Rights Reserved. Developed and managed by ZUCOL.