BUS5PB: Self-service Analytics Solution - Assignment 01 Report
VerifiedAdded on 2020/03/07
|13
|2280
|312
Report
AI Summary
This report presents an analysis of a self-service analytics assignment (BUS5PB) focusing on the Australian healthcare industry, particularly the beauty, health, and wellness sectors. The report begins with an introduction highlighting the market's growth and the increasing demand for natural healthcare products. It then critically evaluates a survey conducted to identify market opportunities, emphasizing the survey's appropriateness in targeting relevant consumers and collecting demographic and awareness data. The core of the report comprises two analytical solutions developed using SAP Lumira and Microsoft Excel. These solutions explore market segments, customer segments, marketing channels, and customer perspectives on products. The report identifies Nutricosmetics as a high-demand product and recommends targeting women under 40, particularly in Victoria and Queensland. It suggests social media and email marketing as primary channels and highlights the importance of product pricing and form (food or pill) based on consumer preferences. The analysis provides key insights into the market and provides actionable recommendations for a potential client looking to enter the Australian market.
BUS5PB - Principles of Business Analytics
Assignment 01: Self-service Analytics Solution
Name of the Student
Name of University
Author Note
Assignment 01: Self-service Analytics Solution
Name of the Student
Name of University
Author Note
Paraphrase This Document
Need a fresh take? Get an instant paraphrase of this document with our AI Paraphraser
Table of Contents
1.0 Introduction............................................................................................................................. 3
2.0 Critical evaluation of the survey.............................................................................................. 3
3.0 Analytical Solution................................................................................................................... 4
3.1 Analytics solution 1..............................................................................................................4
Market Segment.................................................................................................................... 4
Customer segment.................................................................................................................5
Marketing Channel.................................................................................................................5
Customer view about product...............................................................................................6
3.2 Analytics solution 2..............................................................................................................6
4.0 Recommendations...................................................................................................................9
Bibliography:................................................................................................................................11
1.0 Introduction
The residential Australian unvarying (correlative) healthcare industry is energetic and huge.
Statistical surveying demonstrates that the ubiquity of normal natural healthcare items is
expanding with a development rate of seven for each penny year on year. 75% of Australians,
including 92 for each percentage of female aged 20-24; take no less than one dietary
supplement and a fourth of the populace visit fundamental healthcare services experts every
year (Bagstad et al. 2013).
The Australian business keeps on developing to meet these necessities. As of now sensitive to
elective ways to deal with wellbeing, perceiving children of post war America (Australia's
biggest populace gathering) progressively request more noteworthy decision and receive a
deterrent medicinal services way to deal with keeping up more beneficial lives. In Australia, the
speediest development zones are personal care, Pharmaceuticals and Nutrition. In the previous
two decades, the pharmaceutical, individual care, and nutritious enterprises have merged to
address developing requests in the beauty, wellbeing and health advertise.
This merging has brought about the development of new industry fragments Nutraceuticals,
Cosmeceuticals and Nutricosmetics. While, the market in China, Japan or USA is properly
established for these new segments, the Australian market is still in the early stages of
development. Thus, understanding these industry segments, consumers, the potential markets
and opportunities are imperative. This particular report is therefore exploring effective
marketing strategies (market opportunities, targeted customers, channels for campaigns, etc.)
for a potential client intending to enter these new industry segments in Australia.
2.0 Critical evaluation of the survey
As mentioned in the given case study, an end user survey has been already conducted and the
data is available for analysis. This section of the study is exploring the appropriateness of this
survey (Hazen et al. 2014). Since, the aim was to identify market opportunities in this new filed;
it was obvious choice to collect information from those respondents, who have the interest in
these products. In other words, this survey must had to consider one such question, which can
classify respondents into two categories; one who know something about these products and
ready to purchase and one who have no such idea. It has seen that the survey started with the
question, “Are you a regular consumer of beauty, health & wellness products?” and the data was
collected from regular consumers of beauty, health & wellness products. Hence, it can be said that the
survey questionnaire designed for this survey set proper tone for this market. A survey is termed as an
effective one provided it supports the analyst to explore both demographic profile as well as awareness
about the subject of study. From this point of view too, it can be argued that this survey questionnaire
has considered a list of demographic variable started from state to income, age band and gender. These
variables are critical for identifying market opportunities, targeted customers and associate
strategies (Jaworska et al. 2015). Again, this survey questionnaire has also included questions
that are required to understand the new product launch strategies. Hence, it can be concluded
that the data collected using this survey questionnaire surely give insights about the Australian
beauty, healthcare and wellbeing market.
⊘ This is a preview!⊘
Do you want full access?
Subscribe today to unlock all pages.
Trusted by 1+ million students worldwide
The survey question overall seemed good to collect necessary information for Australian
beauty, healthcare and wellbeing market, however, questions related to promotional
strategies, whether giving offer and discount will influence the purchase decision or not are
necessary to portray the market properly. These questions are missing here.
3.0 Analytical Solution
In this section of the report, the analyst has presented two different set of analytical solutions
designed with the help of SAP Lumira and Microsoft Excel analytical tool. While deigning the
models, the analyst tried to display the possible market segments, target customers, marketing
channel necessary and easiness of spreading information about the product and finally product
form. The analytical model designed with the help of SAP Lumira visualize the data collected
through this survey questionnaire (Duan and Xiong, 2015). On the other hand, the pivot tables
designed with the help of excel demonstrates numerical figures.
3.1 Analytics solution 1
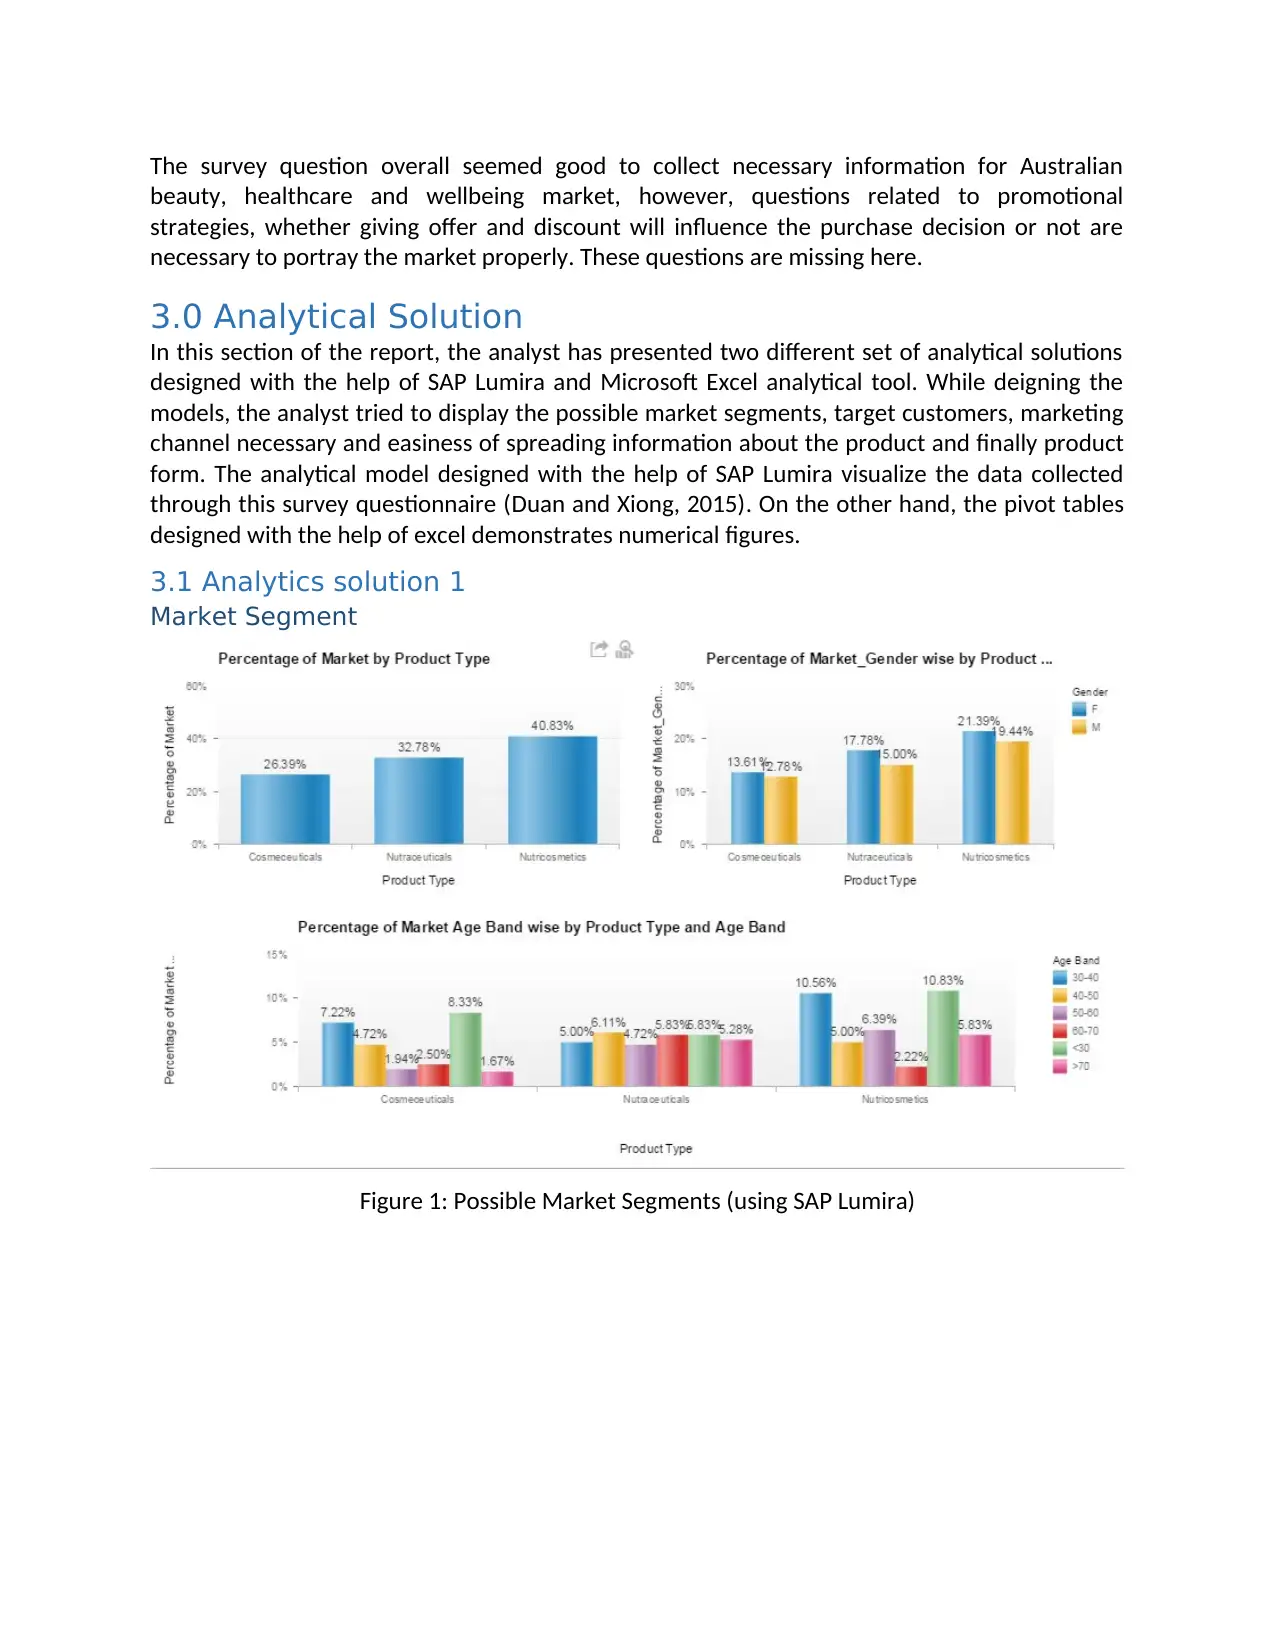
Market Segment
Figure 1: Possible Market Segments (using SAP Lumira)
beauty, healthcare and wellbeing market, however, questions related to promotional
strategies, whether giving offer and discount will influence the purchase decision or not are
necessary to portray the market properly. These questions are missing here.
3.0 Analytical Solution
In this section of the report, the analyst has presented two different set of analytical solutions
designed with the help of SAP Lumira and Microsoft Excel analytical tool. While deigning the
models, the analyst tried to display the possible market segments, target customers, marketing
channel necessary and easiness of spreading information about the product and finally product
form. The analytical model designed with the help of SAP Lumira visualize the data collected
through this survey questionnaire (Duan and Xiong, 2015). On the other hand, the pivot tables
designed with the help of excel demonstrates numerical figures.
3.1 Analytics solution 1
Market Segment
Figure 1: Possible Market Segments (using SAP Lumira)
Paraphrase This Document
Need a fresh take? Get an instant paraphrase of this document with our AI Paraphraser
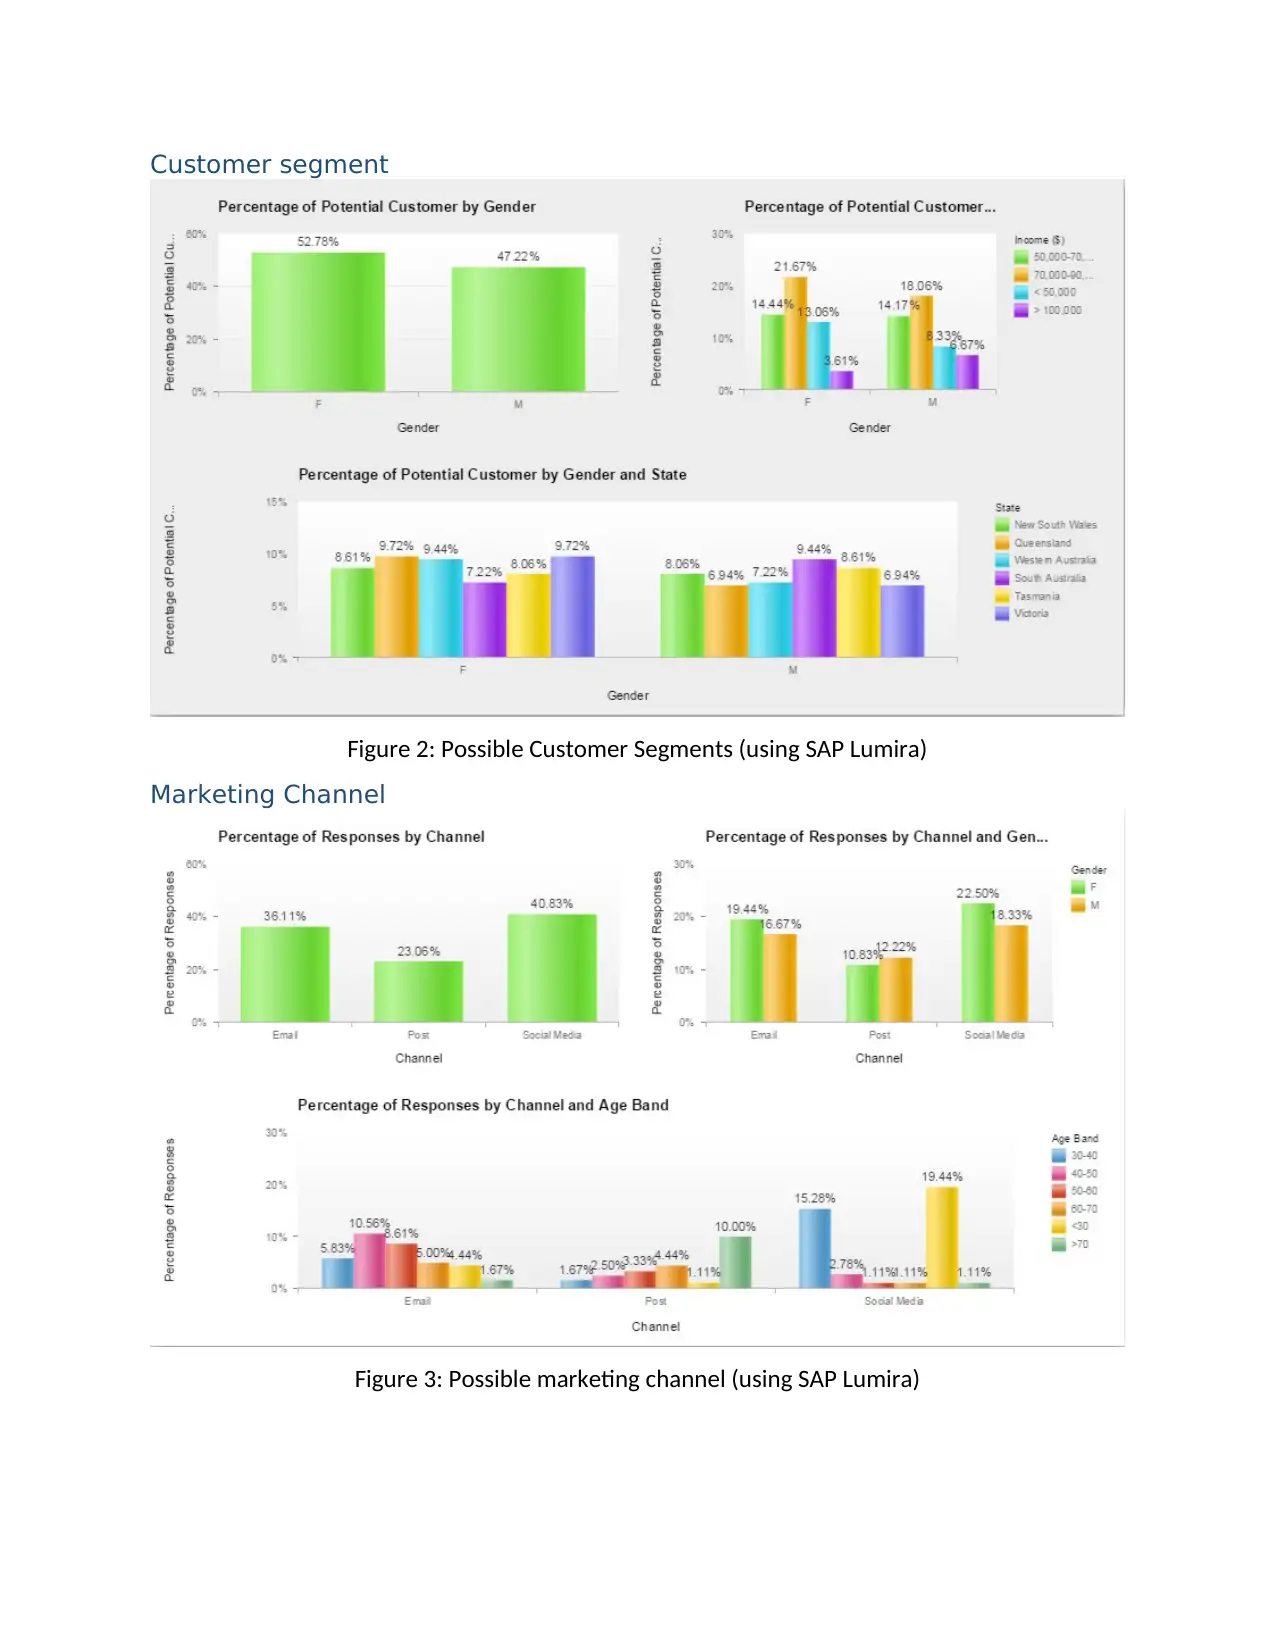
Customer segment
Figure 2: Possible Customer Segments (using SAP Lumira)
Marketing Channel
Figure 3: Possible marketing channel (using SAP Lumira)
Figure 2: Possible Customer Segments (using SAP Lumira)
Marketing Channel
Figure 3: Possible marketing channel (using SAP Lumira)
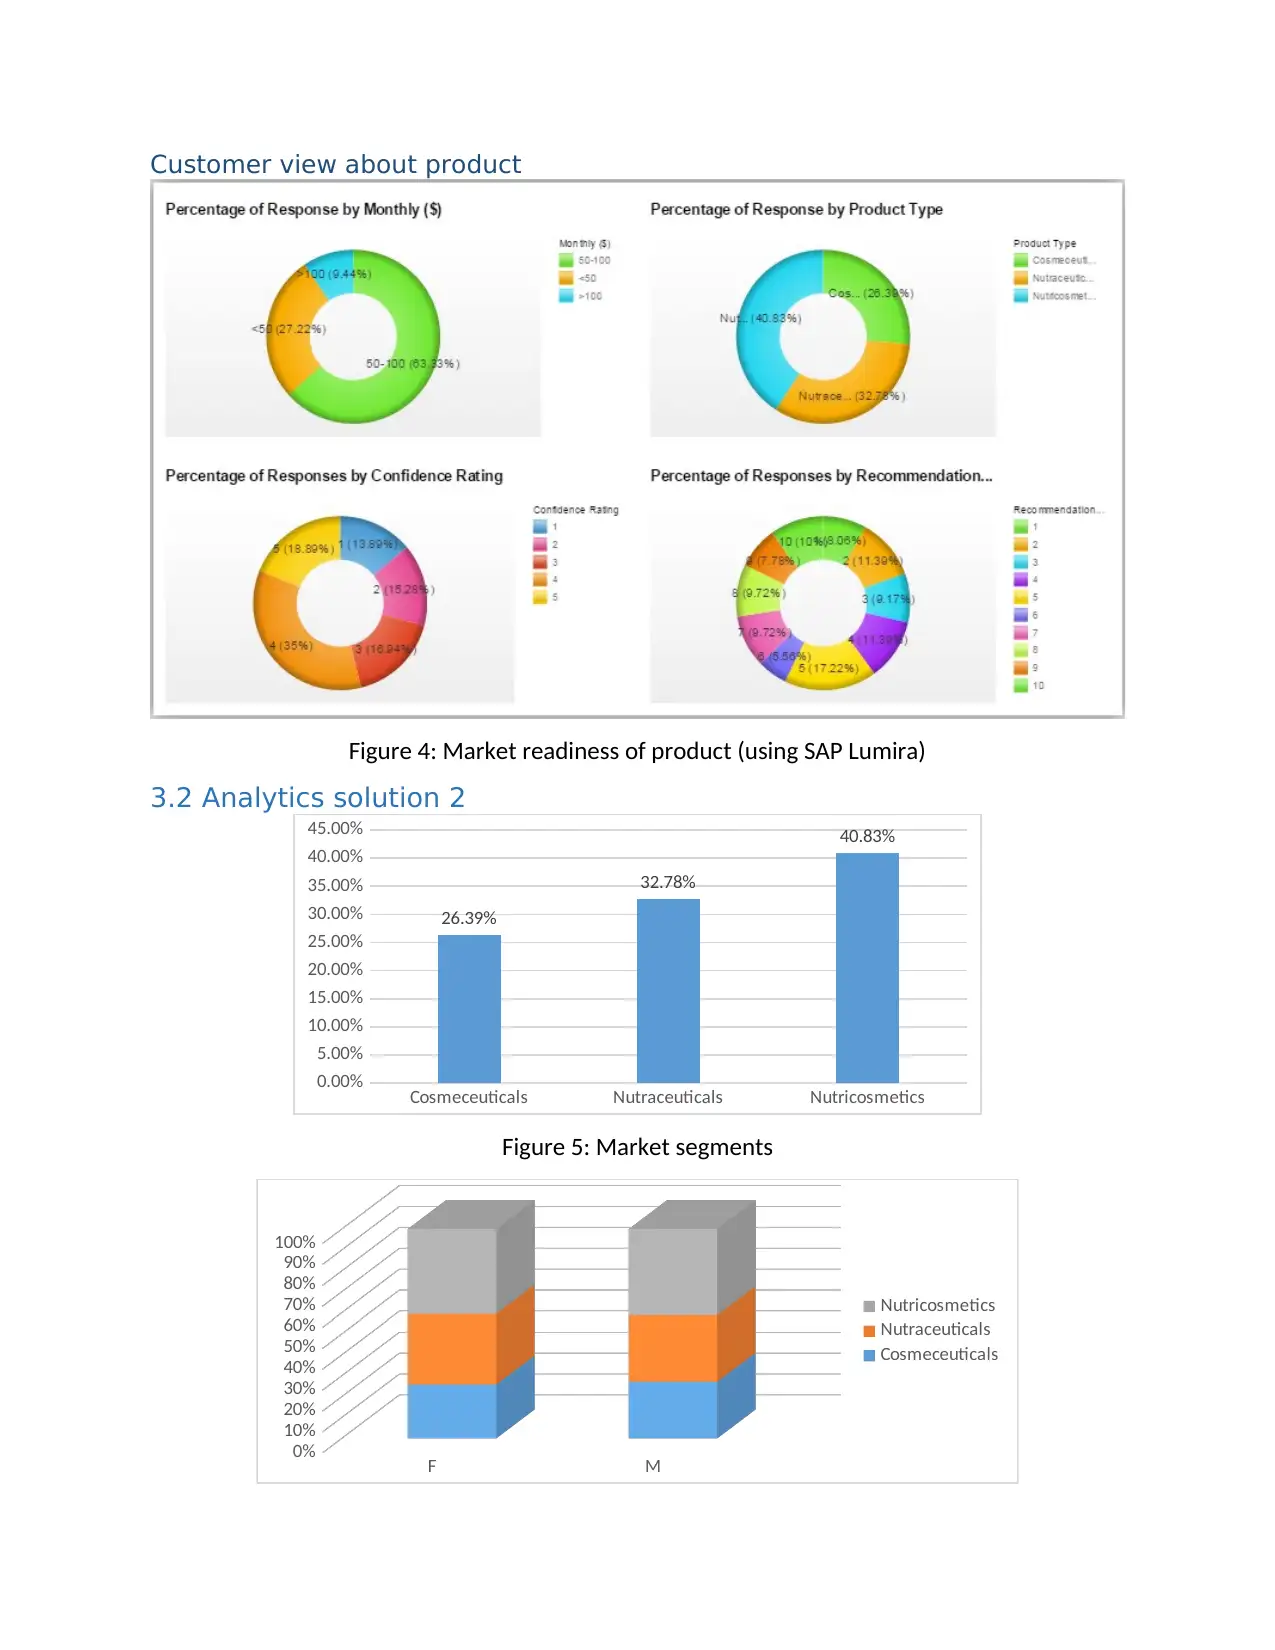
Customer view about product
Figure 4: Market readiness of product (using SAP Lumira)
3.2 Analytics solution 2
Cosmeceuticals Nutraceuticals Nutricosmetics
0.00%
5.00%
10.00%
15.00%
20.00%
25.00%
30.00%
35.00%
40.00%
45.00%
26.39%
32.78%
40.83%
Figure 5: Market segments
F M
0%
10%
20%
30%
40%
50%
60%
70%
80%
90%
100%
Nutricosmetics
Nutraceuticals
Cosmeceuticals
⊘ This is a preview!⊘
Do you want full access?
Subscribe today to unlock all pages.
Trusted by 1+ million students worldwide
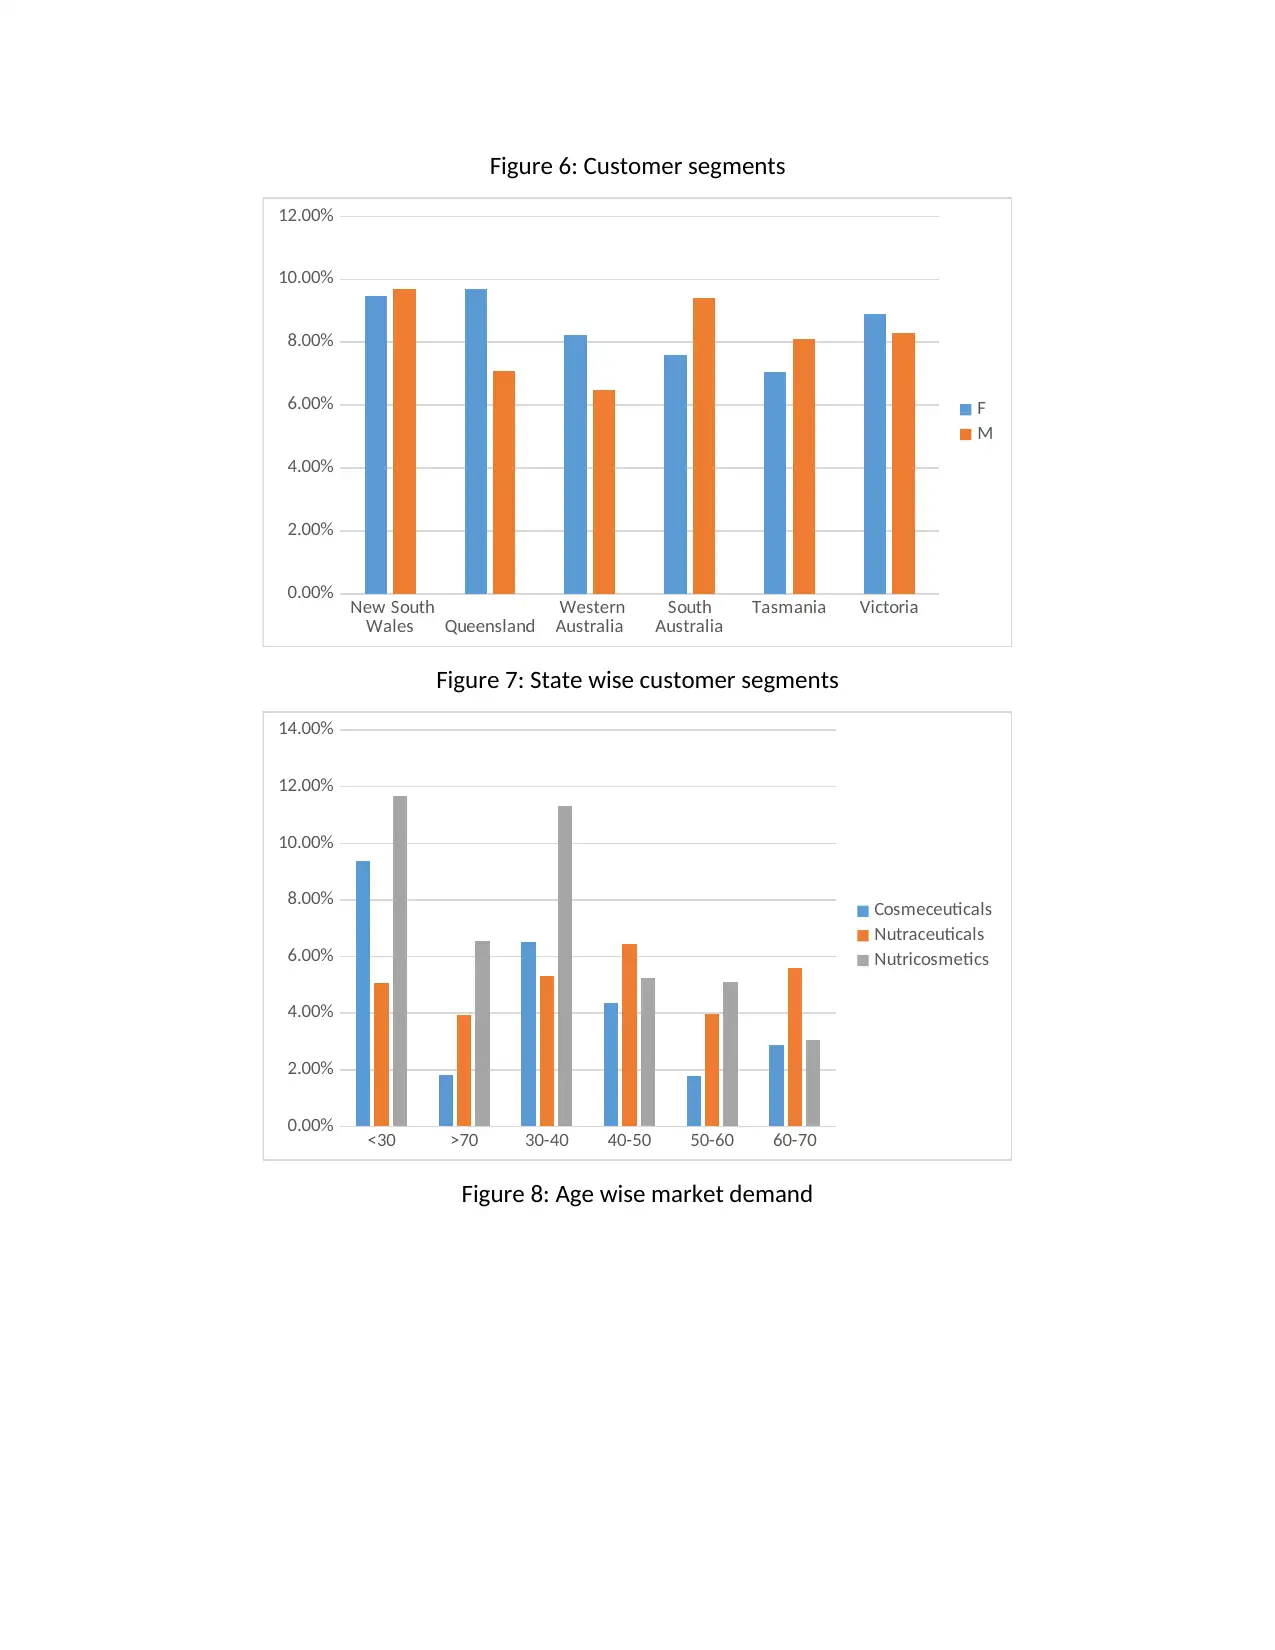
Figure 6: Customer segments
New South
Wales Queensland Western
Australia South
Australia Tasmania Victoria
0.00%
2.00%
4.00%
6.00%
8.00%
10.00%
12.00%
F
M
Figure 7: State wise customer segments
<30 >70 30-40 40-50 50-60 60-70
0.00%
2.00%
4.00%
6.00%
8.00%
10.00%
12.00%
14.00%
Cosmeceuticals
Nutraceuticals
Nutricosmetics
Figure 8: Age wise market demand
Paraphrase This Document
Need a fresh take? Get an instant paraphrase of this document with our AI Paraphraser
Cosmeceuticals Nutraceuticals Nutricosmetics
0.00%
5.00%
10.00%
15.00%
20.00%
25.00%
30.00%
<50
>100
50-100
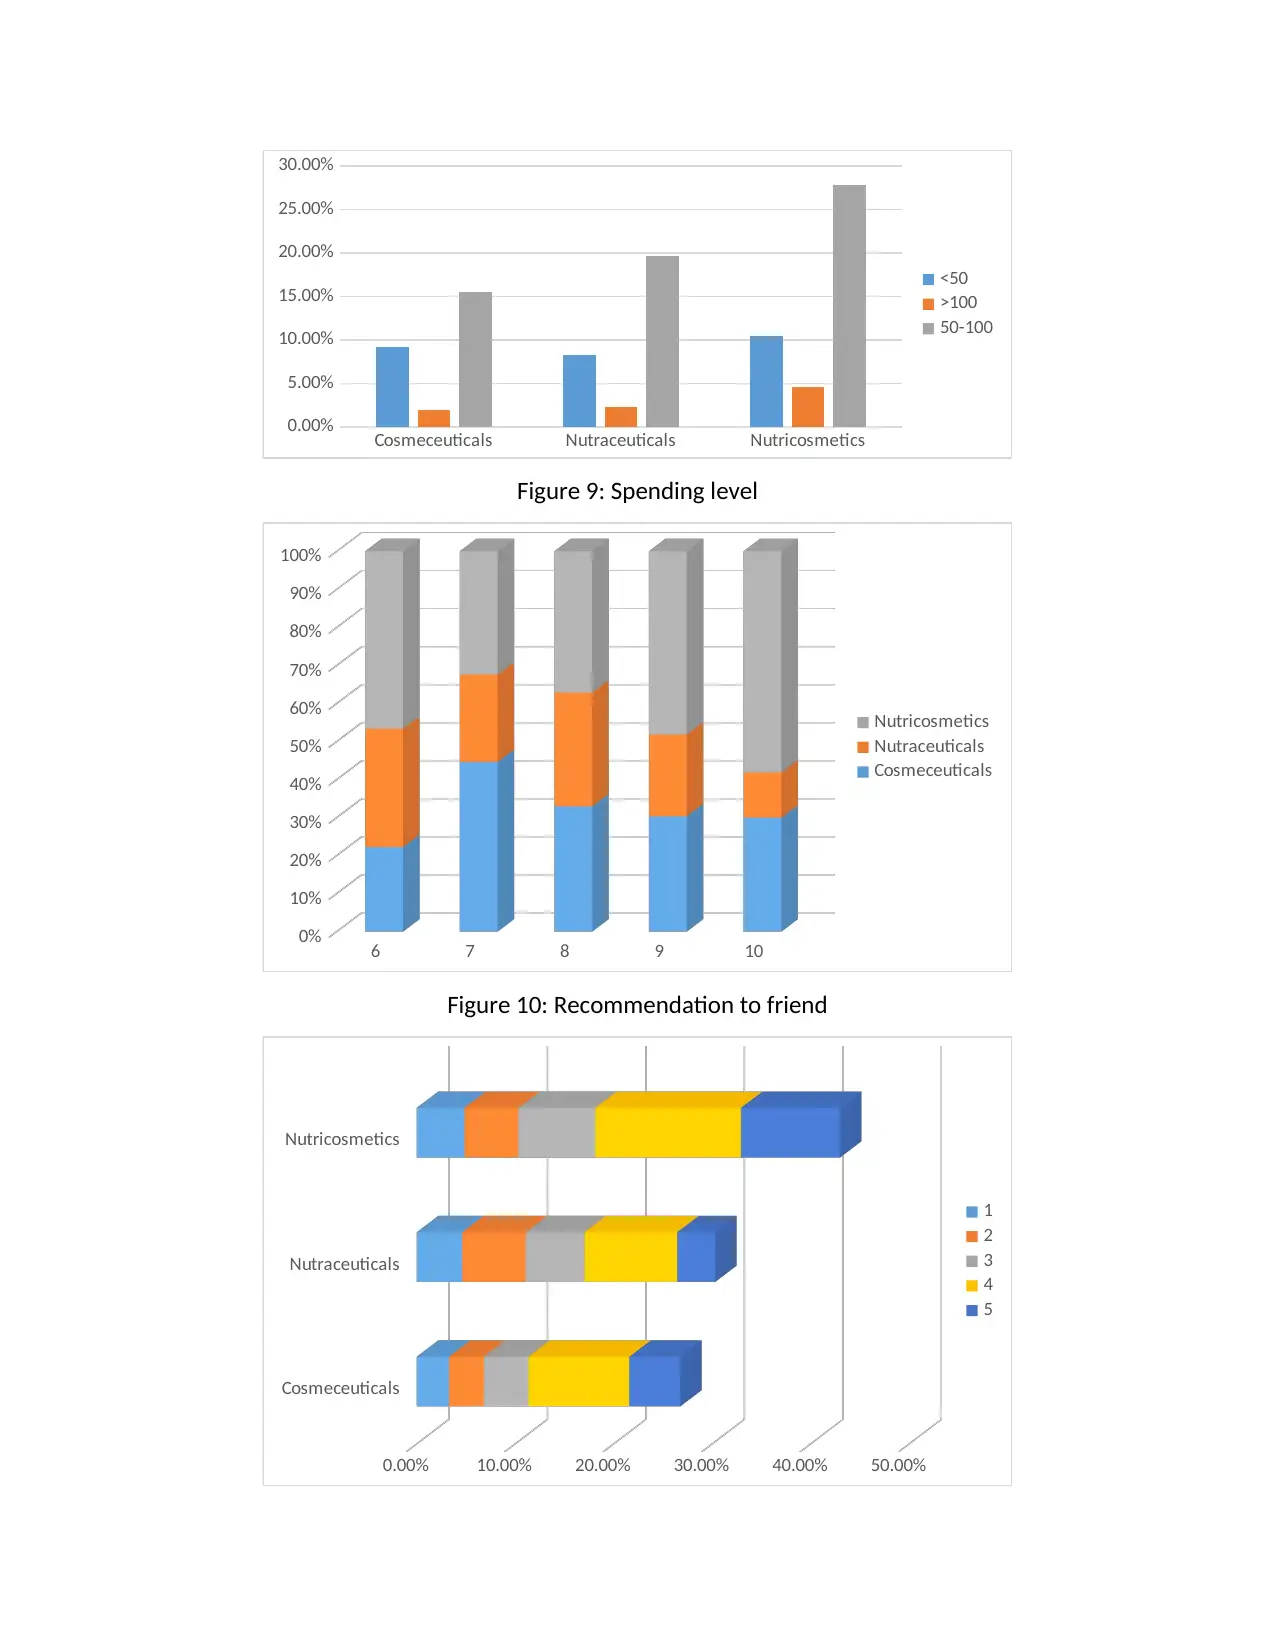
Figure 9: Spending level
6 7 8 9 10
0%
10%
20%
30%
40%
50%
60%
70%
80%
90%
100%
Nutricosmetics
Nutraceuticals
Cosmeceuticals
Figure 10: Recommendation to friend
Cosmeceuticals
Nutraceuticals
Nutricosmetics
0.00% 10.00% 20.00% 30.00% 40.00% 50.00%
1
2
3
4
5
0.00%
5.00%
10.00%
15.00%
20.00%
25.00%
30.00%
<50
>100
50-100
Figure 9: Spending level
6 7 8 9 10
0%
10%
20%
30%
40%
50%
60%
70%
80%
90%
100%
Nutricosmetics
Nutraceuticals
Cosmeceuticals
Figure 10: Recommendation to friend
Cosmeceuticals
Nutraceuticals
Nutricosmetics
0.00% 10.00% 20.00% 30.00% 40.00% 50.00%
1
2
3
4
5
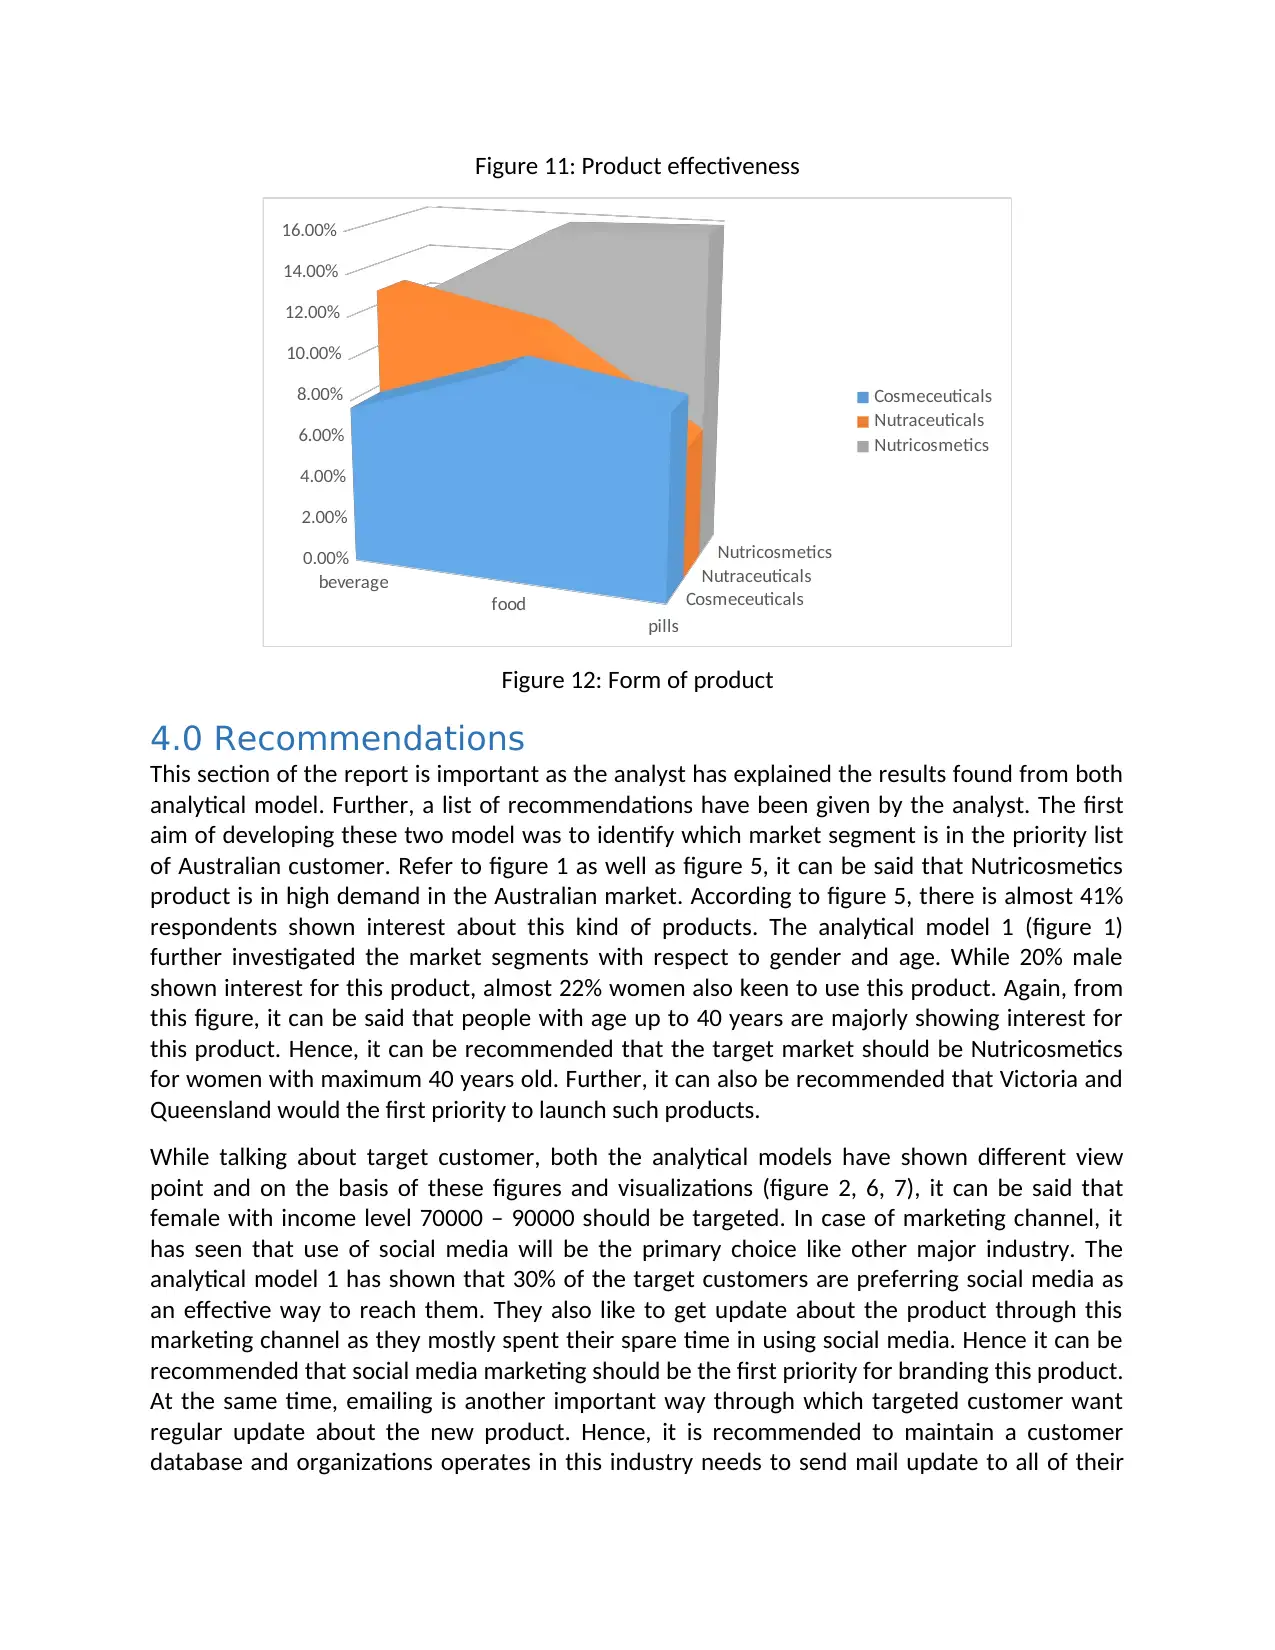
Figure 11: Product effectiveness
beverage
food
pills
0.00%
2.00%
4.00%
6.00%
8.00%
10.00%
12.00%
14.00%
16.00%
Cosmeceuticals
Nutraceuticals
Nutricosmetics
Cosmeceuticals
Nutraceuticals
Nutricosmetics
Figure 12: Form of product
4.0 Recommendations
This section of the report is important as the analyst has explained the results found from both
analytical model. Further, a list of recommendations have been given by the analyst. The first
aim of developing these two model was to identify which market segment is in the priority list
of Australian customer. Refer to figure 1 as well as figure 5, it can be said that Nutricosmetics
product is in high demand in the Australian market. According to figure 5, there is almost 41%
respondents shown interest about this kind of products. The analytical model 1 (figure 1)
further investigated the market segments with respect to gender and age. While 20% male
shown interest for this product, almost 22% women also keen to use this product. Again, from
this figure, it can be said that people with age up to 40 years are majorly showing interest for
this product. Hence, it can be recommended that the target market should be Nutricosmetics
for women with maximum 40 years old. Further, it can also be recommended that Victoria and
Queensland would the first priority to launch such products.
While talking about target customer, both the analytical models have shown different view
point and on the basis of these figures and visualizations (figure 2, 6, 7), it can be said that
female with income level 70000 – 90000 should be targeted. In case of marketing channel, it
has seen that use of social media will be the primary choice like other major industry. The
analytical model 1 has shown that 30% of the target customers are preferring social media as
an effective way to reach them. They also like to get update about the product through this
marketing channel as they mostly spent their spare time in using social media. Hence it can be
recommended that social media marketing should be the first priority for branding this product.
At the same time, emailing is another important way through which targeted customer want
regular update about the new product. Hence, it is recommended to maintain a customer
database and organizations operates in this industry needs to send mail update to all of their
⊘ This is a preview!⊘
Do you want full access?
Subscribe today to unlock all pages.
Trusted by 1+ million students worldwide
existing customers. The table 6 deigned in model 2 has shown that 43.85% of respondents
mentioned that they will refer to their friend about this product. Hence, emailing would be next
important way of doing branding.
From the analytical model 1, it has seen that they will ready to spend 50-100 dollar in a month
for this kind of product. Hence, it is necessary to adjust pricing of these product according to
their expectation. Finally, it is seen that all most 16% of the respondents have mentioned either
as food or pill form would be the best for such product. So, it is recommended to consider
these two form while introducing new products in the market.
Paraphrase This Document
Need a fresh take? Get an instant paraphrase of this document with our AI Paraphraser
Bibliography:
Bagstad, K.J., Semmens, D.J., Waage, S. and Winthrop, R., 2013. A comparative assessment of
decision-support tools for ecosystem services quantification and valuation. Ecosystem
Services, 5, pp.27-39.
Banerjee, A., Bandyopadhyay, T. and Acharya, P., 2013. Data analytics: Hyped up aspirations or
true potential?. Vikalpa, 38(4), pp.1-12.
Choi, T.M., Chan, H.K. and Yue, X., 2017. Recent development in big data analytics for business
operations and risk management. IEEE transactions on cybernetics, 47(1), pp.81-92.
Duan, L. and Xiong, Y., 2015. Big data analytics and business analytics. Journal of Management
Analytics, 2(1), pp.1-21.
Fan, S., Lau, R.Y. and Zhao, J.L., 2015. Demystifying big data analytics for business intelligence
through the lens of marketing mix. Big Data Research, 2(1), pp.28-32.
Ghazal, A., Rabl, T., Hu, M., Raab, F., Poess, M., Crolotte, A. and Jacobsen, H.A., 2013, June.
BigBench: towards an industry standard benchmark for big data analytics. In Proceedings of the
2013 ACM SIGMOD international conference on Management of data (pp. 1197-1208). ACM.
Hazen, B.T., Boone, C.A., Ezell, J.D. and Jones-Farmer, L.A., 2014. Data quality for data science,
predictive analytics, and big data in supply chain management: An introduction to the problem
and suggestions for research and applications. International Journal of Production
Economics, 154, pp.72-80.
Janssen, S., Porter, C.H., Moore, A.D., Athanasiadis, I.N., Foster, I., Jones, J.W. and Antle, J.M.,
2015. Towards a New Generation of Agricultural System Models, Data, and Knowledge
Products: Building an Open Web-Based Approach to Agricultural Data, System Modeling and
Decision Support. AgMIP. Towards a New Generation of Agricultural System Models, Data, and
Knowledge Products, p.91.
Jaworska, J.S., Natsch, A., Ryan, C., Strickland, J., Ashikaga, T. and Miyazawa, M., 2015. Bayesian
integrated testing strategy (ITS) for skin sensitization potency assessment: a decision support
system for quantitative weight of evidence and adaptive testing strategy. Archives of
toxicology, 89(12), pp.2355-2383.
Klinkenberg, R. ed., 2013. RapidMiner: Data mining use cases and business analytics
applications. Chapman and Hall/CRC.
Kohavi, R., Rothleder, N.J. and Simoudis, E., 2002. Emerging trends in business
analytics. Communications of the ACM, 45(8), pp.45-48.
Kwon, O., Lee, N. and Shin, B., 2014. Data quality management, data usage experience and
acquisition intention of big data analytics. International Journal of Information
Management, 34(3), pp.387-394.
Loebbecke, C. and Picot, A., 2015. Reflections on societal and business model transformation
arising from digitization and big data analytics: A research agenda. The Journal of Strategic
Information Systems, 24(3), pp.149-157.
Raghupathi, W. and Raghupathi, V., 2014. Big data analytics in healthcare: promise and
potential. Health Information Science and Systems, 2(1), p.3.
Salam, M.A. and Khan, S.A., 2016. Simulation based decision support system for optimization: a
case of thai logistics service provider. Industrial Management & Data Systems, 116(2), pp.236-
254.
Sauter, V.L., 2014. Decision support systems for business intelligence. John Wiley & Sons.
Serrano-Cinca, C. and Gutiérrez-Nieto, B., 2013. A decision support system for financial and
social investment. Applied Economics, 45(28), pp.4060-4070.
Sharda, R., Delen, D. and Turban, E., 2013. Business Intelligence: A managerial perspective on
analytics. Prentice Hall Press.
Shmueli, G., Patel, N.R. and Bruce, P.C., 2016. Data Mining for Business Analytics: Concepts,
Techniques, and Applications with XLMiner. John Wiley & Sons.
Vera-Baquero, A., Colomo-Palacios, R. and Molloy, O., 2013. Business process analytics using a
big data approach. IT Professional, 15(6), pp.29-35.
⊘ This is a preview!⊘
Do you want full access?
Subscribe today to unlock all pages.
Trusted by 1+ million students worldwide
1 out of 13
Related Documents


Your All-in-One AI-Powered Toolkit for Academic Success.
+13062052269
info@desklib.com
Available 24*7 on WhatsApp / Email
![[object Object]](/_next/static/media/star-bottom.7253800d.svg)
Unlock your academic potential
Copyright © 2020–2026 A2Z Services. All Rights Reserved. Developed and managed by ZUCOL.