ECON11026 Term 1 2019 Assessment 2: Short Answer Questions Analysis

Verified

Added on  2023/01/10

|8
|1364
|93
Homework Assignment
AI Summary
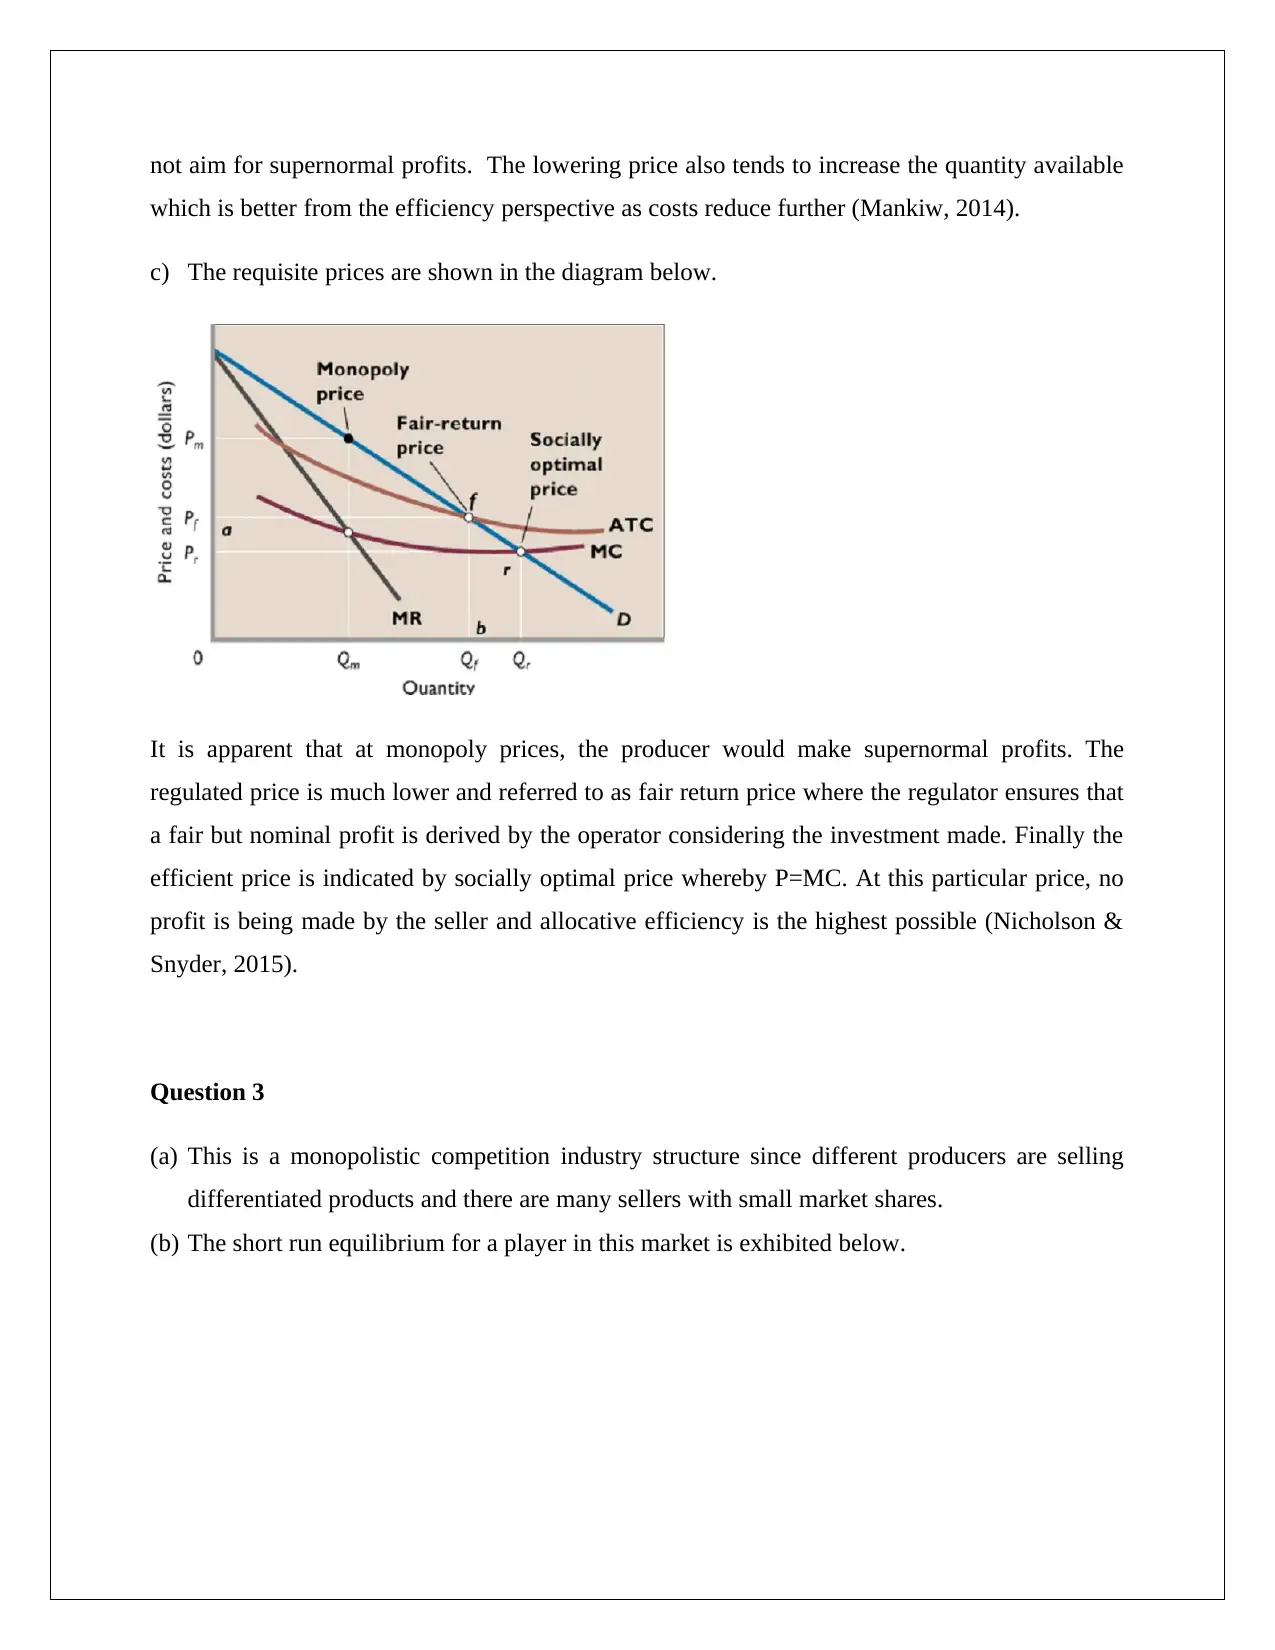
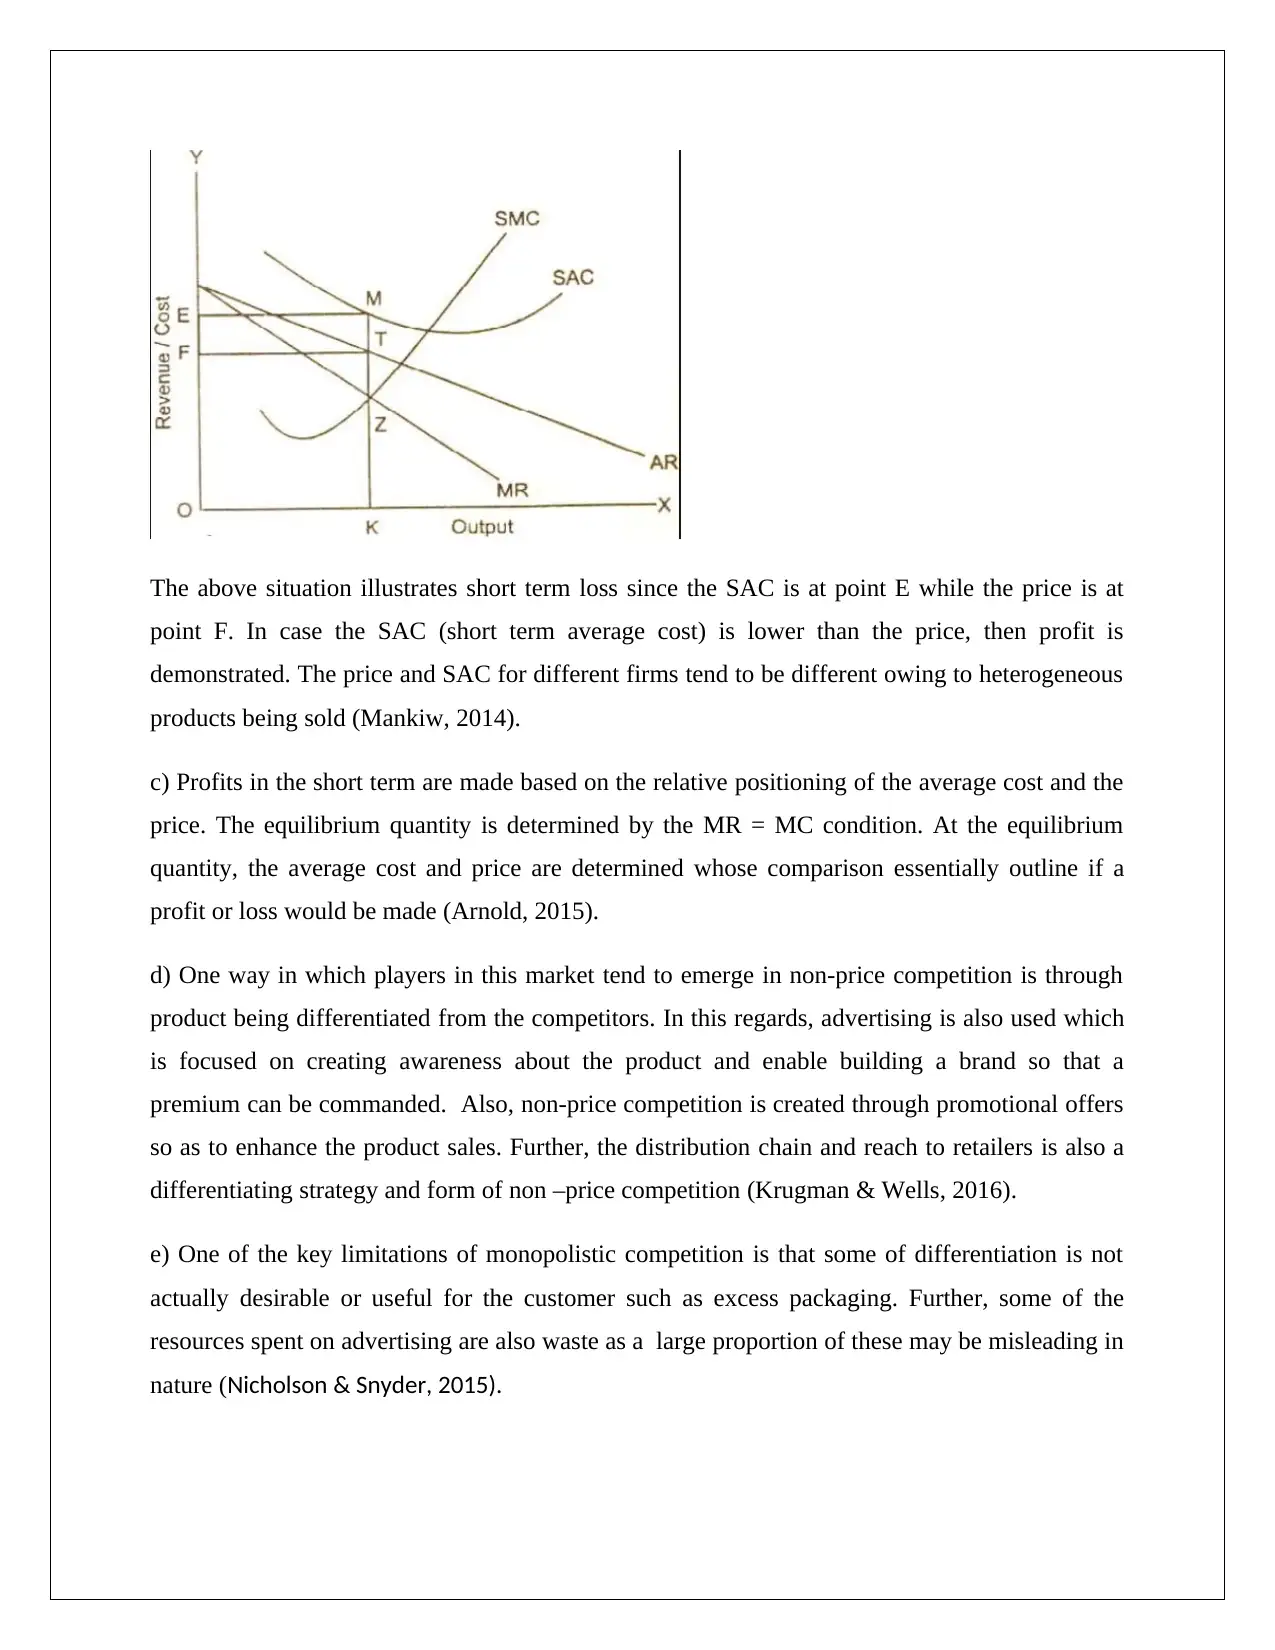
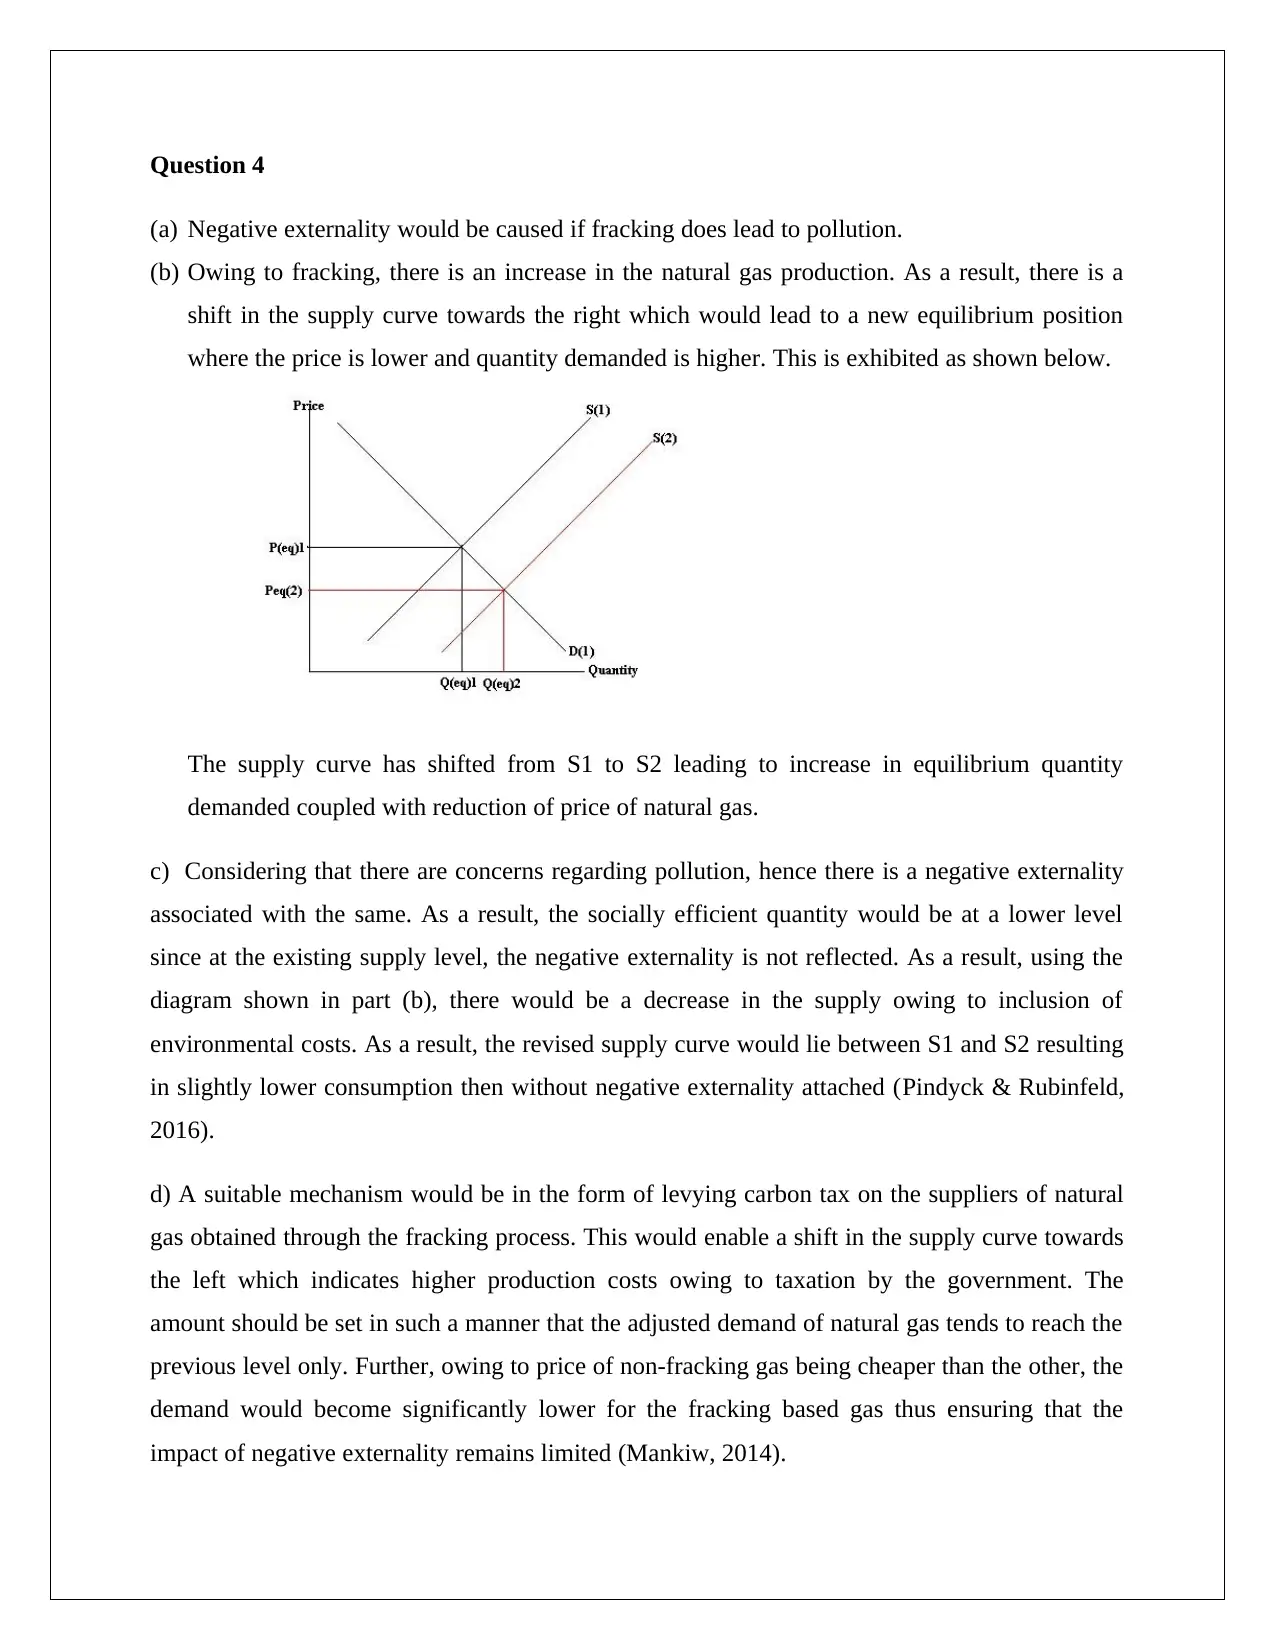
This economics assignment analyzes market structures, including perfect competition, monopoly, and monopolistic competition, along with the concept of externalities. The solution begins with a perfect competition scenario, calculating profit maximization for a T-shirt seller based on marginal cost and revenue, and illustrating the results graphically. It then delves into natural monopolies, discussing pricing, regulation, and efficiency, and providing diagrams. The assignment further explores monopolistic competition, examining short-run equilibrium, profit/loss scenarios, and non-price competition strategies like advertising and product differentiation. Finally, the solution addresses negative externalities, specifically in the context of fracking, analyzing the impact on supply, demand, and equilibrium prices, and proposing a carbon tax as a policy mechanism to mitigate environmental damage. References to economic literature are included to support the analysis.
Document Page
ECONOMICS
STUDENT ID:
[Pick the date]
tabler-icon-diamond-filled.svg

Paraphrase This Document

Need a fresh take? Get an instant paraphrase of this document with our AI Paraphraser
Document Page
Question 1
a) In order to maximize profits, marginal cost should be equal to marginal revenue. The relevant
computations based on the data provided are summarized below.
It is evident from above that MR=MC =$ 6 when the output is 8 T shirts a day. The price
charges is $ 6 per T shirt so the total price charged = 8*6 = $ 48.
Total cost = $34.50
Hence, profit = $48-$ 34.50 = $ 13.50
b) The requisite graph is shown below.
Document Page
c) If the equilibrium price will decrease to $ 2.5 per unit, then MR = $2.5.The quantity for
which MC =$2.5 is 5 T-shirts per day.
Total revenue = 2.5*5 = $ 12.5
Total cost for 5 shirts = $ 21
Hence, loss realized = $ 21 - $ 12.5 = $ 8.5
d) The requisite graph is as shown below.
e) Sam should not shutdown the T Shirt business at an equilibrium price of $ 2.5 since the AVC
at this level is $ 2.2. Since Sam is able to cover the variable cost associated with the T shirts
production, hence in the short run, the firm should continue operations. However, if a similar
situation is witnessed in the long run, then the firm should shut down (Arnold, 2015).
Question 2
a) The relevant diagram for a natural monopoly is shown below.
Document Page
In a natural monopoly, the initial fixed costs are very high owing to which the viability in terms
of demand and underlying price only tends to happen when the underlying seller caters to the
whole market. This is evident from the above graph where cost and demand tend to intersect at $
5 only when quantity is 50. For lower quantity, the price tends to very high owing to upfront
fixed costs. With regards to water utility also, a significant amount of investment is made in
distribution network and it would be possible for economical supply of water services only when
there is one player in the market since affordability is pivotal (Krugman & Wells, 2016).
b) In a monopoly market, there is a tendency to under-produce so as to ensure that a higher
price can be charged to the consumers so that profits are maximized. This is shown below.
In order to prevent the tendency of the monopoly to overcharge the customers, there is need for
regulation to intervene so that affordability is not hampered and also the underlying seller should
tabler-icon-diamond-filled.svg

Paraphrase This Document

Need a fresh take? Get an instant paraphrase of this document with our AI Paraphraser
Document Page
not aim for supernormal profits. The lowering price also tends to increase the quantity available
which is better from the efficiency perspective as costs reduce further (Mankiw, 2014).
c) The requisite prices are shown in the diagram below.
It is apparent that at monopoly prices, the producer would make supernormal profits. The
regulated price is much lower and referred to as fair return price where the regulator ensures that
a fair but nominal profit is derived by the operator considering the investment made. Finally the
efficient price is indicated by socially optimal price whereby P=MC. At this particular price, no
profit is being made by the seller and allocative efficiency is the highest possible (Nicholson &
Snyder, 2015).
Question 3
(a) This is a monopolistic competition industry structure since different producers are selling
differentiated products and there are many sellers with small market shares.
(b) The short run equilibrium for a player in this market is exhibited below.
Document Page
The above situation illustrates short term loss since the SAC is at point E while the price is at
point F. In case the SAC (short term average cost) is lower than the price, then profit is
demonstrated. The price and SAC for different firms tend to be different owing to heterogeneous
products being sold (Mankiw, 2014).
c) Profits in the short term are made based on the relative positioning of the average cost and the
price. The equilibrium quantity is determined by the MR = MC condition. At the equilibrium
quantity, the average cost and price are determined whose comparison essentially outline if a
profit or loss would be made (Arnold, 2015).
d) One way in which players in this market tend to emerge in non-price competition is through
product being differentiated from the competitors. In this regards, advertising is also used which
is focused on creating awareness about the product and enable building a brand so that a
premium can be commanded. Also, non-price competition is created through promotional offers
so as to enhance the product sales. Further, the distribution chain and reach to retailers is also a
differentiating strategy and form of non –price competition (Krugman & Wells, 2016).
e) One of the key limitations of monopolistic competition is that some of differentiation is not
actually desirable or useful for the customer such as excess packaging. Further, some of the
resources spent on advertising are also waste as a large proportion of these may be misleading in
nature (Nicholson & Snyder, 2015).
Document Page
Question 4
(a) Negative externality would be caused if fracking does lead to pollution.
(b) Owing to fracking, there is an increase in the natural gas production. As a result, there is a
shift in the supply curve towards the right which would lead to a new equilibrium position
where the price is lower and quantity demanded is higher. This is exhibited as shown below.
The supply curve has shifted from S1 to S2 leading to increase in equilibrium quantity
demanded coupled with reduction of price of natural gas.
c) Considering that there are concerns regarding pollution, hence there is a negative externality
associated with the same. As a result, the socially efficient quantity would be at a lower level
since at the existing supply level, the negative externality is not reflected. As a result, using the
diagram shown in part (b), there would be a decrease in the supply owing to inclusion of
environmental costs. As a result, the revised supply curve would lie between S1 and S2 resulting
in slightly lower consumption then without negative externality attached (Pindyck & Rubinfeld,
2016).
d) A suitable mechanism would be in the form of levying carbon tax on the suppliers of natural
gas obtained through the fracking process. This would enable a shift in the supply curve towards
the left which indicates higher production costs owing to taxation by the government. The
amount should be set in such a manner that the adjusted demand of natural gas tends to reach the
previous level only. Further, owing to price of non-fracking gas being cheaper than the other, the
demand would become significantly lower for the fracking based gas thus ensuring that the
impact of negative externality remains limited (Mankiw, 2014).
tabler-icon-diamond-filled.svg

Paraphrase This Document

Need a fresh take? Get an instant paraphrase of this document with our AI Paraphraser
Document Page
References
Arnold, A.R. (2015). Microeconomics (9thed.). Sydney: Cengage Learning.
Krugman, P. & Wells, R. (2016).Microeconomics (2nded.). London: Worth Publishers.
Mankiw, G. (2014) Microeconomics (6thed.). London: Worth Publishers.
Nicholson, W. & Snyder, C. (2015).Fundamentals of Microeconomics (11thed.). New York:
Cengage Learning.
Pindyck, R. & Rubinfeld, D. (2014).Microeconomics (5th ed.). London: Prentice-Hall
Publications.
chevron_up_icon
1 out of 8
circle_padding
hide_on_mobile
zoom_out_icon
[object Object]