Report on Macroeconomic Principles: Economics Course Analysis
VerifiedAdded on 2020/02/19
|14
|3121
|27
Report
AI Summary
This report delves into various macroeconomic concepts, commencing with an examination of monopolistic and oligopolistic market structures, including product differentiation strategies and the application of the kinked demand curve hypothesis. It then explores market failures, specifically focusing on external costs associated with production and consumption, using examples such as coal-fired power stations and alcohol consumption. The report further analyzes the circular flow of income, examining how different economic activities impact key components of GDP, such as investment, government spending, and international trade. Finally, it addresses inflationary and deflationary gaps, outlining their causes, effects, and potential policy responses, providing a comprehensive overview of essential macroeconomic principles.
Principles of Economics 1
Principles of Economics
Principles of Economics
Paraphrase This Document
Need a fresh take? Get an instant paraphrase of this document with our AI Paraphraser
Principles of Economics 2
Introduction
This report emphasizes on different concepts of macro economics such as monopolistic and
oligopolistic competition, and external costs and externalities. Along with this, it also covers the
aspects related to circular flow of income and determinants of GDP.
Question 1
a) Define and explain with an example why firms resort to product differentiation under
monopolistic and oligopolistic market structures.
Solution:
Product differentiation refers to offering of the products by the firm different from the products
offered by its rivals in the market in terms of design, quality, related services, and location in
order to meet the customized needs of the customers. The offering of the differentiated product
in the monopolistic and oligopolistic competition help companies to charge high price for the
product which the customers are ready to pay for the product. The main reason behind it is that
they get new attributes in the product which results in meeting their demands in an effective
manner (Bond & Hughes, 2013).
The example of product differentiation in monopolistic competition is offering of different
features by different automobile companies in order to capture large market share by fulfilling
the untapped needs of the customers by differentiating their product in terms of quality, location
and type of product. The example of product differentiation in oligopolistic competition is the
soft drink industry in US where different soft drink companies offer soft drinks of different taste
in order to gain high market share (Whitehead, 2014).
b) i) What would the demand curve be under the kinked demand curve hypothesis?
Explain.
Principles of Economics 3
Solution:
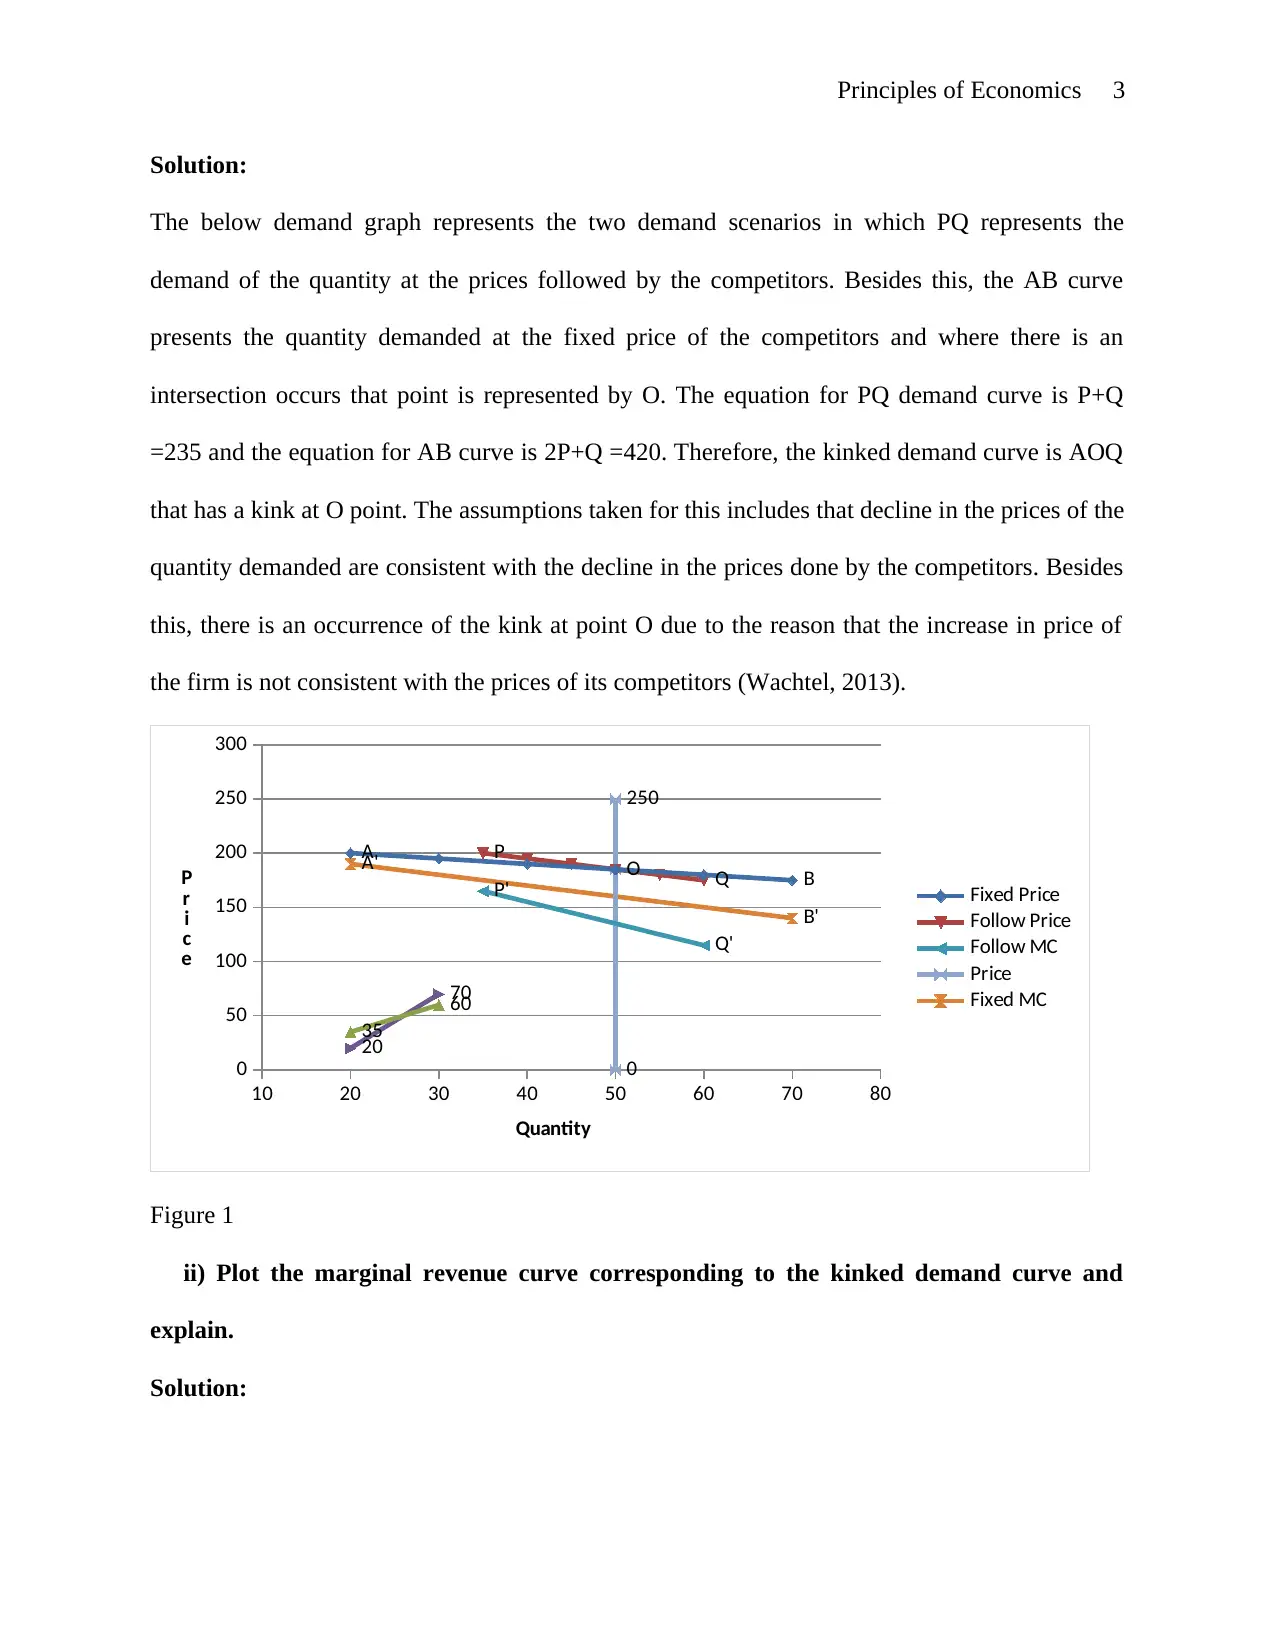
The below demand graph represents the two demand scenarios in which PQ represents the
demand of the quantity at the prices followed by the competitors. Besides this, the AB curve
presents the quantity demanded at the fixed price of the competitors and where there is an
intersection occurs that point is represented by O. The equation for PQ demand curve is P+Q
=235 and the equation for AB curve is 2P+Q =420. Therefore, the kinked demand curve is AOQ
that has a kink at O point. The assumptions taken for this includes that decline in the prices of the
quantity demanded are consistent with the decline in the prices done by the competitors. Besides
this, there is an occurrence of the kink at point O due to the reason that the increase in price of
the firm is not consistent with the prices of its competitors (Wachtel, 2013).
10 20 30 40 50 60 70 80
0
50
100
150
200
250
300
A'
B'
0
250
P'
Q'
20
70
35
60
P O Q
A
B Fixed Price
Follow Price
Follow MC
Price
Fixed MC
Quantity
P
r
i
c
e
Figure 1
ii) Plot the marginal revenue curve corresponding to the kinked demand curve and
explain.
Solution:
Solution:
The below demand graph represents the two demand scenarios in which PQ represents the
demand of the quantity at the prices followed by the competitors. Besides this, the AB curve
presents the quantity demanded at the fixed price of the competitors and where there is an
intersection occurs that point is represented by O. The equation for PQ demand curve is P+Q
=235 and the equation for AB curve is 2P+Q =420. Therefore, the kinked demand curve is AOQ
that has a kink at O point. The assumptions taken for this includes that decline in the prices of the
quantity demanded are consistent with the decline in the prices done by the competitors. Besides
this, there is an occurrence of the kink at point O due to the reason that the increase in price of
the firm is not consistent with the prices of its competitors (Wachtel, 2013).
10 20 30 40 50 60 70 80
0
50
100
150
200
250
300
A'
B'
0
250
P'
Q'
20
70
35
60
P O Q
A
B Fixed Price
Follow Price
Follow MC
Price
Fixed MC
Quantity
P
r
i
c
e
Figure 1
ii) Plot the marginal revenue curve corresponding to the kinked demand curve and
explain.
Solution:
⊘ This is a preview!⊘
Do you want full access?
Subscribe today to unlock all pages.
Trusted by 1+ million students worldwide
Principles of Economics 4
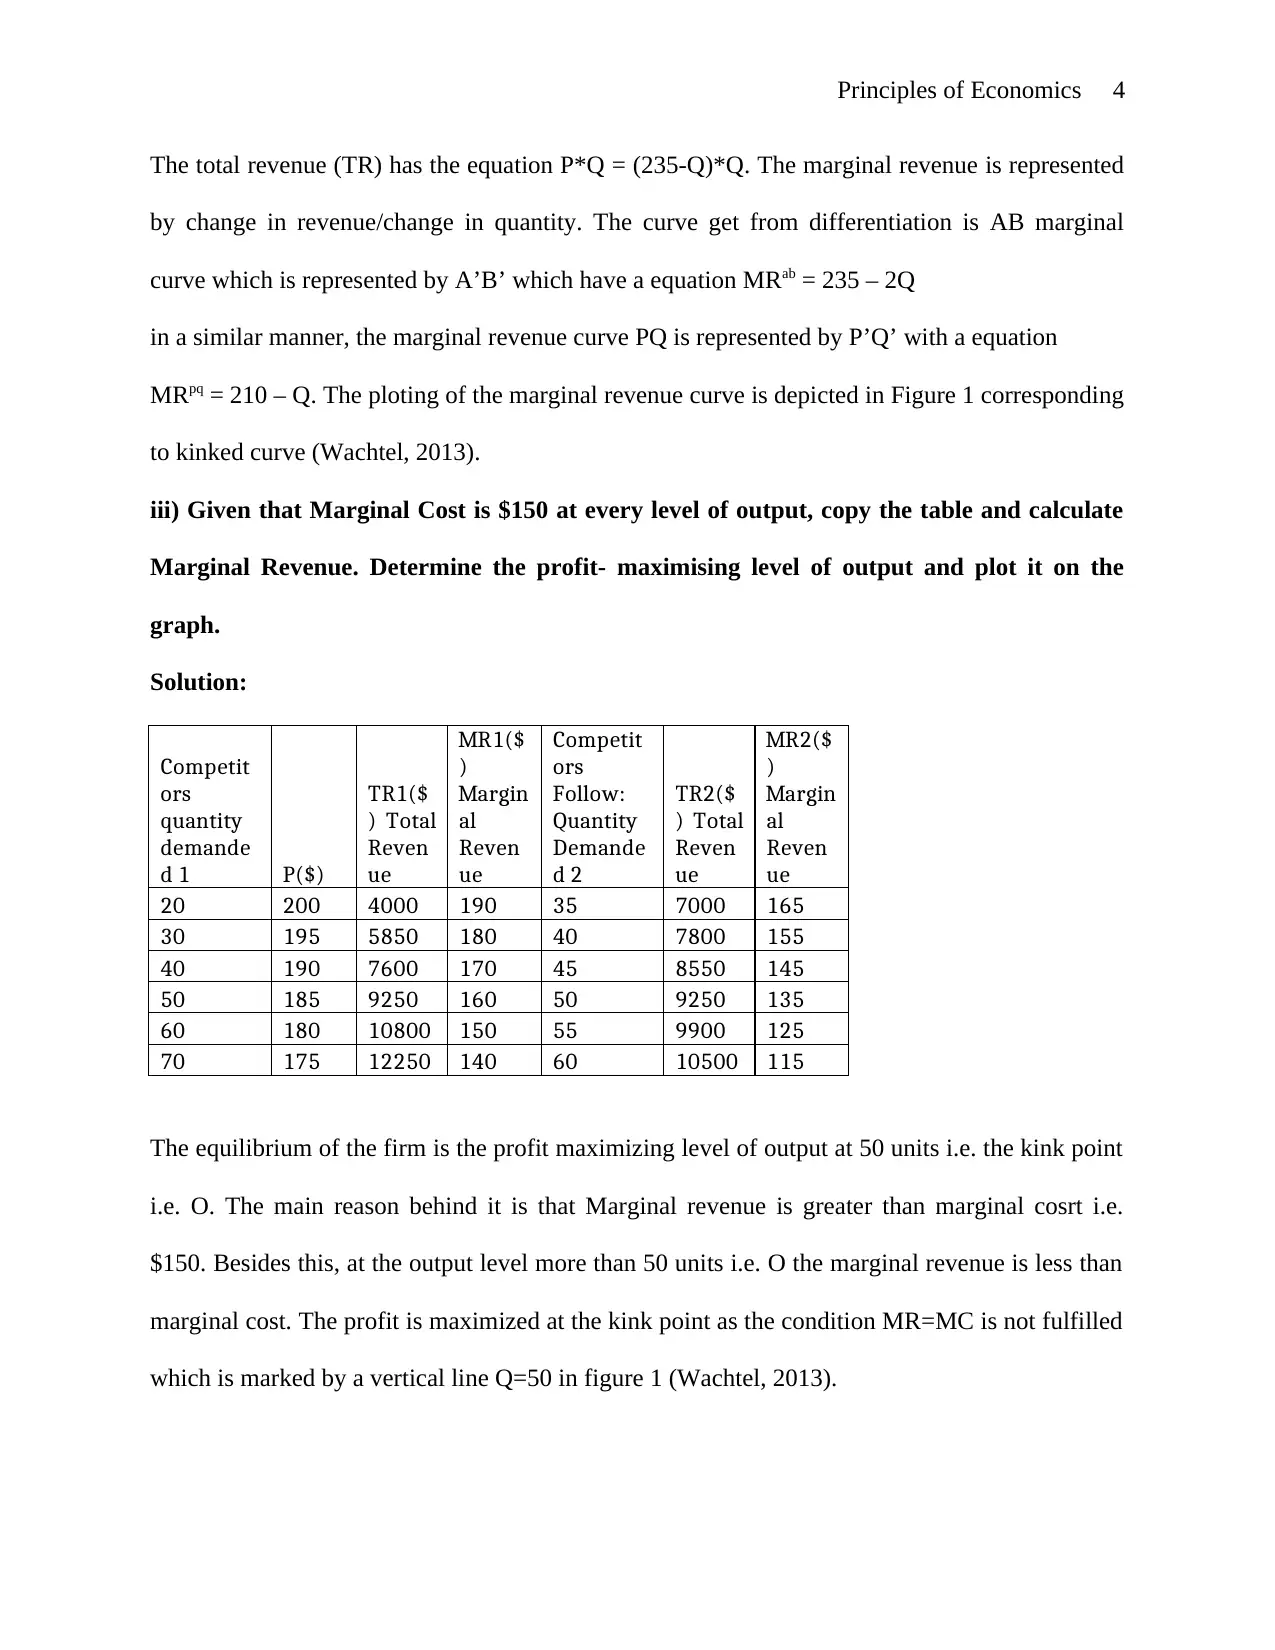
The total revenue (TR) has the equation P*Q = (235-Q)*Q. The marginal revenue is represented
by change in revenue/change in quantity. The curve get from differentiation is AB marginal
curve which is represented by A’B’ which have a equation MRab = 235 – 2Q
in a similar manner, the marginal revenue curve PQ is represented by P’Q’ with a equation
MRpq = 210 – Q. The ploting of the marginal revenue curve is depicted in Figure 1 corresponding
to kinked curve (Wachtel, 2013).
iii) Given that Marginal Cost is $150 at every level of output, copy the table and calculate
Marginal Revenue. Determine the profit- maximising level of output and plot it on the
graph.
Solution:
Competit
ors
quantity
demande
d 1 P($)
TR1($
) Total
Reven
ue
MR1($
)
Margin
al
Reven
ue
Competit
ors
Follow:
Quantity
Demande
d 2
TR2($
) Total
Reven
ue
MR2($
)
Margin
al
Reven
ue
20 200 4000 190 35 7000 165
30 195 5850 180 40 7800 155
40 190 7600 170 45 8550 145
50 185 9250 160 50 9250 135
60 180 10800 150 55 9900 125
70 175 12250 140 60 10500 115
The equilibrium of the firm is the profit maximizing level of output at 50 units i.e. the kink point
i.e. O. The main reason behind it is that Marginal revenue is greater than marginal cosrt i.e.
$150. Besides this, at the output level more than 50 units i.e. O the marginal revenue is less than
marginal cost. The profit is maximized at the kink point as the condition MR=MC is not fulfilled
which is marked by a vertical line Q=50 in figure 1 (Wachtel, 2013).
Paraphrase This Document
Need a fresh take? Get an instant paraphrase of this document with our AI Paraphraser
Principles of Economics 5
Q.2 a) Define, illustrate, and explain with examples market failure in the context of the
external costs of production (MSC > MC) of coal fired power station and the external cost
of consumption (MSB < MB) of alcohol to the society.
Solution:
External costs refers to the cost bear and imposed to a third party due to production and
consumption of a good and services. The social cost is greater than private cost due to
occurrence of negative externalities due to consumption of the product. Besides this, existence of
external costs results in the occurrence of market failure. The main reason behind it is that there
is an ignorance of external costs in the free market. There is an occurrence of market failure
when the free markets make inefficient use of scarce resources by failing to deliver productive
efficiency (Fusco, 2013).
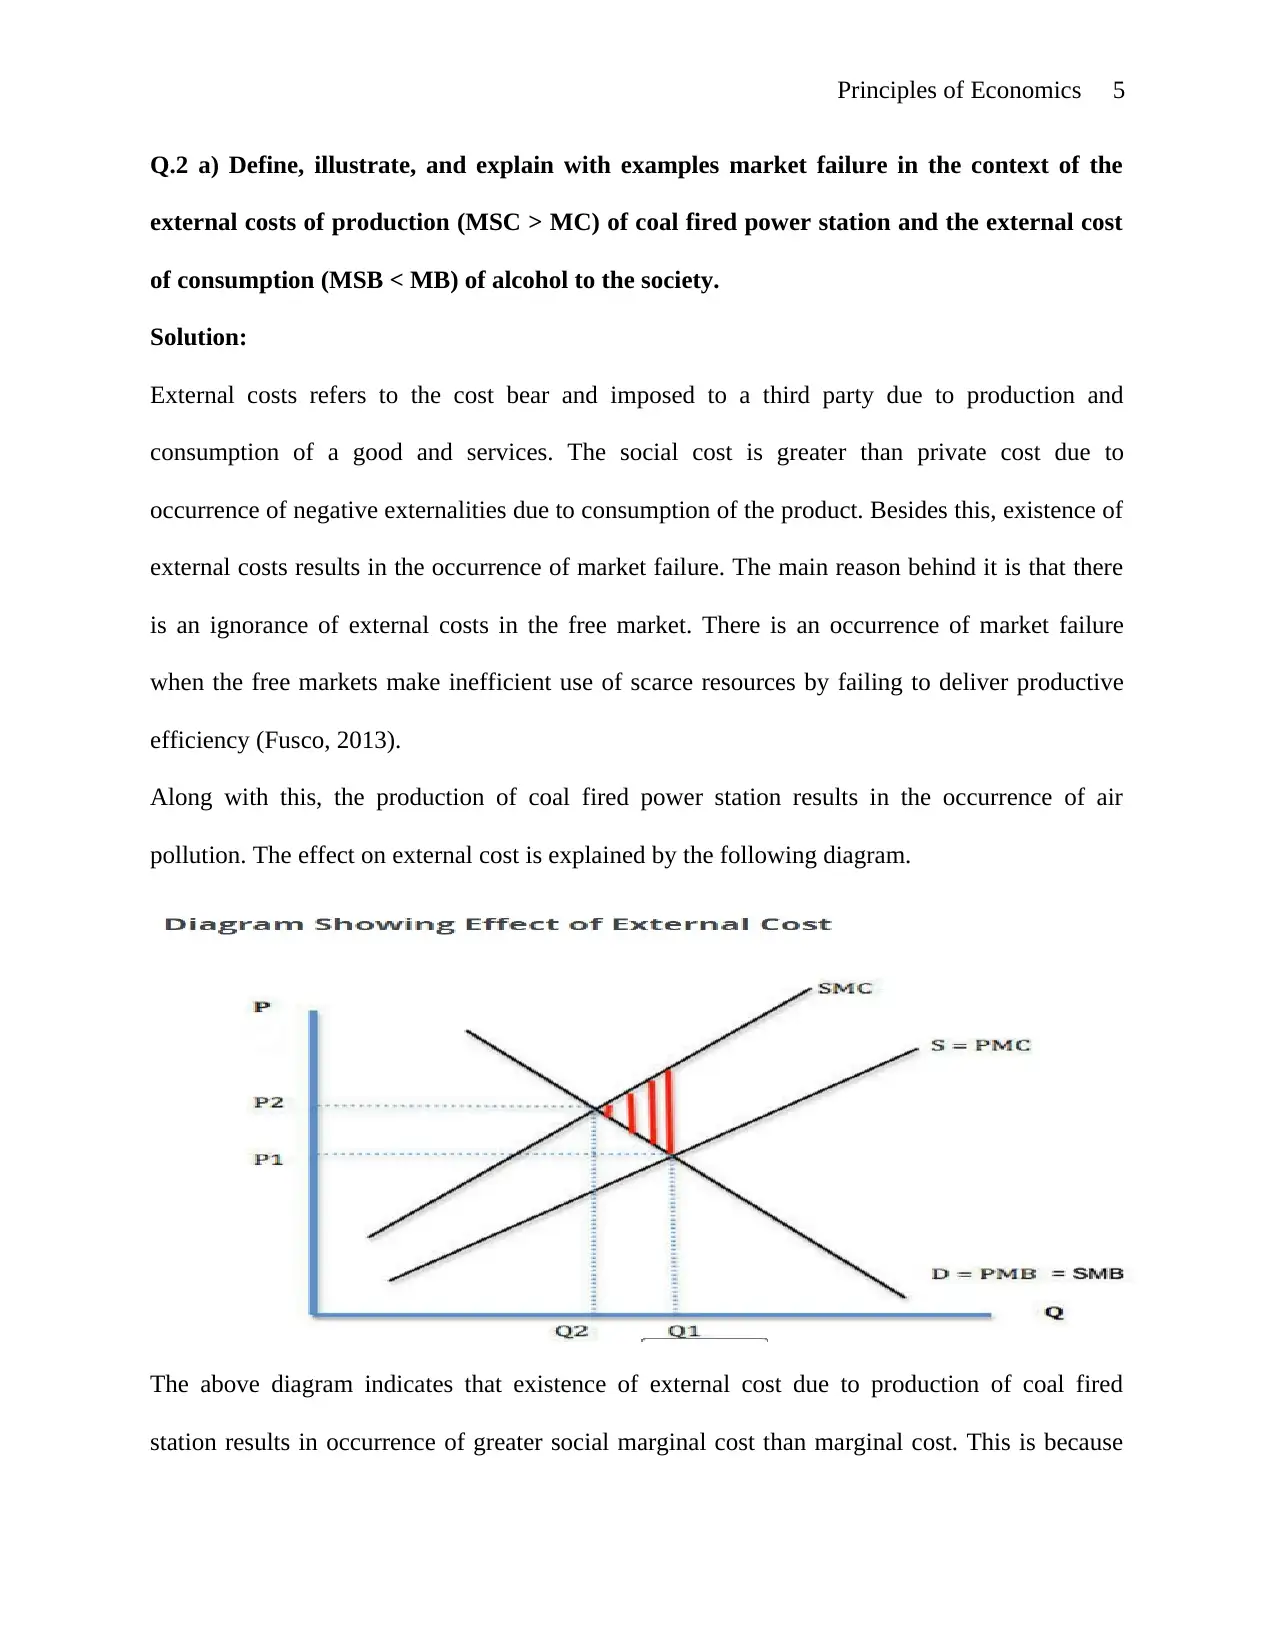
Along with this, the production of coal fired power station results in the occurrence of air
pollution. The effect on external cost is explained by the following diagram.
The above diagram indicates that existence of external cost due to production of coal fired
station results in occurrence of greater social marginal cost than marginal cost. This is because
Q.2 a) Define, illustrate, and explain with examples market failure in the context of the
external costs of production (MSC > MC) of coal fired power station and the external cost
of consumption (MSB < MB) of alcohol to the society.
Solution:
External costs refers to the cost bear and imposed to a third party due to production and
consumption of a good and services. The social cost is greater than private cost due to
occurrence of negative externalities due to consumption of the product. Besides this, existence of
external costs results in the occurrence of market failure. The main reason behind it is that there
is an ignorance of external costs in the free market. There is an occurrence of market failure
when the free markets make inefficient use of scarce resources by failing to deliver productive
efficiency (Fusco, 2013).
Along with this, the production of coal fired power station results in the occurrence of air
pollution. The effect on external cost is explained by the following diagram.
The above diagram indicates that existence of external cost due to production of coal fired
station results in occurrence of greater social marginal cost than marginal cost. This is because
Principles of Economics 6
there is a over production of the good at Q1 and social efficiency will occur at Q2 at which social
marginal cost = marginal cost.
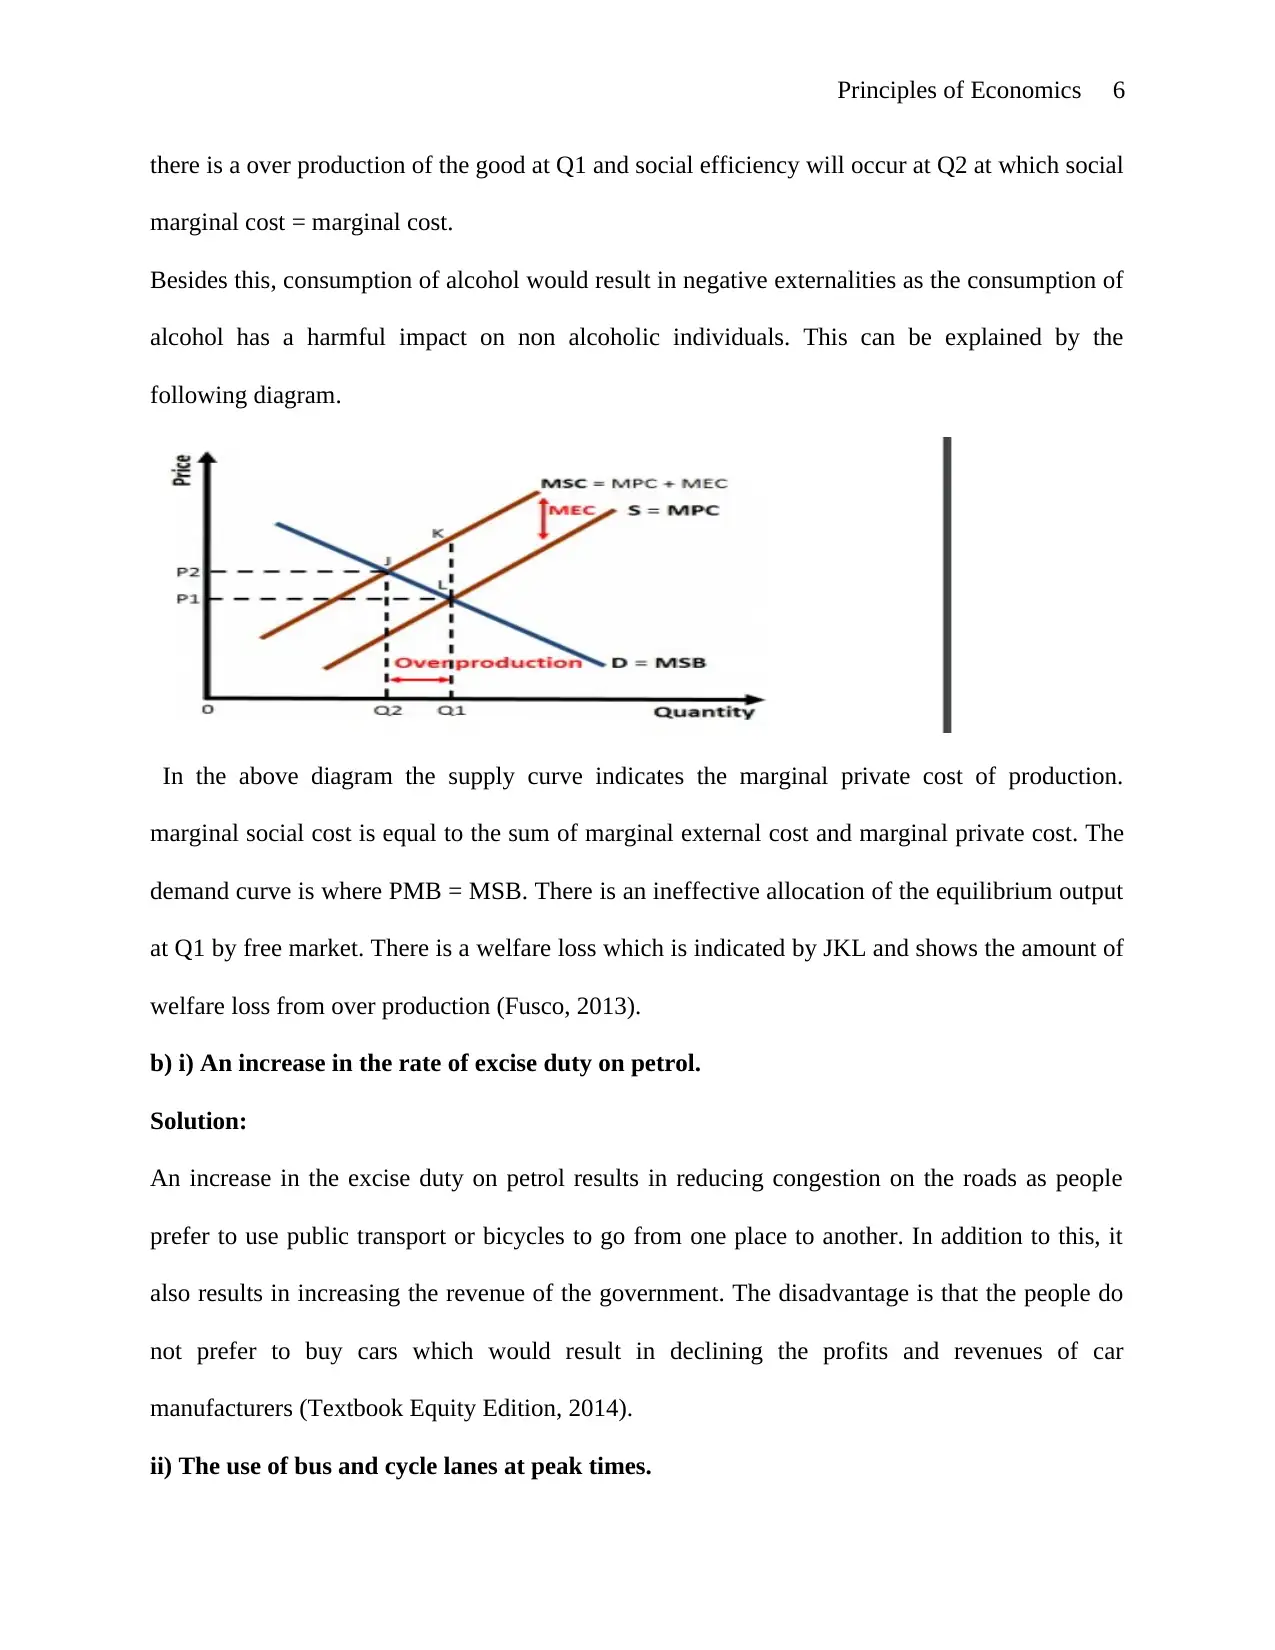
Besides this, consumption of alcohol would result in negative externalities as the consumption of
alcohol has a harmful impact on non alcoholic individuals. This can be explained by the
following diagram.
In the above diagram the supply curve indicates the marginal private cost of production.
marginal social cost is equal to the sum of marginal external cost and marginal private cost. The
demand curve is where PMB = MSB. There is an ineffective allocation of the equilibrium output
at Q1 by free market. There is a welfare loss which is indicated by JKL and shows the amount of
welfare loss from over production (Fusco, 2013).
b) i) An increase in the rate of excise duty on petrol.
Solution:
An increase in the excise duty on petrol results in reducing congestion on the roads as people
prefer to use public transport or bicycles to go from one place to another. In addition to this, it
also results in increasing the revenue of the government. The disadvantage is that the people do
not prefer to buy cars which would result in declining the profits and revenues of car
manufacturers (Textbook Equity Edition, 2014).
ii) The use of bus and cycle lanes at peak times.
there is a over production of the good at Q1 and social efficiency will occur at Q2 at which social
marginal cost = marginal cost.
Besides this, consumption of alcohol would result in negative externalities as the consumption of
alcohol has a harmful impact on non alcoholic individuals. This can be explained by the
following diagram.
In the above diagram the supply curve indicates the marginal private cost of production.
marginal social cost is equal to the sum of marginal external cost and marginal private cost. The
demand curve is where PMB = MSB. There is an ineffective allocation of the equilibrium output
at Q1 by free market. There is a welfare loss which is indicated by JKL and shows the amount of
welfare loss from over production (Fusco, 2013).
b) i) An increase in the rate of excise duty on petrol.
Solution:
An increase in the excise duty on petrol results in reducing congestion on the roads as people
prefer to use public transport or bicycles to go from one place to another. In addition to this, it
also results in increasing the revenue of the government. The disadvantage is that the people do
not prefer to buy cars which would result in declining the profits and revenues of car
manufacturers (Textbook Equity Edition, 2014).
ii) The use of bus and cycle lanes at peak times.
⊘ This is a preview!⊘
Do you want full access?
Subscribe today to unlock all pages.
Trusted by 1+ million students worldwide
Principles of Economics 7
Solution:
The use of bus and cycle lanes by motorists and car users at the peak times results in reducing
the congestion on the roads of Australia. This helps people to reach their destination in less time.
The disadvantage is that the pedestrians and other road users face problems as their lanes are
used by other vehicles (Harris & Roach, 2013).
iii) Using a system like Singapore (see box 7.2) where charges are deducted from a pre-paid
smart card inserted into a device in the car, and charges vary according to the time of day
and /or the level of congestion.
Solution:
The main advantage is that people are encouraged to use public transport as there is an increased
charges imposed to car owners and drivers. Besides this, it also consumes more time by the car
users to reach their destination. Besides this, the disadvantage is that it may result in reducing the
revenue of the government (McEachern, 2014).
Q.3 a)
i) Firms spend money on research and development.
Solution:
The spending of the money by firms on research and development results in increasing the
investments of the country which results in increase in the net injections (Keynes, 2017).
ii) The public invests more money in credit unions.
Solution:
It is assumed that the investment of money in credit unions by general public is not an
investment. It is a savings which results in an increase in the savings and hence increase in
withdrawals (Poletti, 2013).
Solution:
The use of bus and cycle lanes by motorists and car users at the peak times results in reducing
the congestion on the roads of Australia. This helps people to reach their destination in less time.
The disadvantage is that the pedestrians and other road users face problems as their lanes are
used by other vehicles (Harris & Roach, 2013).
iii) Using a system like Singapore (see box 7.2) where charges are deducted from a pre-paid
smart card inserted into a device in the car, and charges vary according to the time of day
and /or the level of congestion.
Solution:
The main advantage is that people are encouraged to use public transport as there is an increased
charges imposed to car owners and drivers. Besides this, it also consumes more time by the car
users to reach their destination. Besides this, the disadvantage is that it may result in reducing the
revenue of the government (McEachern, 2014).
Q.3 a)
i) Firms spend money on research and development.
Solution:
The spending of the money by firms on research and development results in increasing the
investments of the country which results in increase in the net injections (Keynes, 2017).
ii) The public invests more money in credit unions.
Solution:
It is assumed that the investment of money in credit unions by general public is not an
investment. It is a savings which results in an increase in the savings and hence increase in
withdrawals (Poletti, 2013).
Paraphrase This Document
Need a fresh take? Get an instant paraphrase of this document with our AI Paraphraser
Principles of Economics 8
iii) The government runs a budget deficit and finances it by printing more money.
Solution:
It is considered as an increase in the government expenditure or it can result in decline in the
taxes or affects both which is not adjusted by the changes. The printing of the currency notes
results in increase in the net injections (Keynes, 2017).
iv) Australian investors earn higher dividends on overseas investments.
Solution:
The earning of dividends from overseas investments results in decline in the withdrawals as it
results in decrease in the net outflow of the funds to abroad from household sector. Thus it would
result in reduction in the withdrawals (Poletti, 2013).
b) i) Gross Domestic Product (GDP= C+I+G+NX) using the expenditure approach
Solution:
Gross Domestic Product = Gross private domestic investment+ government consumption
expenditure+ government investment expenditure+ household private consumption expenditure+
(Exports –Imports)
GDP = 35000+15000+ 25000+ 60000+ (15000-20000)
GDP = $130000 billion
ii) Withdrawals (S+T+M)
Solution:
Withdrawals = Savings+ Taxes+ imports = 6000+15000+20000 = $41000 billion.
iii) Injections (I+G+X)
Solution:
Injections = Investments+ Government Expenditure+ Net exports
Principles of Economics 9
= Gross private domestic investment+ government consumption expenditure+ government
investment expenditure+ exports = 35000+15000+25000+ 15000 =$ 90000 billion.
Q.4 a) i) Inflationary gap
Solution:
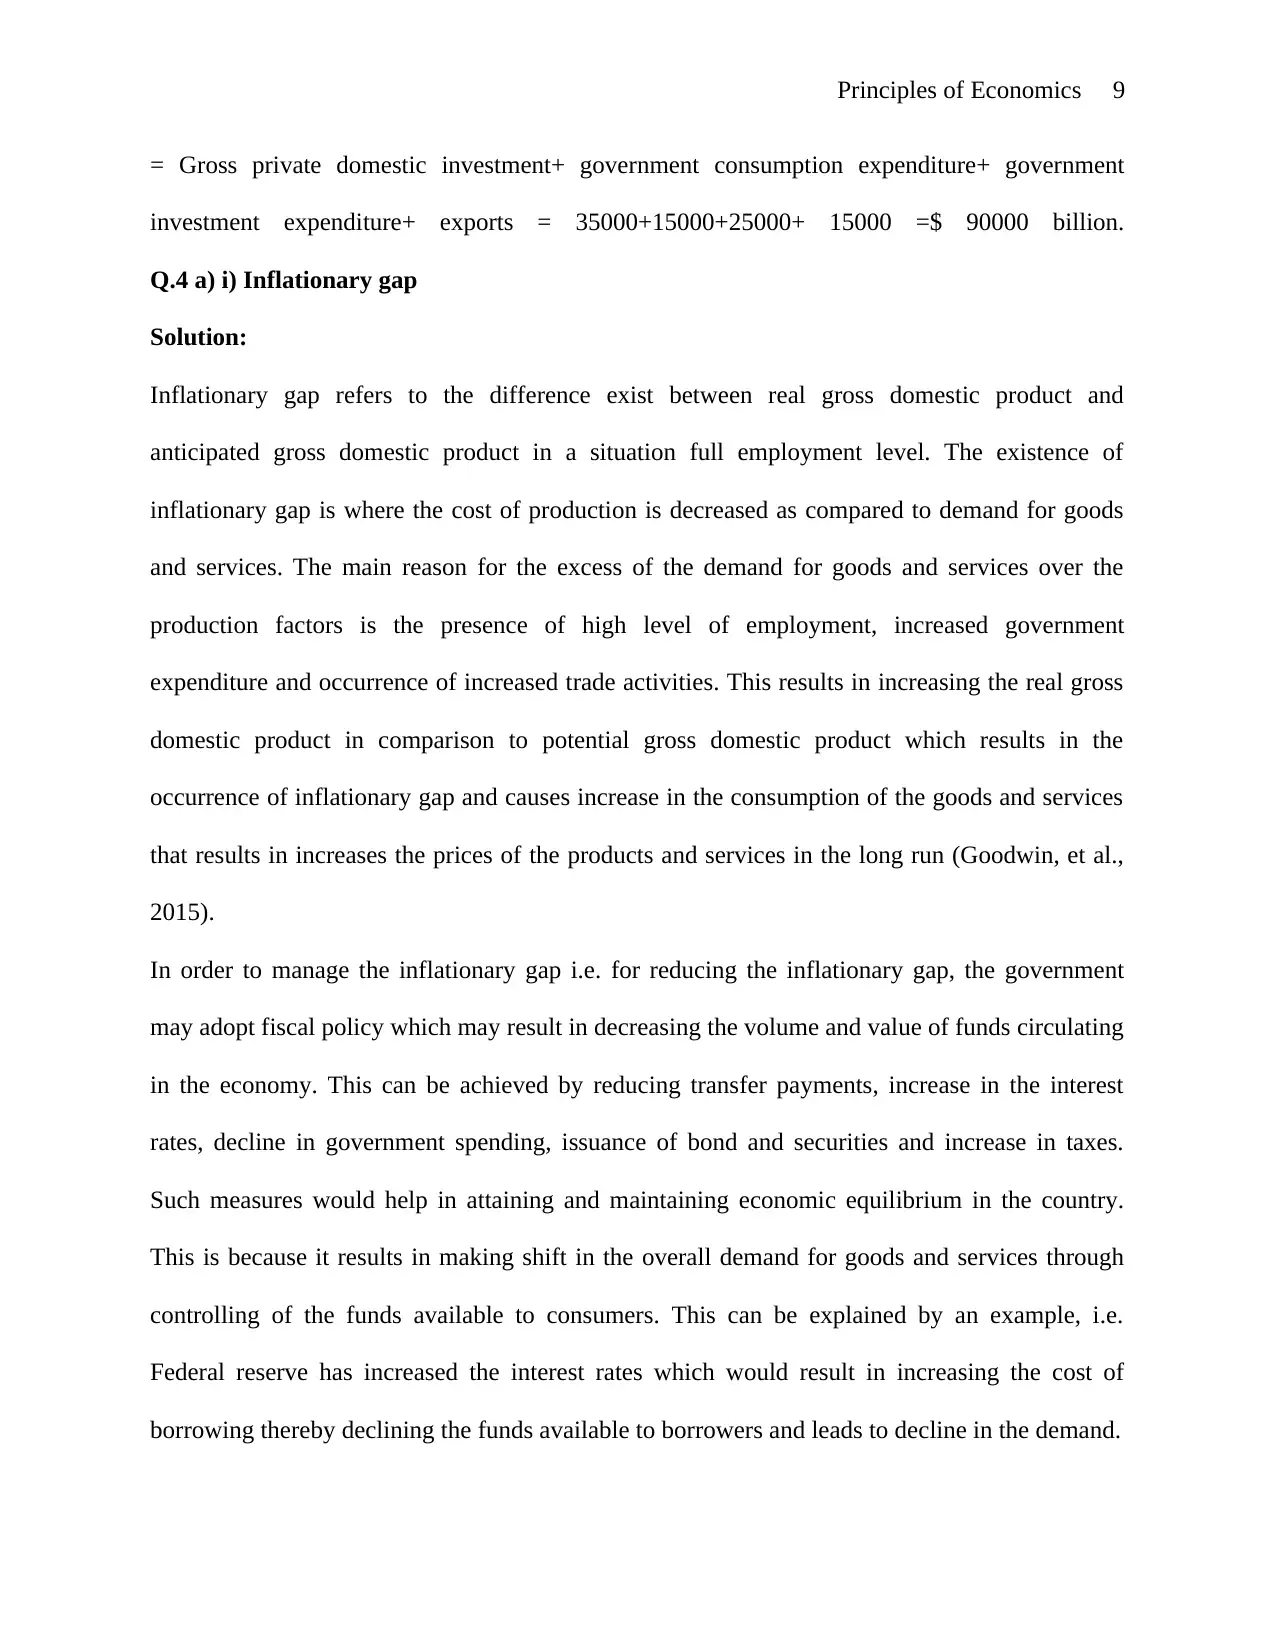
Inflationary gap refers to the difference exist between real gross domestic product and
anticipated gross domestic product in a situation full employment level. The existence of
inflationary gap is where the cost of production is decreased as compared to demand for goods
and services. The main reason for the excess of the demand for goods and services over the
production factors is the presence of high level of employment, increased government
expenditure and occurrence of increased trade activities. This results in increasing the real gross
domestic product in comparison to potential gross domestic product which results in the
occurrence of inflationary gap and causes increase in the consumption of the goods and services
that results in increases the prices of the products and services in the long run (Goodwin, et al.,
2015).
In order to manage the inflationary gap i.e. for reducing the inflationary gap, the government
may adopt fiscal policy which may result in decreasing the volume and value of funds circulating
in the economy. This can be achieved by reducing transfer payments, increase in the interest
rates, decline in government spending, issuance of bond and securities and increase in taxes.
Such measures would help in attaining and maintaining economic equilibrium in the country.
This is because it results in making shift in the overall demand for goods and services through
controlling of the funds available to consumers. This can be explained by an example, i.e.
Federal reserve has increased the interest rates which would result in increasing the cost of
borrowing thereby declining the funds available to borrowers and leads to decline in the demand.
= Gross private domestic investment+ government consumption expenditure+ government
investment expenditure+ exports = 35000+15000+25000+ 15000 =$ 90000 billion.
Q.4 a) i) Inflationary gap
Solution:
Inflationary gap refers to the difference exist between real gross domestic product and
anticipated gross domestic product in a situation full employment level. The existence of
inflationary gap is where the cost of production is decreased as compared to demand for goods
and services. The main reason for the excess of the demand for goods and services over the
production factors is the presence of high level of employment, increased government
expenditure and occurrence of increased trade activities. This results in increasing the real gross
domestic product in comparison to potential gross domestic product which results in the
occurrence of inflationary gap and causes increase in the consumption of the goods and services
that results in increases the prices of the products and services in the long run (Goodwin, et al.,
2015).
In order to manage the inflationary gap i.e. for reducing the inflationary gap, the government
may adopt fiscal policy which may result in decreasing the volume and value of funds circulating
in the economy. This can be achieved by reducing transfer payments, increase in the interest
rates, decline in government spending, issuance of bond and securities and increase in taxes.
Such measures would help in attaining and maintaining economic equilibrium in the country.
This is because it results in making shift in the overall demand for goods and services through
controlling of the funds available to consumers. This can be explained by an example, i.e.
Federal reserve has increased the interest rates which would result in increasing the cost of
borrowing thereby declining the funds available to borrowers and leads to decline in the demand.
⊘ This is a preview!⊘
Do you want full access?
Subscribe today to unlock all pages.
Trusted by 1+ million students worldwide
Principles of Economics 10
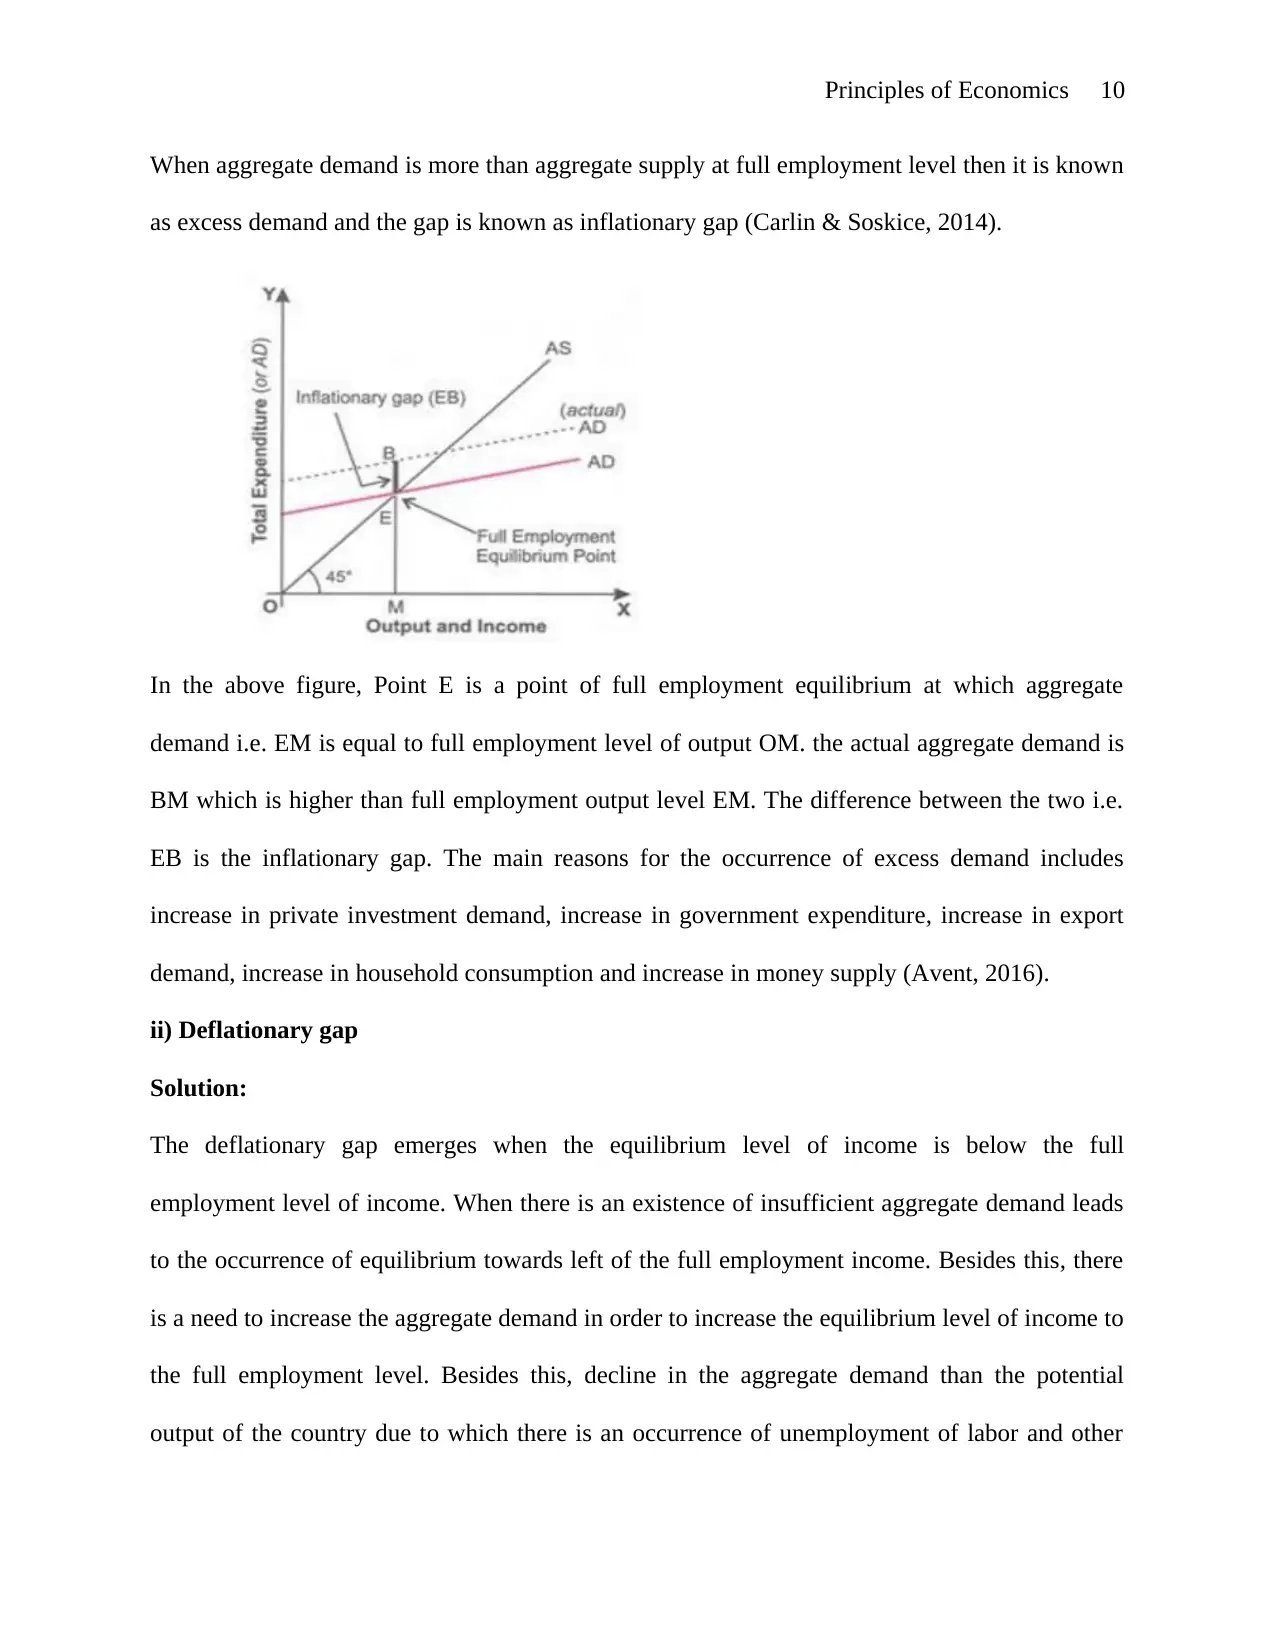
When aggregate demand is more than aggregate supply at full employment level then it is known
as excess demand and the gap is known as inflationary gap (Carlin & Soskice, 2014).
In the above figure, Point E is a point of full employment equilibrium at which aggregate
demand i.e. EM is equal to full employment level of output OM. the actual aggregate demand is
BM which is higher than full employment output level EM. The difference between the two i.e.
EB is the inflationary gap. The main reasons for the occurrence of excess demand includes
increase in private investment demand, increase in government expenditure, increase in export
demand, increase in household consumption and increase in money supply (Avent, 2016).
ii) Deflationary gap
Solution:
The deflationary gap emerges when the equilibrium level of income is below the full
employment level of income. When there is an existence of insufficient aggregate demand leads
to the occurrence of equilibrium towards left of the full employment income. Besides this, there
is a need to increase the aggregate demand in order to increase the equilibrium level of income to
the full employment level. Besides this, decline in the aggregate demand than the potential
output of the country due to which there is an occurrence of unemployment of labor and other
Paraphrase This Document
Need a fresh take? Get an instant paraphrase of this document with our AI Paraphraser
Principles of Economics 11
resources. The equilibrium is established at full employment level in case where aggregate
demand i.e. consumption+ investment+ government demand is equal to national income. It is
possible when investment and government demand is equal to saving gap at national income.
The deflationary gap exists when investment and government demand is less than the saving gap
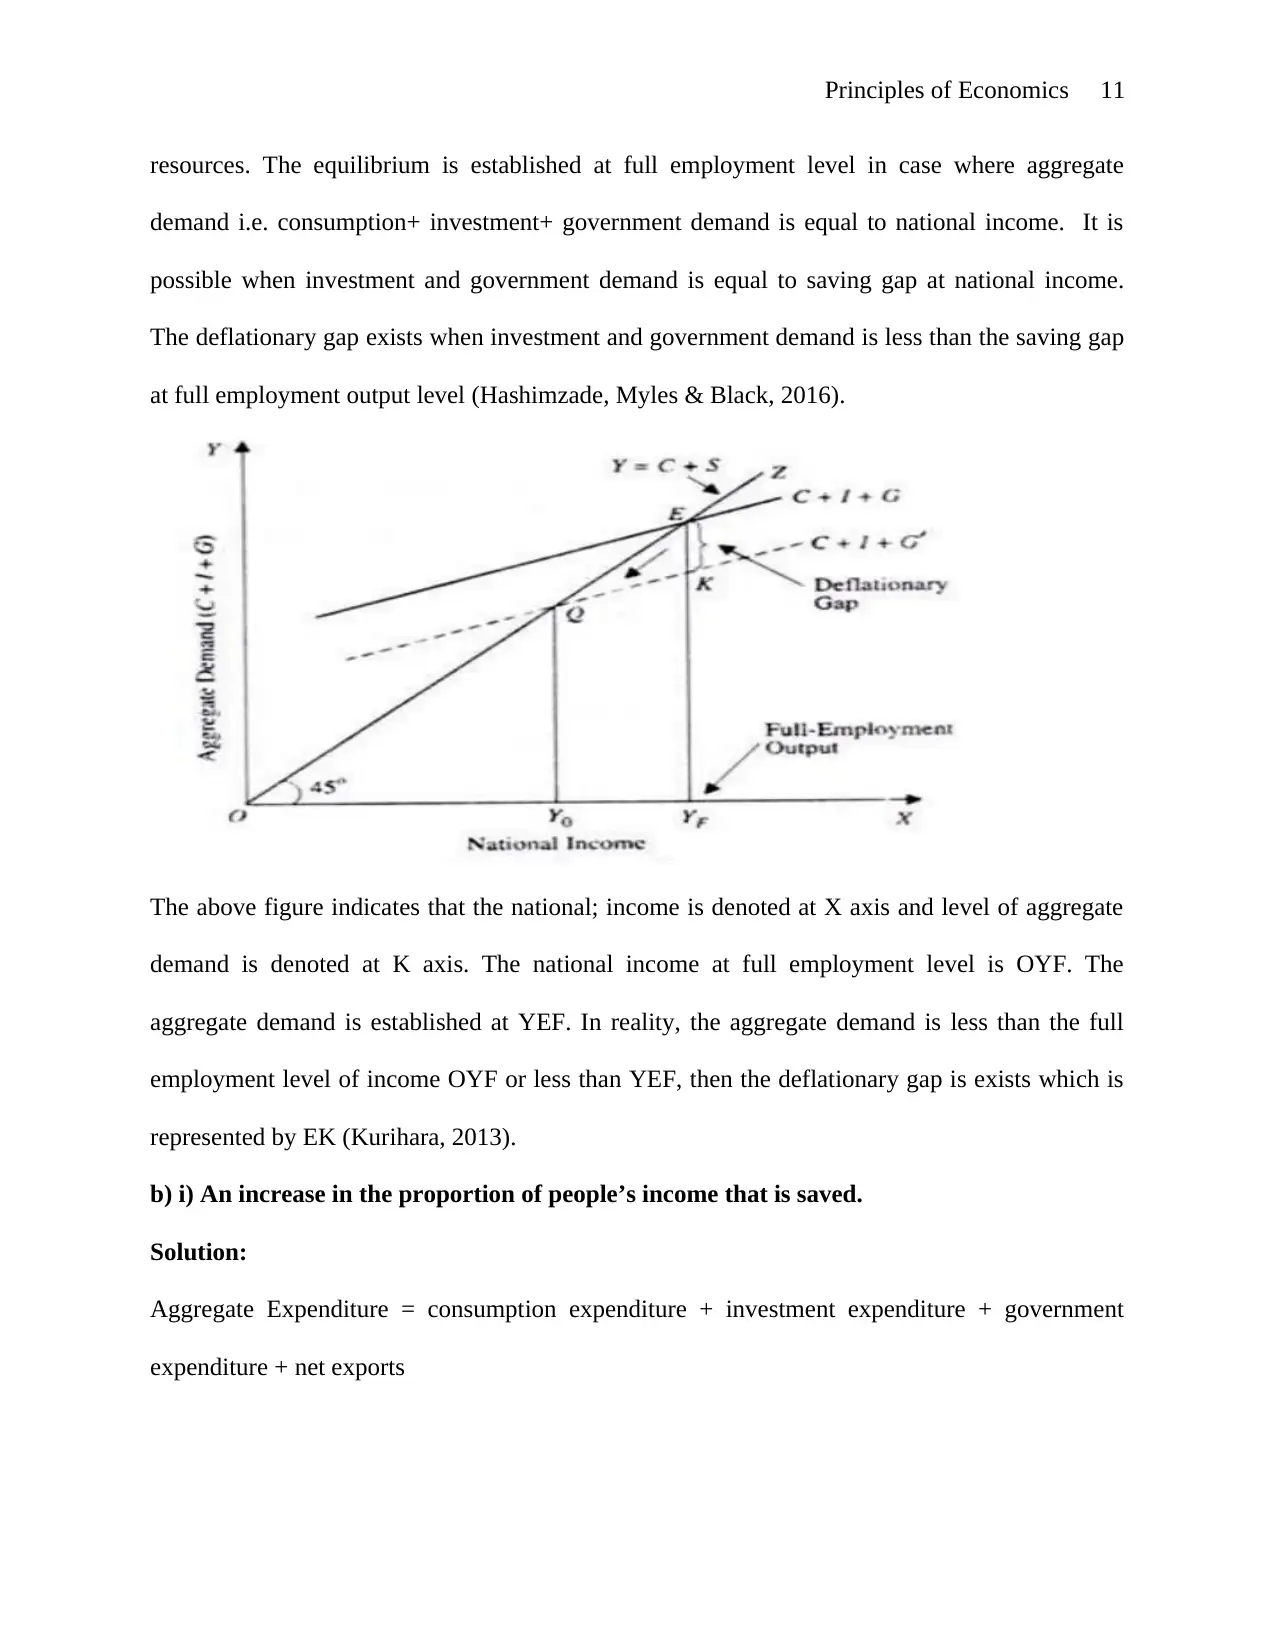
at full employment output level (Hashimzade, Myles & Black, 2016).
The above figure indicates that the national; income is denoted at X axis and level of aggregate
demand is denoted at K axis. The national income at full employment level is OYF. The
aggregate demand is established at YEF. In reality, the aggregate demand is less than the full
employment level of income OYF or less than YEF, then the deflationary gap is exists which is
represented by EK (Kurihara, 2013).
b) i) An increase in the proportion of people’s income that is saved.
Solution:
Aggregate Expenditure = consumption expenditure + investment expenditure + government
expenditure + net exports
resources. The equilibrium is established at full employment level in case where aggregate
demand i.e. consumption+ investment+ government demand is equal to national income. It is
possible when investment and government demand is equal to saving gap at national income.
The deflationary gap exists when investment and government demand is less than the saving gap
at full employment output level (Hashimzade, Myles & Black, 2016).
The above figure indicates that the national; income is denoted at X axis and level of aggregate
demand is denoted at K axis. The national income at full employment level is OYF. The
aggregate demand is established at YEF. In reality, the aggregate demand is less than the full
employment level of income OYF or less than YEF, then the deflationary gap is exists which is
represented by EK (Kurihara, 2013).
b) i) An increase in the proportion of people’s income that is saved.
Solution:
Aggregate Expenditure = consumption expenditure + investment expenditure + government
expenditure + net exports
Principles of Economics 12
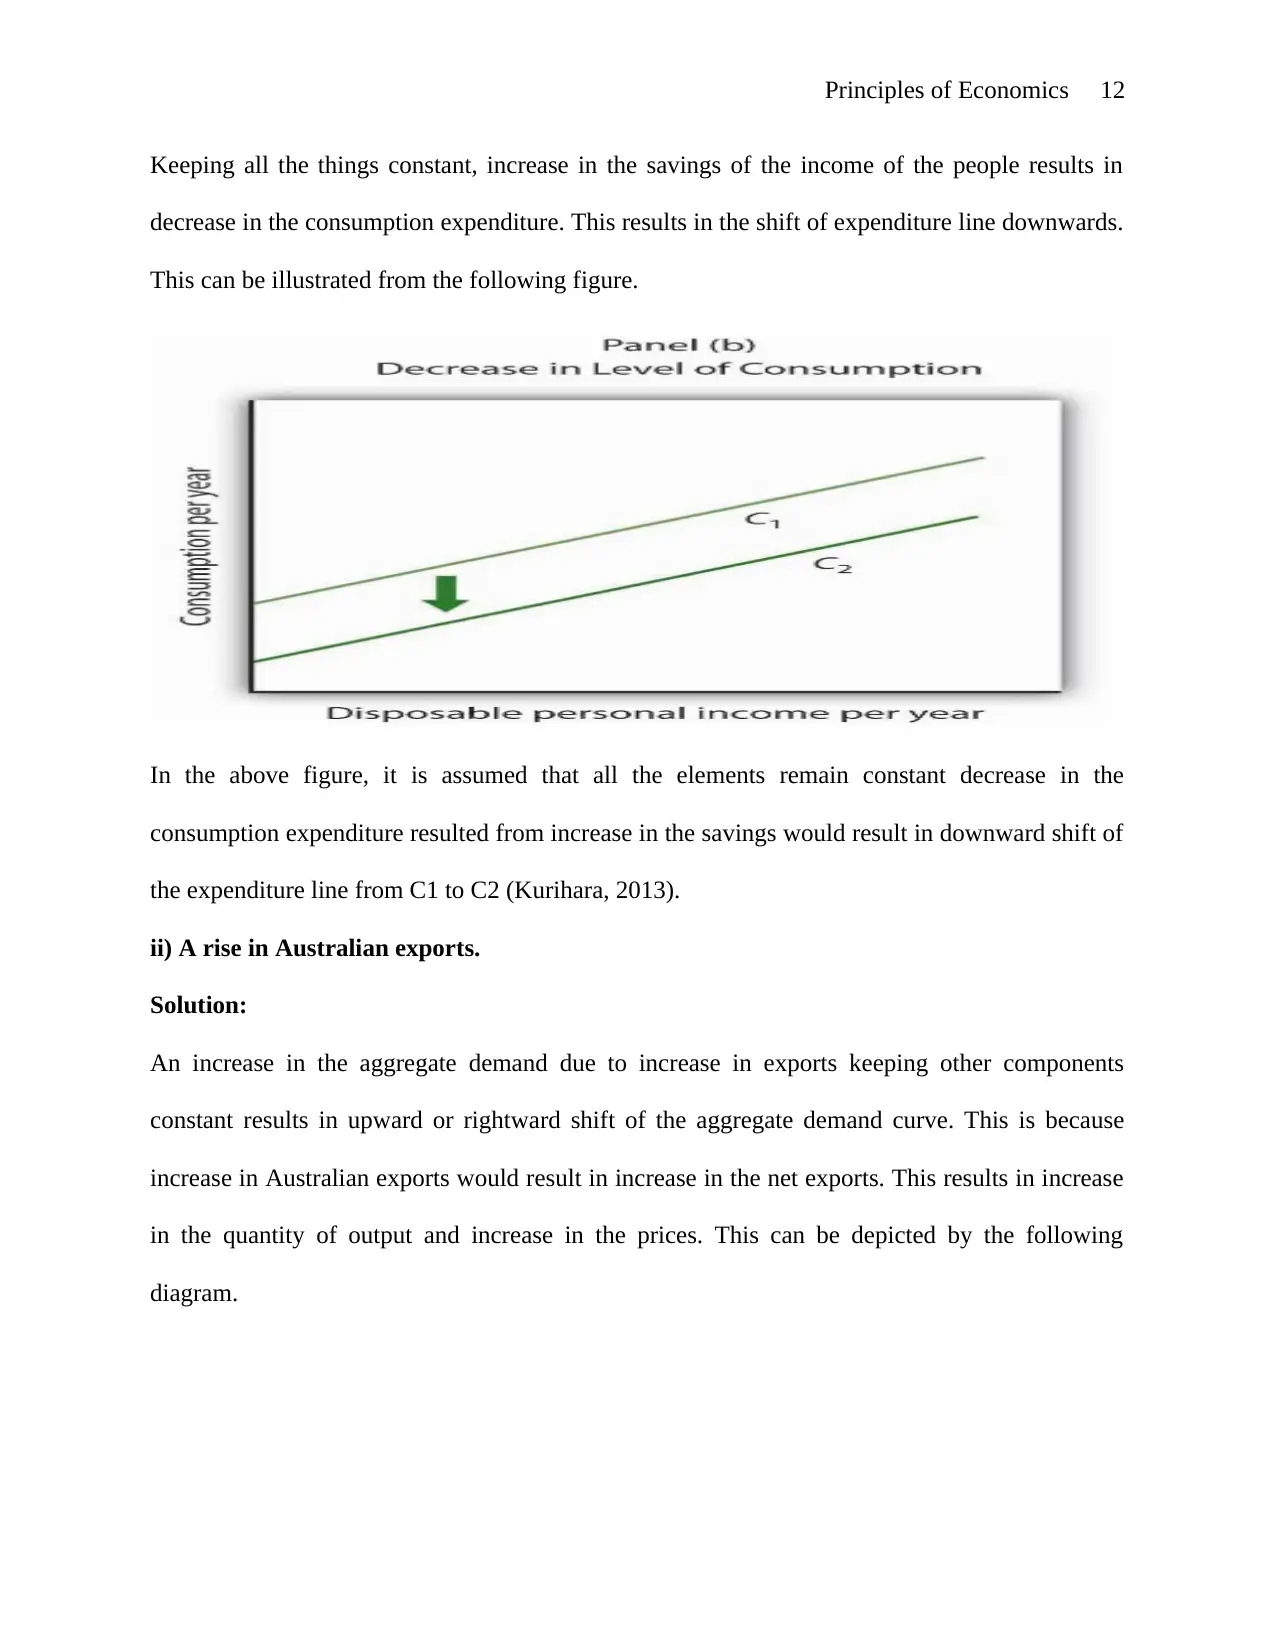
Keeping all the things constant, increase in the savings of the income of the people results in
decrease in the consumption expenditure. This results in the shift of expenditure line downwards.
This can be illustrated from the following figure.
In the above figure, it is assumed that all the elements remain constant decrease in the
consumption expenditure resulted from increase in the savings would result in downward shift of
the expenditure line from C1 to C2 (Kurihara, 2013).
ii) A rise in Australian exports.
Solution:
An increase in the aggregate demand due to increase in exports keeping other components
constant results in upward or rightward shift of the aggregate demand curve. This is because
increase in Australian exports would result in increase in the net exports. This results in increase
in the quantity of output and increase in the prices. This can be depicted by the following
diagram.
⊘ This is a preview!⊘
Do you want full access?
Subscribe today to unlock all pages.
Trusted by 1+ million students worldwide
1 out of 14
Related Documents


Your All-in-One AI-Powered Toolkit for Academic Success.
+13062052269
info@desklib.com
Available 24*7 on WhatsApp / Email
![[object Object]](/_next/static/media/star-bottom.7253800d.svg)
Unlock your academic potential
Copyright © 2020–2026 A2Z Services. All Rights Reserved. Developed and managed by ZUCOL.