ATMC BUS502: Principles of Economics for Accountants - Soda Tax

Verified

Added on  2023/03/23

|4
|798
|73
Homework Assignment
AI Summary
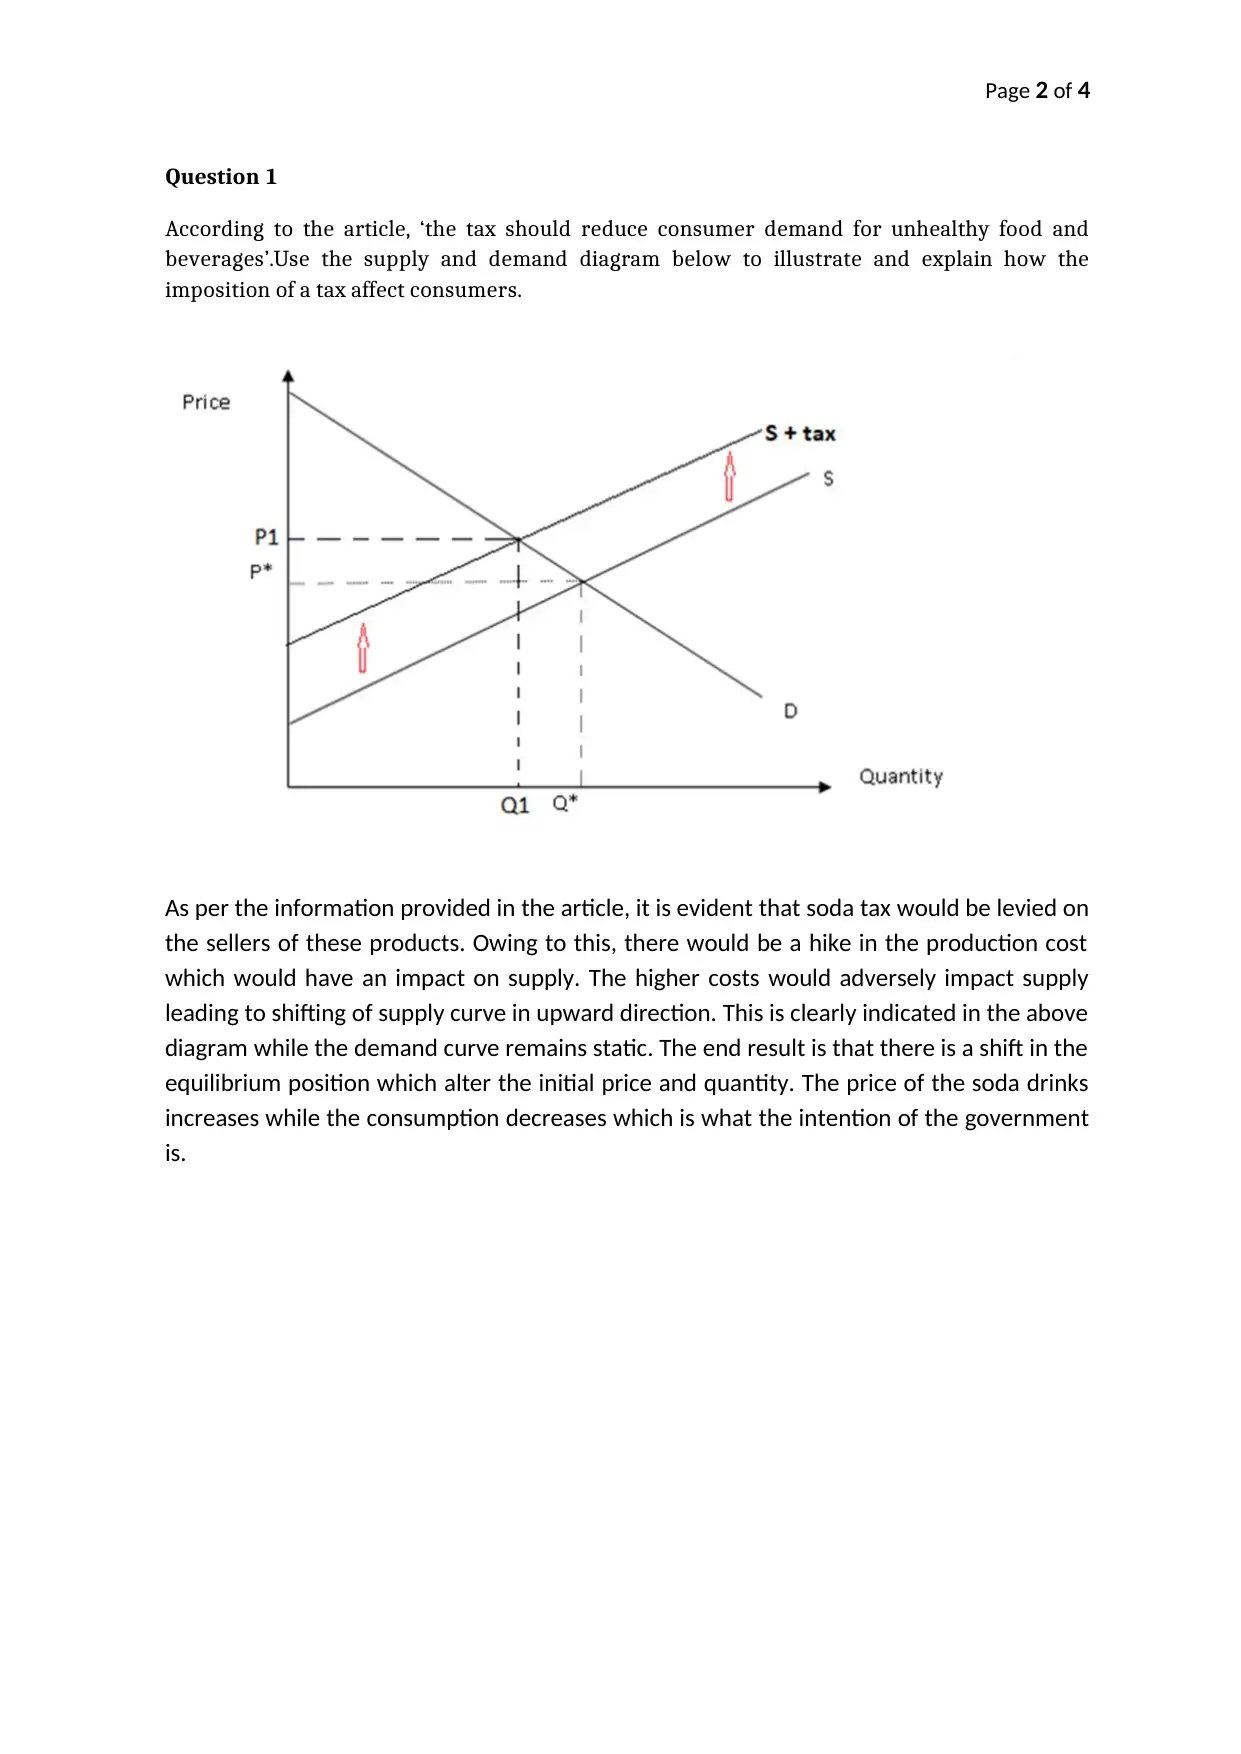
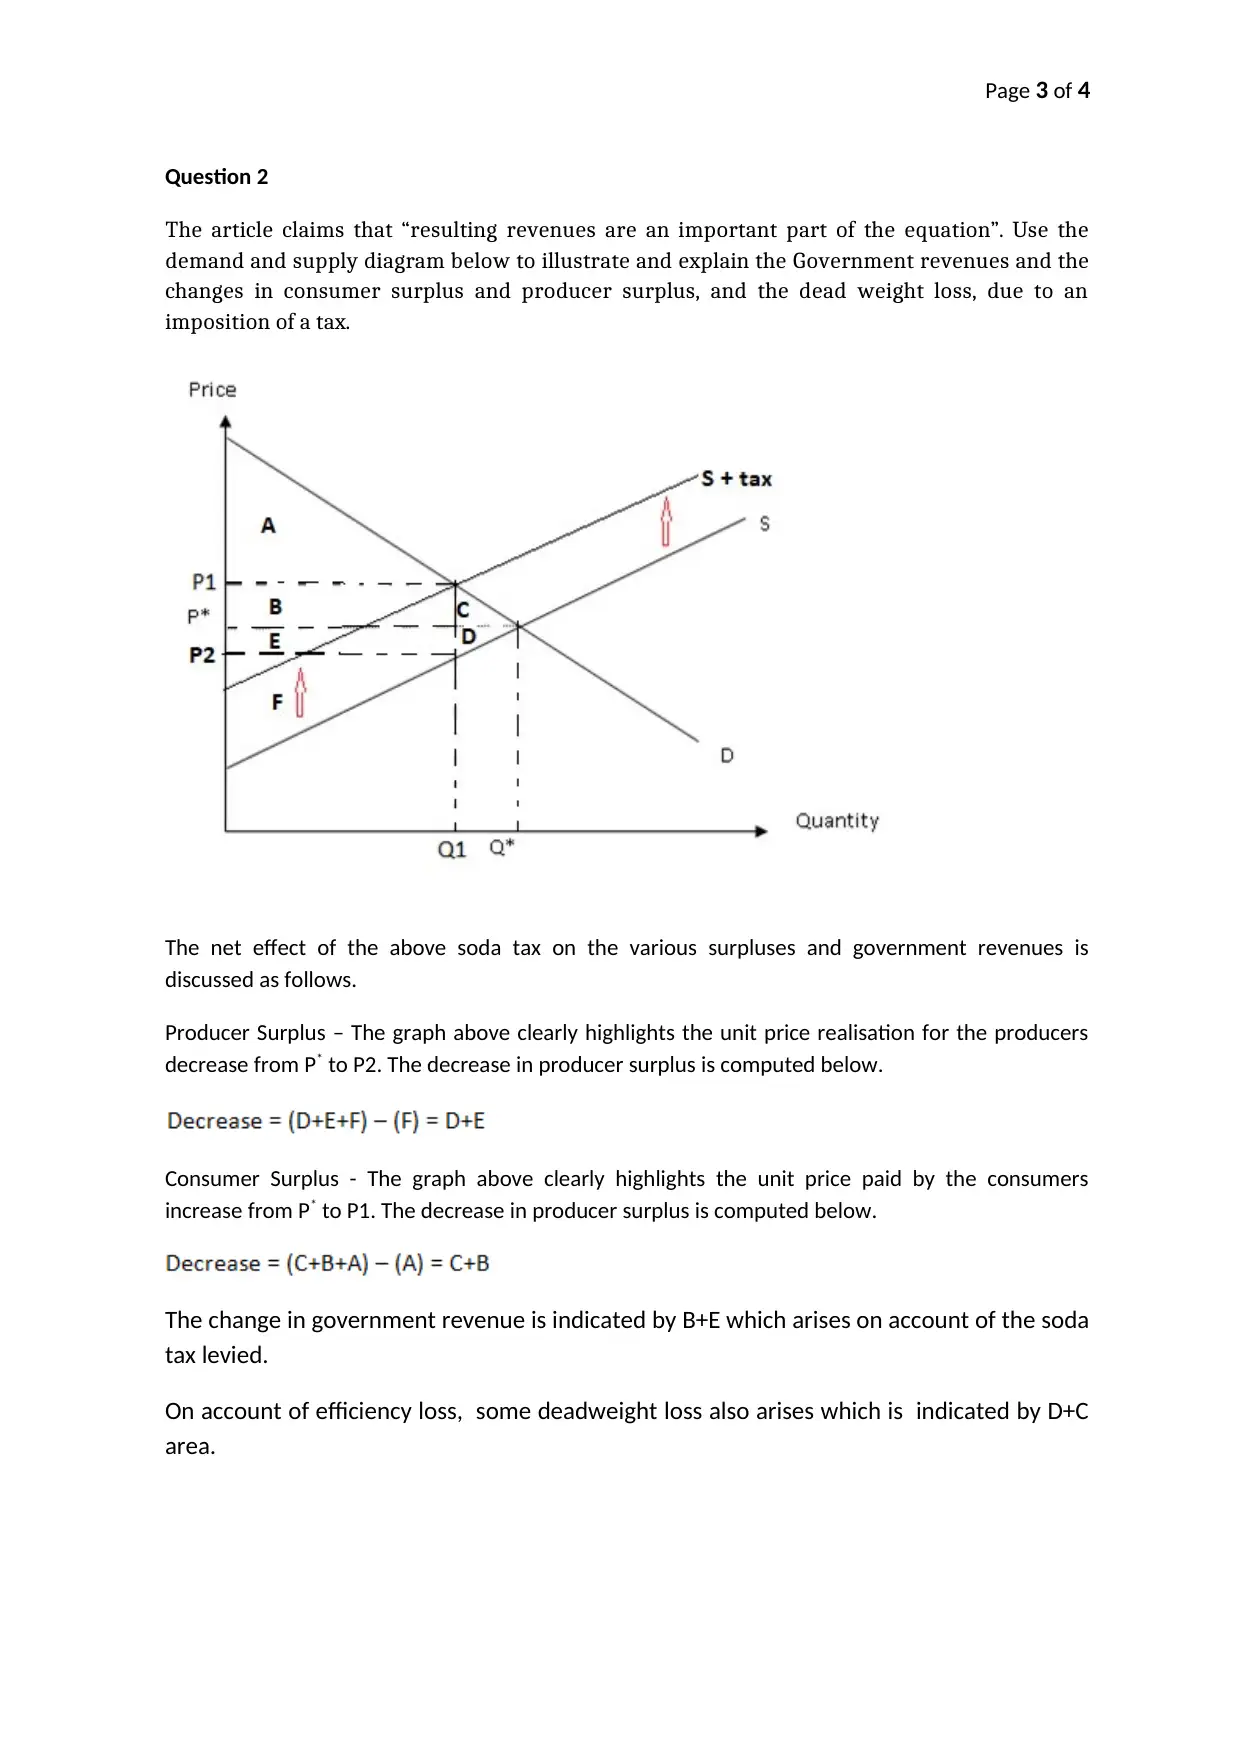
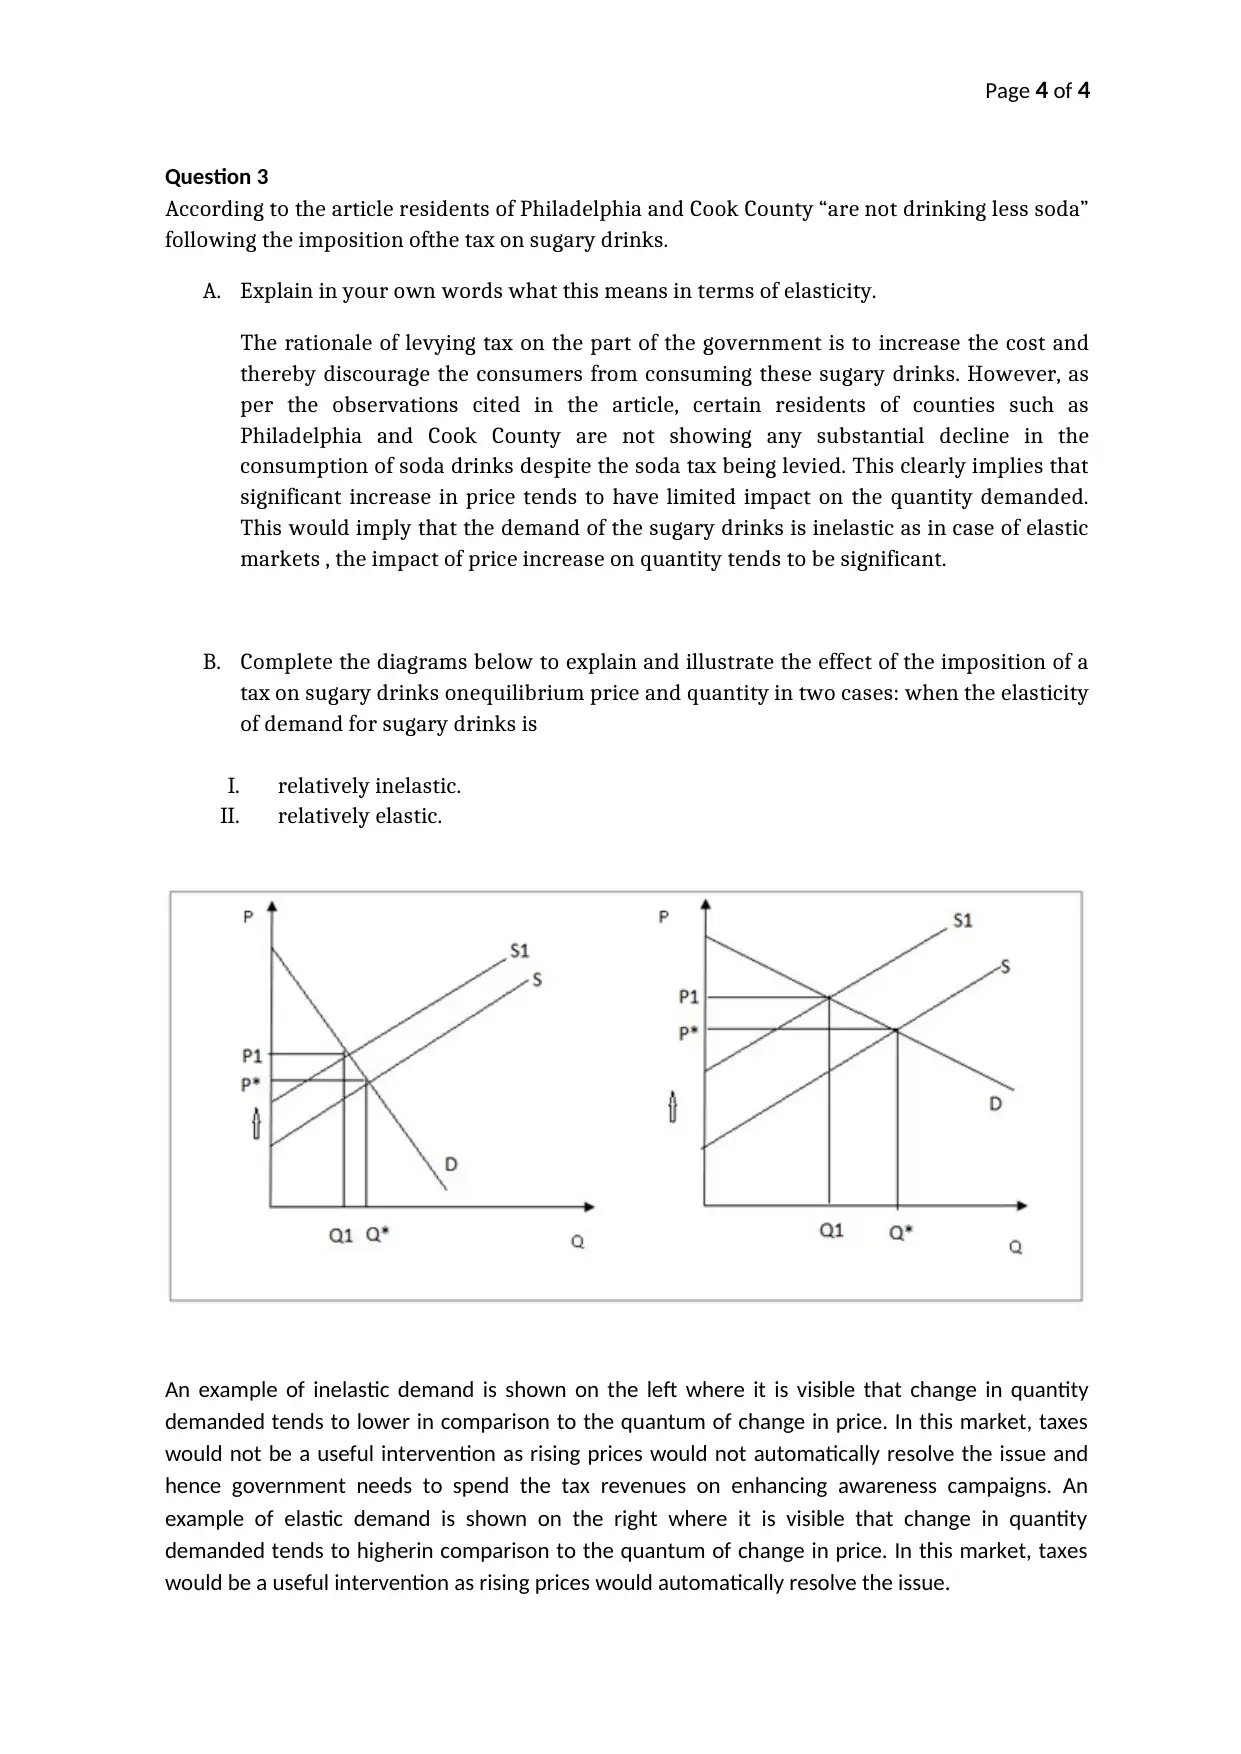
This assignment analyzes the economic impacts of a soda tax, based on an article discussing the tax's effects on consumer demand and government revenue. The solution uses supply and demand diagrams to illustrate how the tax affects consumers, producers, and the overall market equilibrium. It explores changes in consumer and producer surplus, government revenue, and deadweight loss. The assignment also delves into the concept of elasticity, explaining why the tax may not reduce soda consumption in some areas and illustrating the effects of the tax under both elastic and inelastic demand conditions. The student provides clear explanations and diagrams to support their answers, demonstrating a strong understanding of economic principles.
Document Page
Page 1 of 4
ATMC BUS502 Principles of Economics for Accountants
Assessment Task 2 – Responses to articles
Article 2: DUE via Safe Assign 6pm Saturday 12th May
Full Name:
Student number:
Tutor’s name:
Article Title:
What is the Soda Tax and which cities have one”by Beverly Birdfrom The Balance from
25th November 2018. Available at:
https://www.thebalance.com/soda-tax-and-which-cities-have-one-4151209
Instructions:
Access the article at the URL given above and read it carefully. Answer the questions and
complete the diagrams in the spaces provided below. Use full sentences. If you use any
references, please list at least the URL of your source. Possible total for this assessment task is
15 marks.
tabler-icon-diamond-filled.svg

Paraphrase This Document

Need a fresh take? Get an instant paraphrase of this document with our AI Paraphraser
Document Page
Page 2 of 4
Question 1
According to the article, ‘the tax should reduce consumer demand for unhealthy food and
beverages’.Use the supply and demand diagram below to illustrate and explain how the
imposition of a tax affect consumers.
As per the information provided in the article, it is evident that soda tax would be levied on
the sellers of these products. Owing to this, there would be a hike in the production cost
which would have an impact on supply. The higher costs would adversely impact supply
leading to shifting of supply curve in upward direction. This is clearly indicated in the above
diagram while the demand curve remains static. The end result is that there is a shift in the
equilibrium position which alter the initial price and quantity. The price of the soda drinks
increases while the consumption decreases which is what the intention of the government
is.
Document Page
Page 3 of 4
Question 2
The article claims that “resulting revenues are an important part of the equation”. Use the
demand and supply diagram below to illustrate and explain the Government revenues and the
changes in consumer surplus and producer surplus, and the dead weight loss, due to an
imposition of a tax.
The net effect of the above soda tax on the various surpluses and government revenues is
discussed as follows.
Producer Surplus – The graph above clearly highlights the unit price realisation for the producers
decrease from P* to P2. The decrease in producer surplus is computed below.
Consumer Surplus - The graph above clearly highlights the unit price paid by the consumers
increase from P* to P1. The decrease in producer surplus is computed below.
The change in government revenue is indicated by B+E which arises on account of the soda
tax levied.
On account of efficiency loss, some deadweight loss also arises which is indicated by D+C
area.
Document Page
Page 4 of 4
Question 3
According to the article residents of Philadelphia and Cook County “are not drinking less soda”
following the imposition ofthe tax on sugary drinks.
A. Explain in your own words what this means in terms of elasticity.
The rationale of levying tax on the part of the government is to increase the cost and
thereby discourage the consumers from consuming these sugary drinks. However, as
per the observations cited in the article, certain residents of counties such as
Philadelphia and Cook County are not showing any substantial decline in the
consumption of soda drinks despite the soda tax being levied. This clearly implies that
significant increase in price tends to have limited impact on the quantity demanded.
This would imply that the demand of the sugary drinks is inelastic as in case of elastic
markets , the impact of price increase on quantity tends to be significant.
B. Complete the diagrams below to explain and illustrate the effect of the imposition of a
tax on sugary drinks onequilibrium price and quantity in two cases: when the elasticity
of demand for sugary drinks is
I. relatively inelastic.
II. relatively elastic.
An example of inelastic demand is shown on the left where it is visible that change in quantity
demanded tends to lower in comparison to the quantum of change in price. In this market, taxes
would not be a useful intervention as rising prices would not automatically resolve the issue and
hence government needs to spend the tax revenues on enhancing awareness campaigns. An
example of elastic demand is shown on the right where it is visible that change in quantity
demanded tends to higherin comparison to the quantum of change in price. In this market, taxes
would be a useful intervention as rising prices would automatically resolve the issue.
chevron_up_icon
1 out of 4
circle_padding
hide_on_mobile
zoom_out_icon
[object Object]