FIN 601 - Principles of Finance: Financial Analysis of GlaxoSmithKline
VerifiedAdded on 2022/09/01
|21
|3499
|17
Report
AI Summary
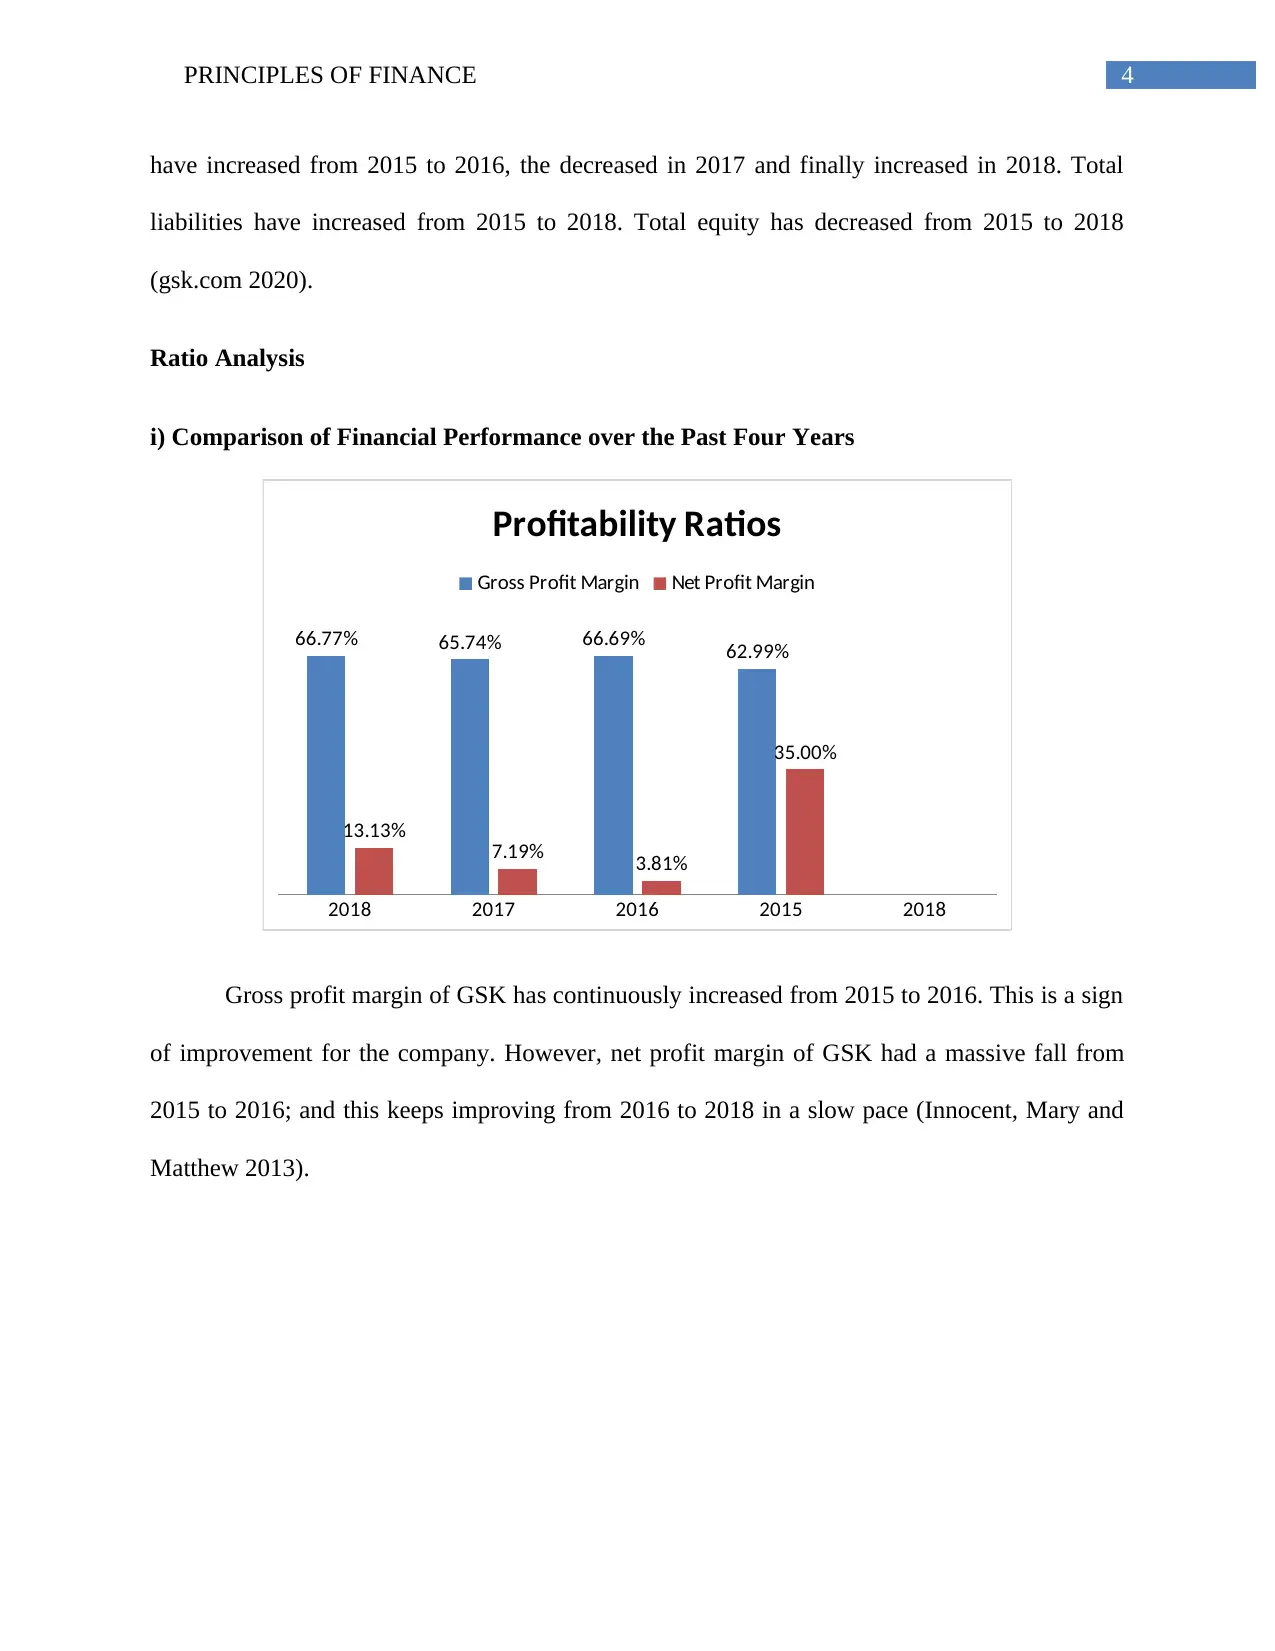
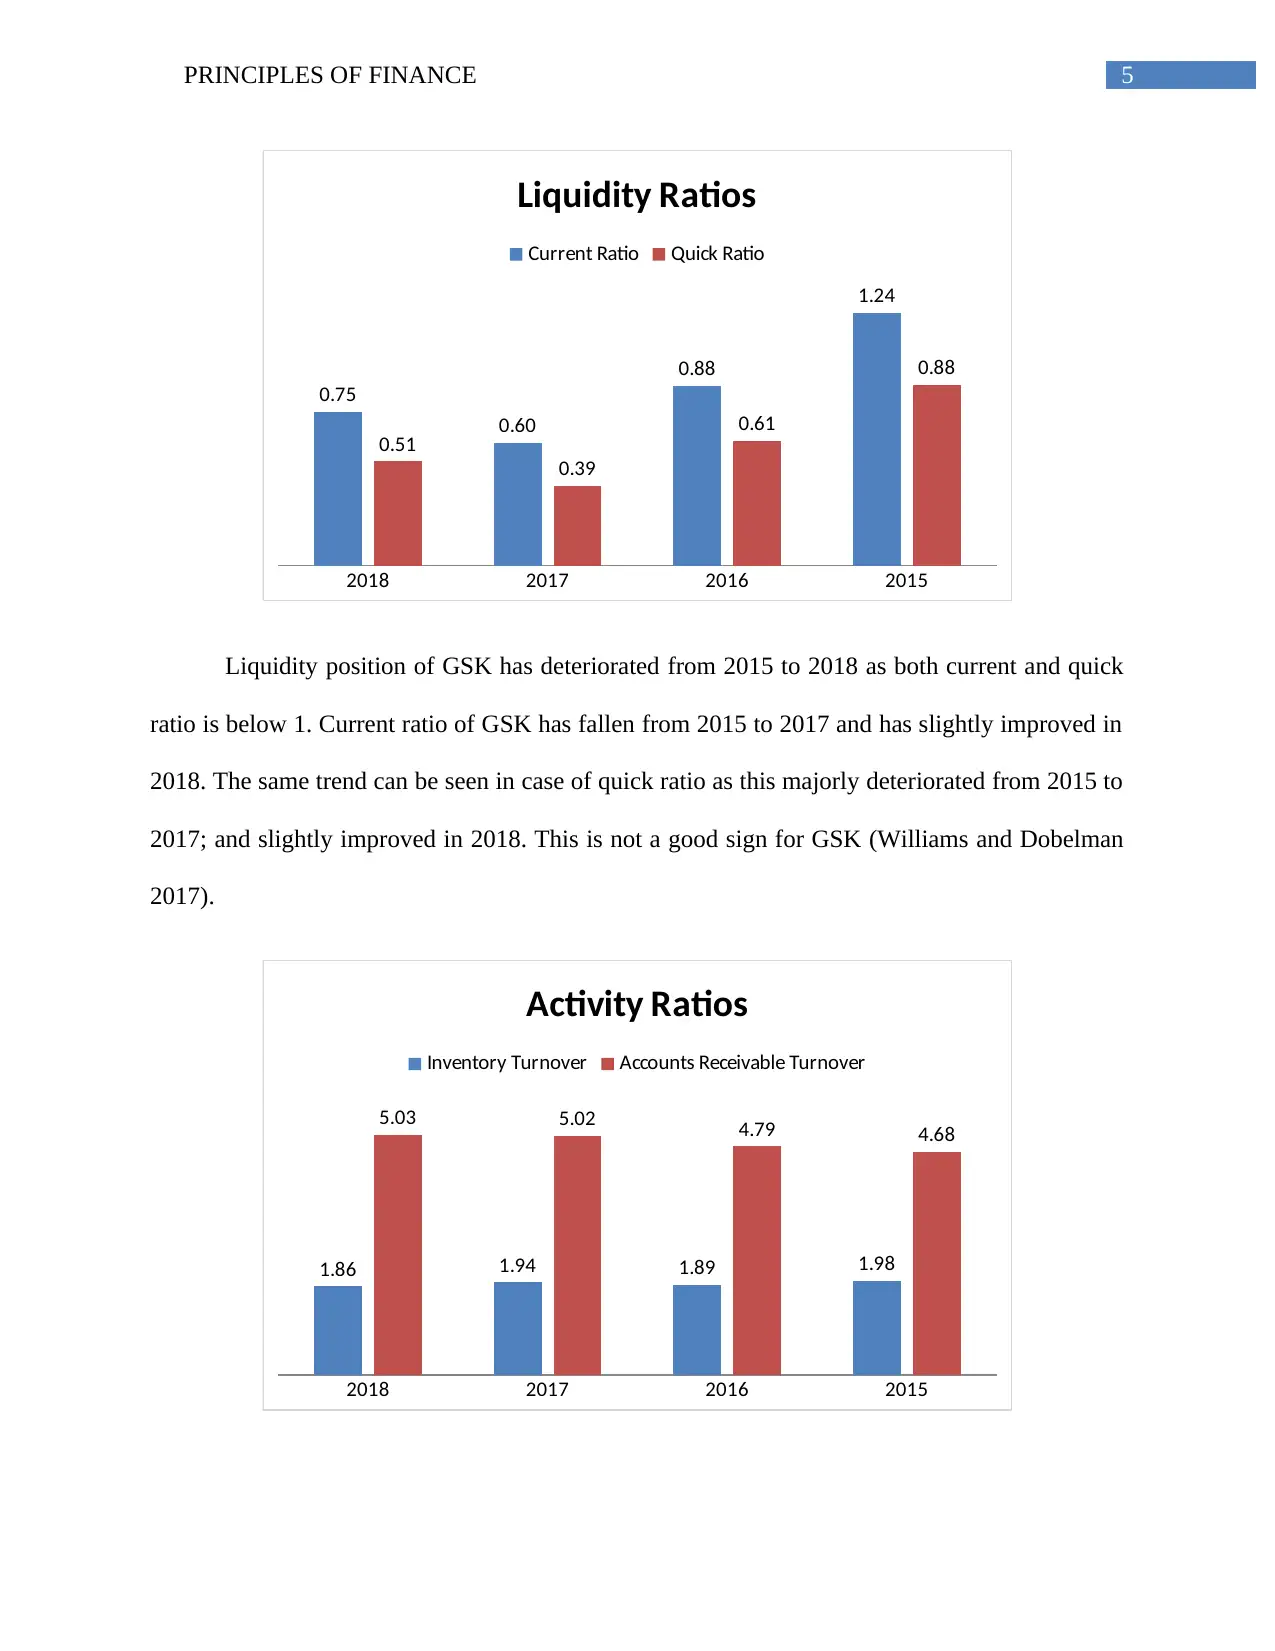
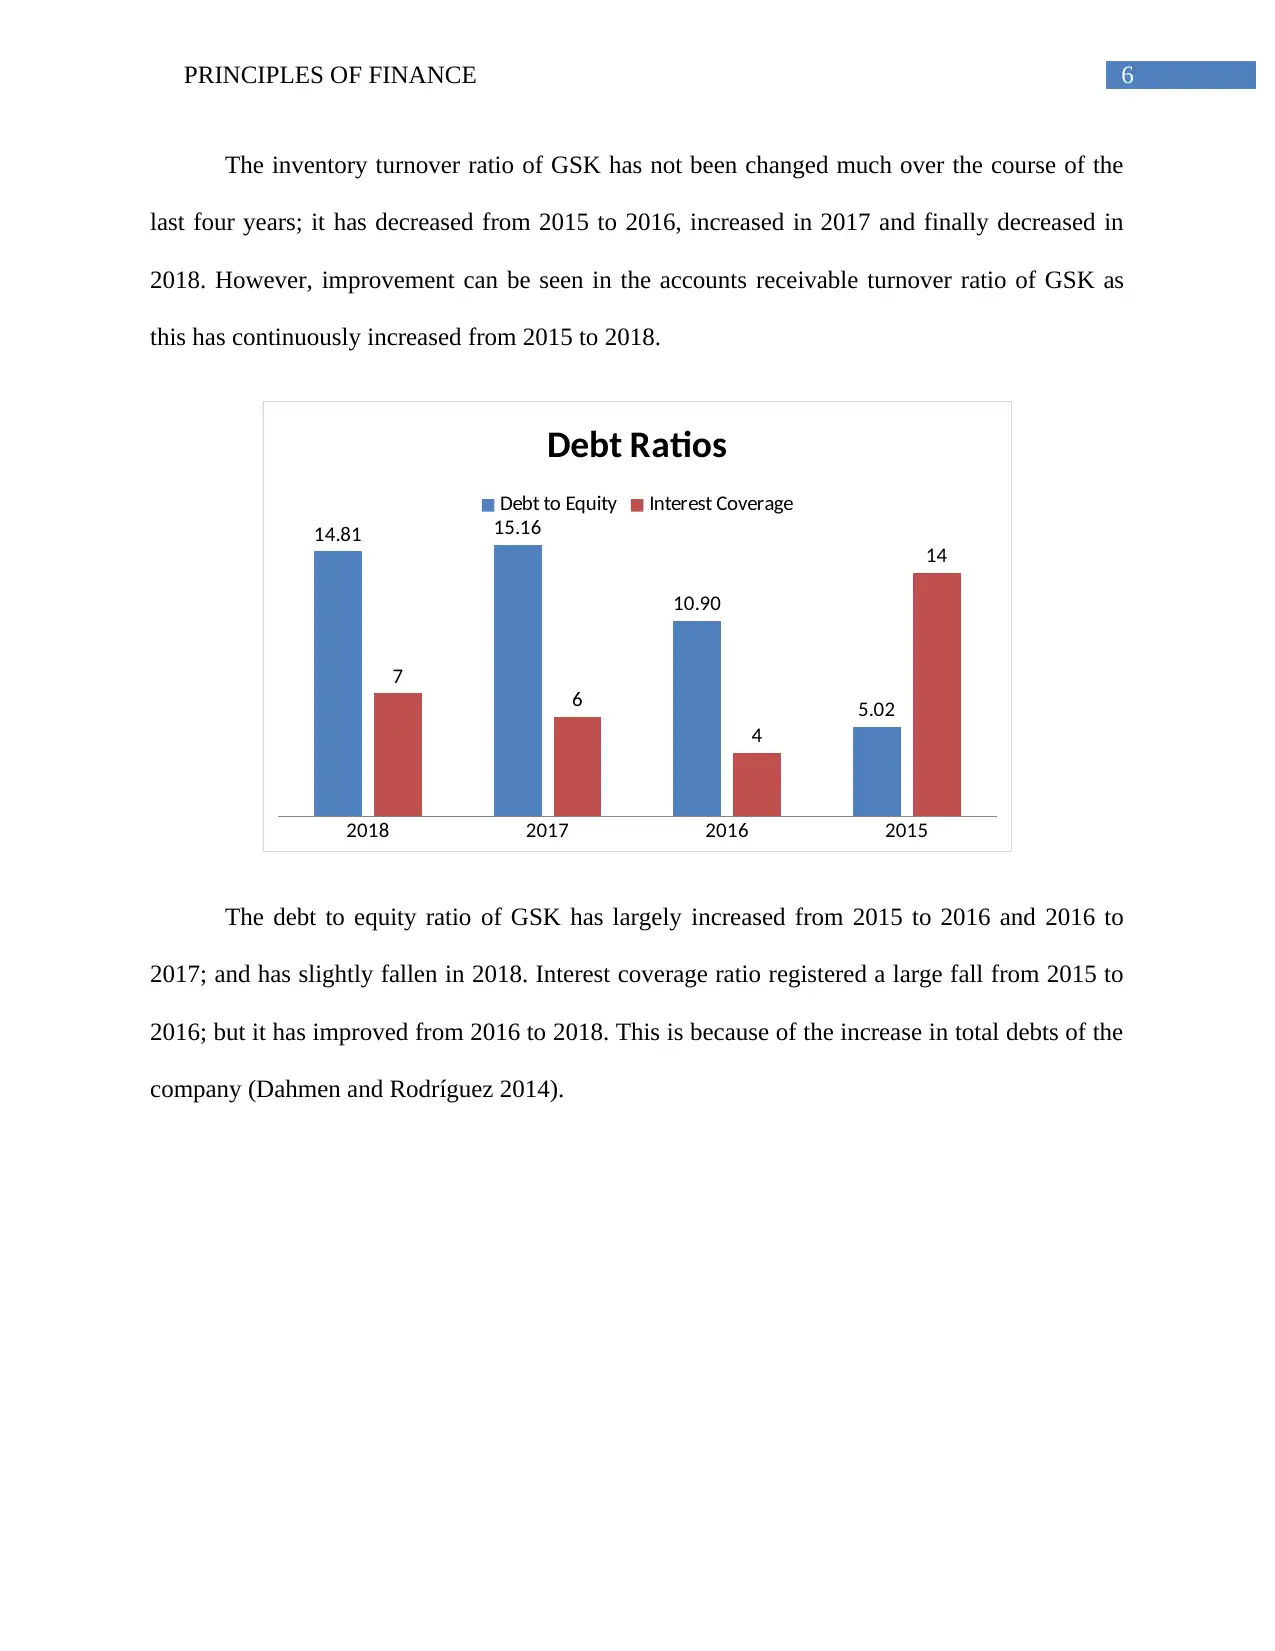
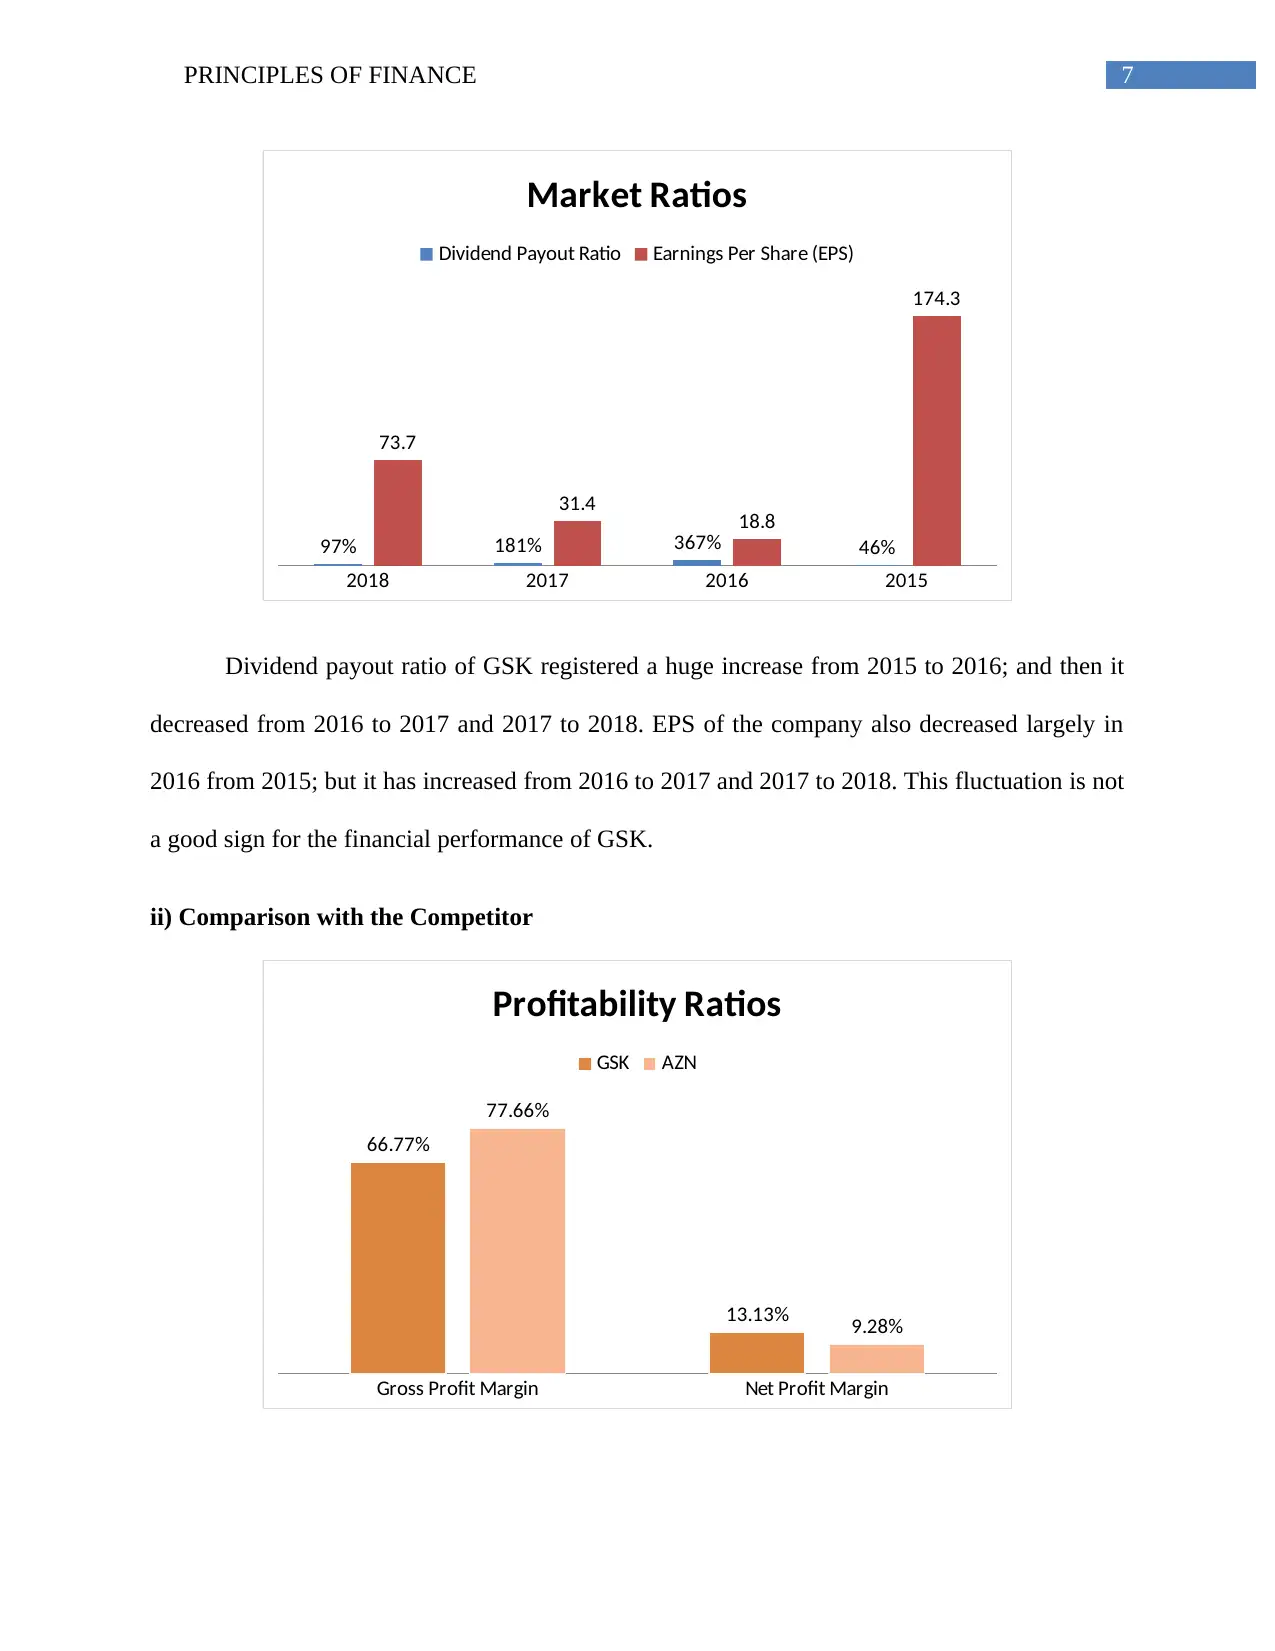
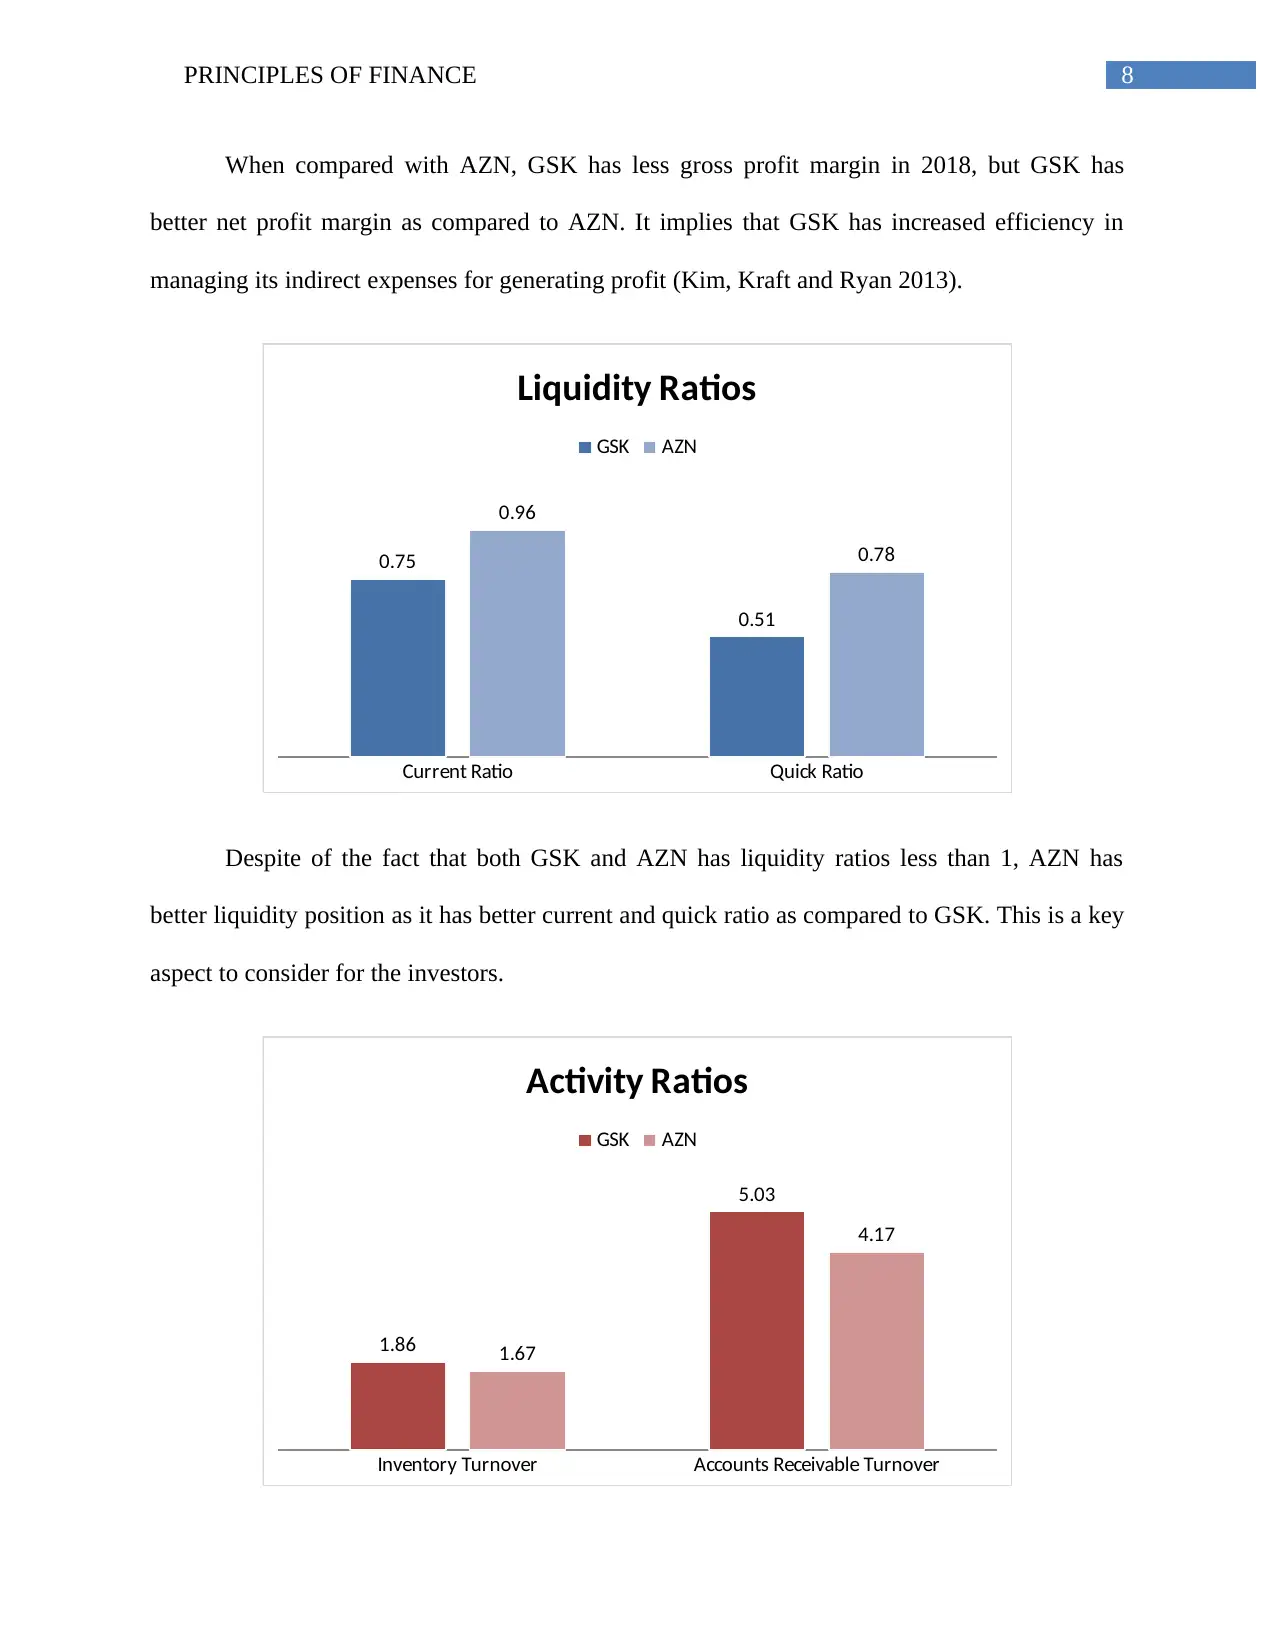
This report provides a comprehensive financial analysis of GlaxoSmithKline (GSK), a major multinational pharmaceutical company. It utilizes ratio analysis, including gross profit margin, net profit margin, current ratio, quick ratio, inventory turnover, accounts receivable turnover, and debt-to-equity ratio, to evaluate GSK's performance over a four-year period (2015-2018). The report compares GSK's financial health with its competitor AstraZeneca (AZN), highlighting key differences in profitability, liquidity, and debt management. Furthermore, trend analysis is employed to assess revenue, cost of sales, operating income, and net profit trends. The analysis reveals GSK's strengths and weaknesses, offering an investor's perspective and concluding with recommendations to enhance future financial performance, such as improving liquidity and managing debt. The report also acknowledges the limitations of ratio and trend analysis, considering factors like inflation and the aggregation of financial data.

Running head: PRINCIPLES OF FINANCE
Principles of Finance
Name of the Student
Name of the University
Author’s Note
Principles of Finance
Name of the Student
Name of the University
Author’s Note
Paraphrase This Document
Need a fresh take? Get an instant paraphrase of this document with our AI Paraphraser

1PRINCIPLES OF FINANCE
Table of Contents
Section A.........................................................................................................................................2
Introduction..................................................................................................................................3
Company Introduction and Overview of Financial Performance and Position...........................3
Ratio Analysis..............................................................................................................................4
i) Comparison of Financial Performance over the Past Four Years............................................4
ii) Comparison with the Competitor............................................................................................7
Trend Analysis...........................................................................................................................10
Comment on Business from Investors’ Perspective..................................................................11
Conclusion and Recommendation to Enhance Financial Performance in Future.....................12
Limitation of Analysis and Any Reservation............................................................................13
Conclusion.................................................................................................................................13
Section B........................................................................................................................................15
Problem 2...................................................................................................................................15
References......................................................................................................................................16
Appendix........................................................................................................................................18

2PRINCIPLES OF FINANCE
Section A
Executive Summary
Investors all over the world adopt different method, techniques and tools for analyzing the
financial statements of the business organizations so that they can assess the financial
performance and position of the firms. This helps in making investment decisions. This report
involves in applying ratio analysis and trend analysis for measuring the financial performance of
GlaxoSmithKline Plc. Findings of the report show that the company is a well-performing
company that is suitable for investing in.
⊘ This is a preview!⊘
Do you want full access?
Subscribe today to unlock all pages.

Trusted by 1+ million students worldwide

3PRINCIPLES OF FINANCE
Introduction
Assessment of the financial performance of the business organizations is a key technique
for analyzing the financial performance and financial position of those companies. Under this
technique, the key financial statements of the firms along with the notes to the financial
statements are taken into account by the investors and other stakeholders for the purpose of
analysis. Some major methods under this are the analysis of ratios, analysis of trends and others
since these methods help in assessing and comparing the companies’ performance with other
competitors and different timeline of the same companies. The aim of this report is the analysis
of the financial performance and position of GlaxoSmithKline Plc (GSK) through the analysis of
relevant ratios and trends. This also compared the financial performance of GSK with one of its
main competitors named AstraZeneca (AZN).
Company Introduction and Overview of Financial Performance and Position
GSK is one of the major multinational pharmaceutical companies of Britain that is
headquartered in Brentford, London. GSK operates in the pharmaceutical biotechnology
consumer goods industry; and the main products of the company are pharmaceuticals, vaccines,
nutritional products, oral healthcare and over the counter medicines. GSK is known as a science-
led global healthcare corporation with the purpose of helping people to do more, feel better and
live longer (gsk.com 2020).
GSK has performed well in terms of revenue as it has continuously increased from 2015
to 2018. Both operating profit and profit after taxation has decreased from 2015 to 2016; but
these have continuously increased from 2016 to 2018. EPS has improved from 2016 to 2018.
Major improvements can be seen in return on capital employed from 2016 to 2018. Total assets
Paraphrase This Document
Need a fresh take? Get an instant paraphrase of this document with our AI Paraphraser

4PRINCIPLES OF FINANCE
have increased from 2015 to 2016, the decreased in 2017 and finally increased in 2018. Total
liabilities have increased from 2015 to 2018. Total equity has decreased from 2015 to 2018
(gsk.com 2020).
Ratio Analysis
i) Comparison of Financial Performance over the Past Four Years
2018 2017 2016 2015 2018
66.77% 65.74% 66.69% 62.99%
13.13%
7.19% 3.81%
35.00%
Profitability Ratios
Gross Profit Margin Net Profit Margin
Gross profit margin of GSK has continuously increased from 2015 to 2016. This is a sign
of improvement for the company. However, net profit margin of GSK had a massive fall from
2015 to 2016; and this keeps improving from 2016 to 2018 in a slow pace (Innocent, Mary and
Matthew 2013).

5PRINCIPLES OF FINANCE
2018 2017 2016 2015
0.75
0.60
0.88
1.24
0.51
0.39
0.61
0.88
Liquidity Ratios
Current Ratio Quick Ratio
Liquidity position of GSK has deteriorated from 2015 to 2018 as both current and quick
ratio is below 1. Current ratio of GSK has fallen from 2015 to 2017 and has slightly improved in
2018. The same trend can be seen in case of quick ratio as this majorly deteriorated from 2015 to
2017; and slightly improved in 2018. This is not a good sign for GSK (Williams and Dobelman
2017).
2018 2017 2016 2015
1.86 1.94 1.89 1.98
5.03 5.02 4.79 4.68
Activity Ratios
Inventory Turnover Accounts Receivable Turnover
2018 2017 2016 2015
0.75
0.60
0.88
1.24
0.51
0.39
0.61
0.88
Liquidity Ratios
Current Ratio Quick Ratio
Liquidity position of GSK has deteriorated from 2015 to 2018 as both current and quick
ratio is below 1. Current ratio of GSK has fallen from 2015 to 2017 and has slightly improved in
2018. The same trend can be seen in case of quick ratio as this majorly deteriorated from 2015 to
2017; and slightly improved in 2018. This is not a good sign for GSK (Williams and Dobelman
2017).
2018 2017 2016 2015
1.86 1.94 1.89 1.98
5.03 5.02 4.79 4.68
Activity Ratios
Inventory Turnover Accounts Receivable Turnover
⊘ This is a preview!⊘
Do you want full access?
Subscribe today to unlock all pages.

Trusted by 1+ million students worldwide

6PRINCIPLES OF FINANCE
The inventory turnover ratio of GSK has not been changed much over the course of the
last four years; it has decreased from 2015 to 2016, increased in 2017 and finally decreased in
2018. However, improvement can be seen in the accounts receivable turnover ratio of GSK as
this has continuously increased from 2015 to 2018.
2018 2017 2016 2015
14.81 15.16
10.90
5.02
7
6
4
14
Debt Ratios
Debt to Equity Interest Coverage
The debt to equity ratio of GSK has largely increased from 2015 to 2016 and 2016 to
2017; and has slightly fallen in 2018. Interest coverage ratio registered a large fall from 2015 to
2016; but it has improved from 2016 to 2018. This is because of the increase in total debts of the
company (Dahmen and Rodríguez 2014).
Paraphrase This Document
Need a fresh take? Get an instant paraphrase of this document with our AI Paraphraser

7PRINCIPLES OF FINANCE
2018 2017 2016 2015
97% 181% 367% 46%
73.7
31.4 18.8
174.3
Market Ratios
Dividend Payout Ratio Earnings Per Share (EPS)
Dividend payout ratio of GSK registered a huge increase from 2015 to 2016; and then it
decreased from 2016 to 2017 and 2017 to 2018. EPS of the company also decreased largely in
2016 from 2015; but it has increased from 2016 to 2017 and 2017 to 2018. This fluctuation is not
a good sign for the financial performance of GSK.
ii) Comparison with the Competitor
Gross Profit Margin Net Profit Margin
66.77%
13.13%
77.66%
9.28%
Profitability Ratios
GSK AZN

8PRINCIPLES OF FINANCE
When compared with AZN, GSK has less gross profit margin in 2018, but GSK has
better net profit margin as compared to AZN. It implies that GSK has increased efficiency in
managing its indirect expenses for generating profit (Kim, Kraft and Ryan 2013).
Current Ratio Quick Ratio
0.75
0.51
0.96
0.78
Liquidity Ratios
GSK AZN
Despite of the fact that both GSK and AZN has liquidity ratios less than 1, AZN has
better liquidity position as it has better current and quick ratio as compared to GSK. This is a key
aspect to consider for the investors.
Inventory Turnover Accounts Receivable Turnover
1.86
5.03
1.67
4.17
Activity Ratios
GSK AZN
⊘ This is a preview!⊘
Do you want full access?
Subscribe today to unlock all pages.

Trusted by 1+ million students worldwide

9PRINCIPLES OF FINANCE
GSK has turned over its inventory more time than AZN as the inventory which indicate
efficient management of inventory by GSK as compared to AZN. Since GSK has better accounts
receivable turnover ratio that AZN, this means GSK has been able in collecting the dues from the
debtors more time than AZN (Delen, Kuzey and Uyar 2013).
Debt to Equity Interest Coverage
15
7
3 2
Debt Ratios
GSK AZN
Higher debt ratio of GSK implies the presence of more debt capital in its capital structure
as compared to AZN. For this reason, interest coverage ratio of GSK is also more than AZN.
This is a negative aspect for GSK.
Paraphrase This Document
Need a fresh take? Get an instant paraphrase of this document with our AI Paraphraser

10PRINCIPLES OF FINANCE
Dividend Payout Ratio Earnings Per Share (EPS)
1.0
73.7
2
170
Market Ratios
GSK AZN
GSK has lower dividend payout ratio than AZN which indicates towards the payment of
less dividend to the shareholders than AZN. EPS of GSK is also less than AZN in 2018 (Kim,
Kraft and Ryan 2013).
Trend Analysis
The result of the trend analysis shows that the revenue of GSK has increased from 2015
to 2018, but the rate of increase in revenue has decreased almost at a double rate from 2015 to
2016, 2016 to 2017 and 2017 to 2018; and this is a sign of worry for the company. Another
worrisome matter is the large increase in cost of sales from 2015 to 2017; 2018 has witnessed a
little drop in cost of sales but the prior large increase cancels out this small fall (Balarabe,
Abdullah and Nawawi 2015). Through gross profit of GSK has increased from 2015 to 2016, but
the growth rate has fallen from 23.42% in 2015-2016 to 3.71% in 2017-2018; and his is mainly
because of the large increase in cost of sales and show increase in sales. Selling and
administrative expenses have increased 2015 to 2018; and research and development related
expenses have decreased in 2018. There is a large fall in the operating income of GSK from 2015

11PRINCIPLES OF FINANCE
to 2018; and the growth rate has also decreased from 2016-2017 to 2017-2018. Finance expenses
have increased from 2015 to 2018. Profit before taxation of GSK has largely decreased from
2015 to 2016, but it has improved from 2016 to 2018. There is a decrease in tax payments
because of the decrease in net income before tax. Most importantly, net profit of GSK has largely
decreased from 2015 to 2018. Trend shows a decrease from 2015 to 2016 and then gradual
improvement in 2017 and 2018 (Harvey 2014).
Comment on Business from Investors’ Perspective
Increase in gross profit margin of GSK means increase in sales and effective
managements of materials and labors. Net profit ratio trend also shows that this ratio of GSK is
improving in the current years and it is a positive sign; and it implies effective management of
direct and indirect costs for increasing profit. Increase in profitability always attracts the
investors. However, GSK has poor liquidity position in the recent years. As per the movements
in current and quick ratio, GSK does not have adequate current and quick assets for paying off
the current business obligations. This is a key negative aspect for investing in GSK. This affects
the company’s ability to pay the short-term loans (Penman 2013).
Inventory turnover of GSK has been stable over the last four years and the result of AZN
shows that this is the average industry standard for GSK. One positive aspect is that accounts
receivable turnover has improved in 2018 that depicts the enhanced efficiency of GSK in
extending credit and collecting the dues from the debtors. However, recent trend in debt to equity
ratio of GSK shows the use of huge debt capital by the company to raise the required capital for
business. This increases the payment of interest which can be seen from the increase in interest
coverage ratio in current years. However, this also indicates the need for more capital of GSK to
⊘ This is a preview!⊘
Do you want full access?
Subscribe today to unlock all pages.

Trusted by 1+ million students worldwide
1 out of 21
Related Documents

Your All-in-One AI-Powered Toolkit for Academic Success.
+13062052269
info@desklib.com
Available 24*7 on WhatsApp / Email
Unlock your academic potential
Copyright © 2020–2025 A2Z Services. All Rights Reserved. Developed and managed by ZUCOL.