Probability Assignment: Statistical Analysis, Regression, and Poisson

Verified

Added on  2021/06/17

|10
|636
|148
Homework Assignment
AI Summary
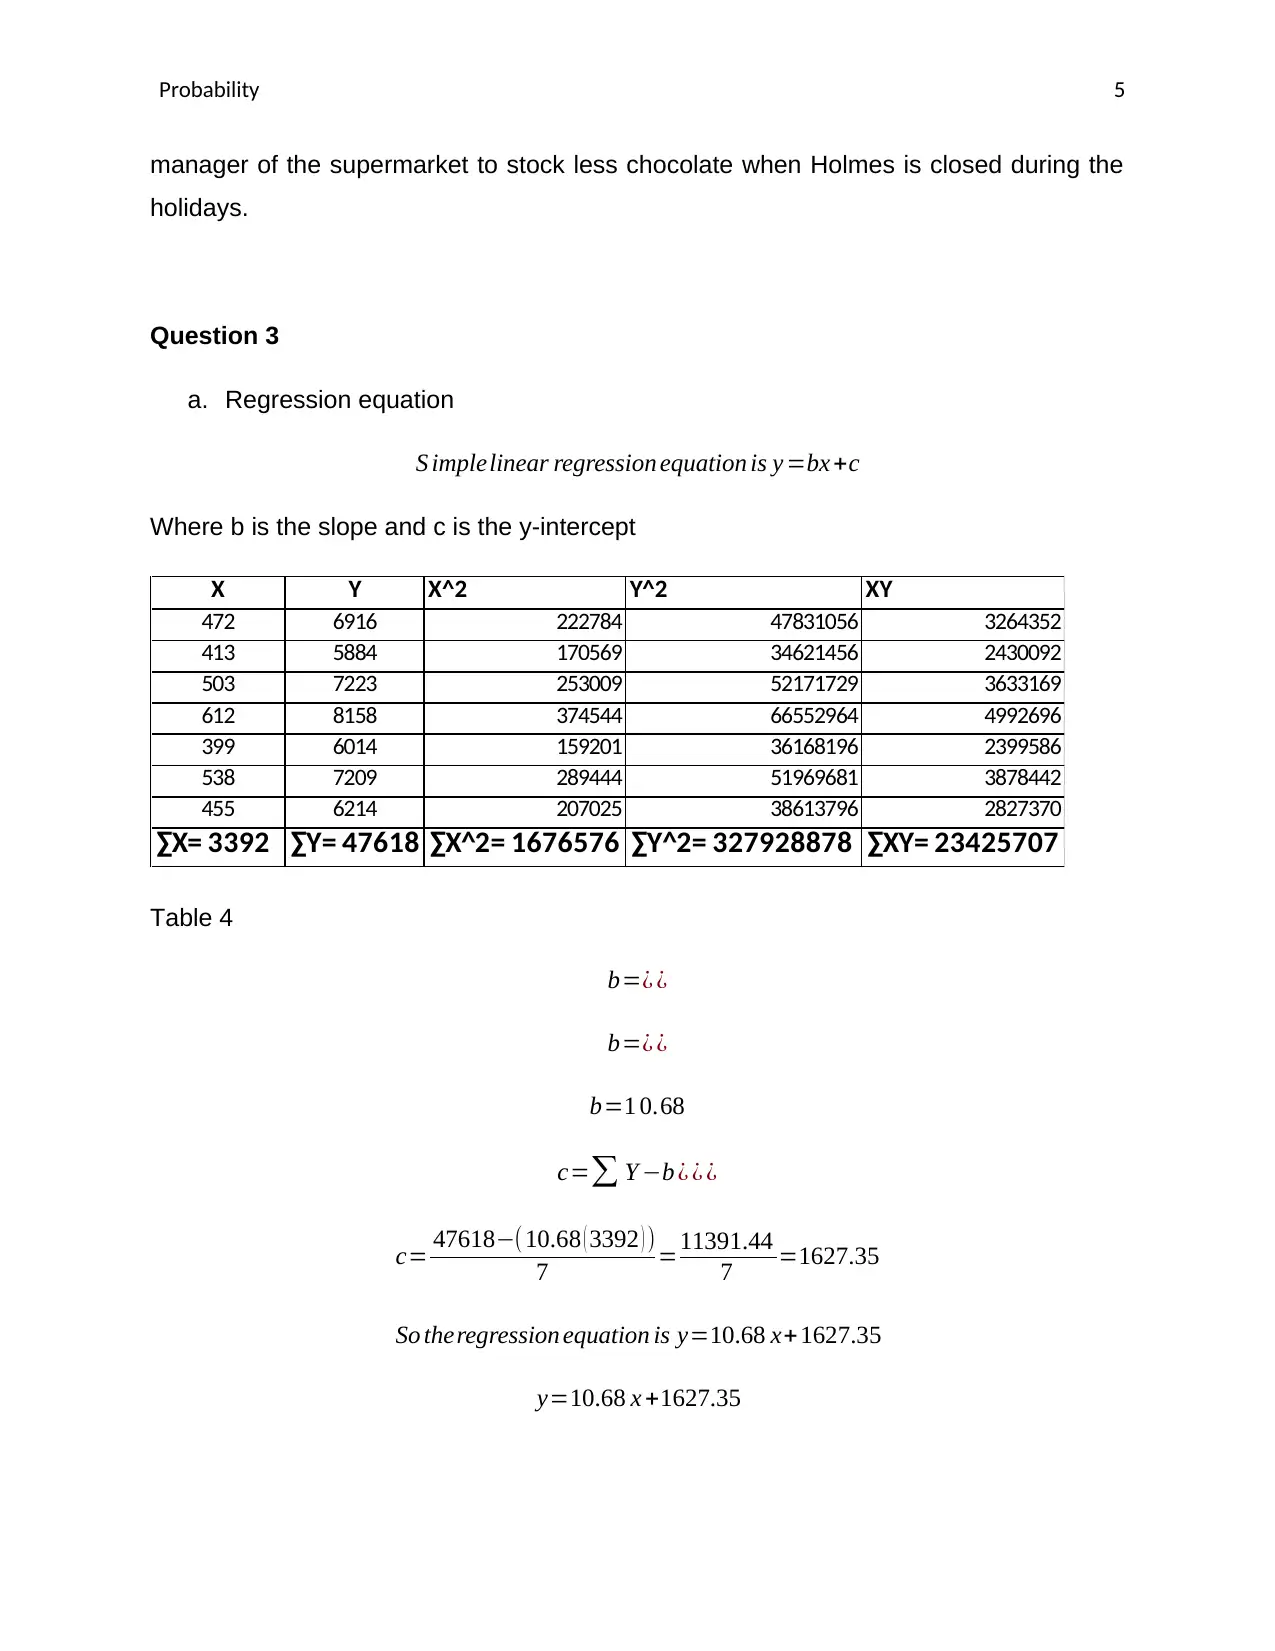
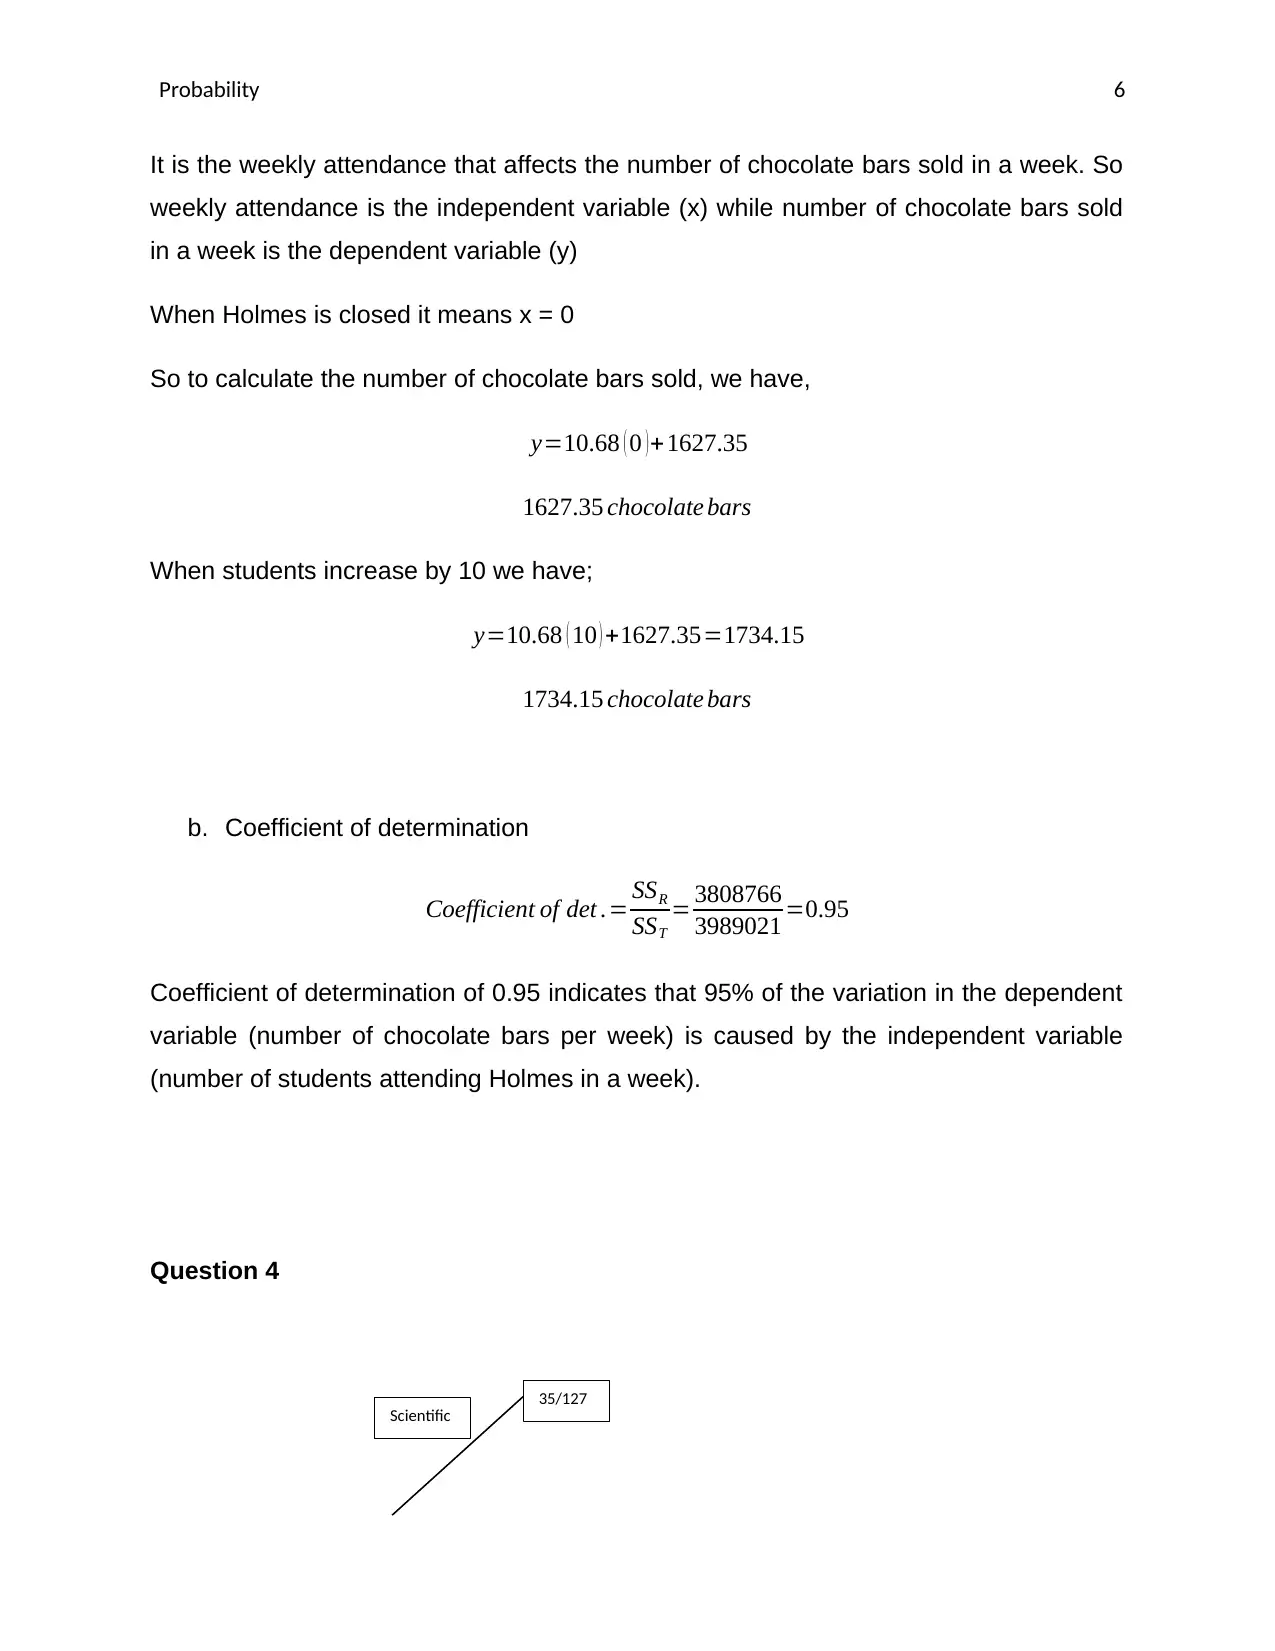
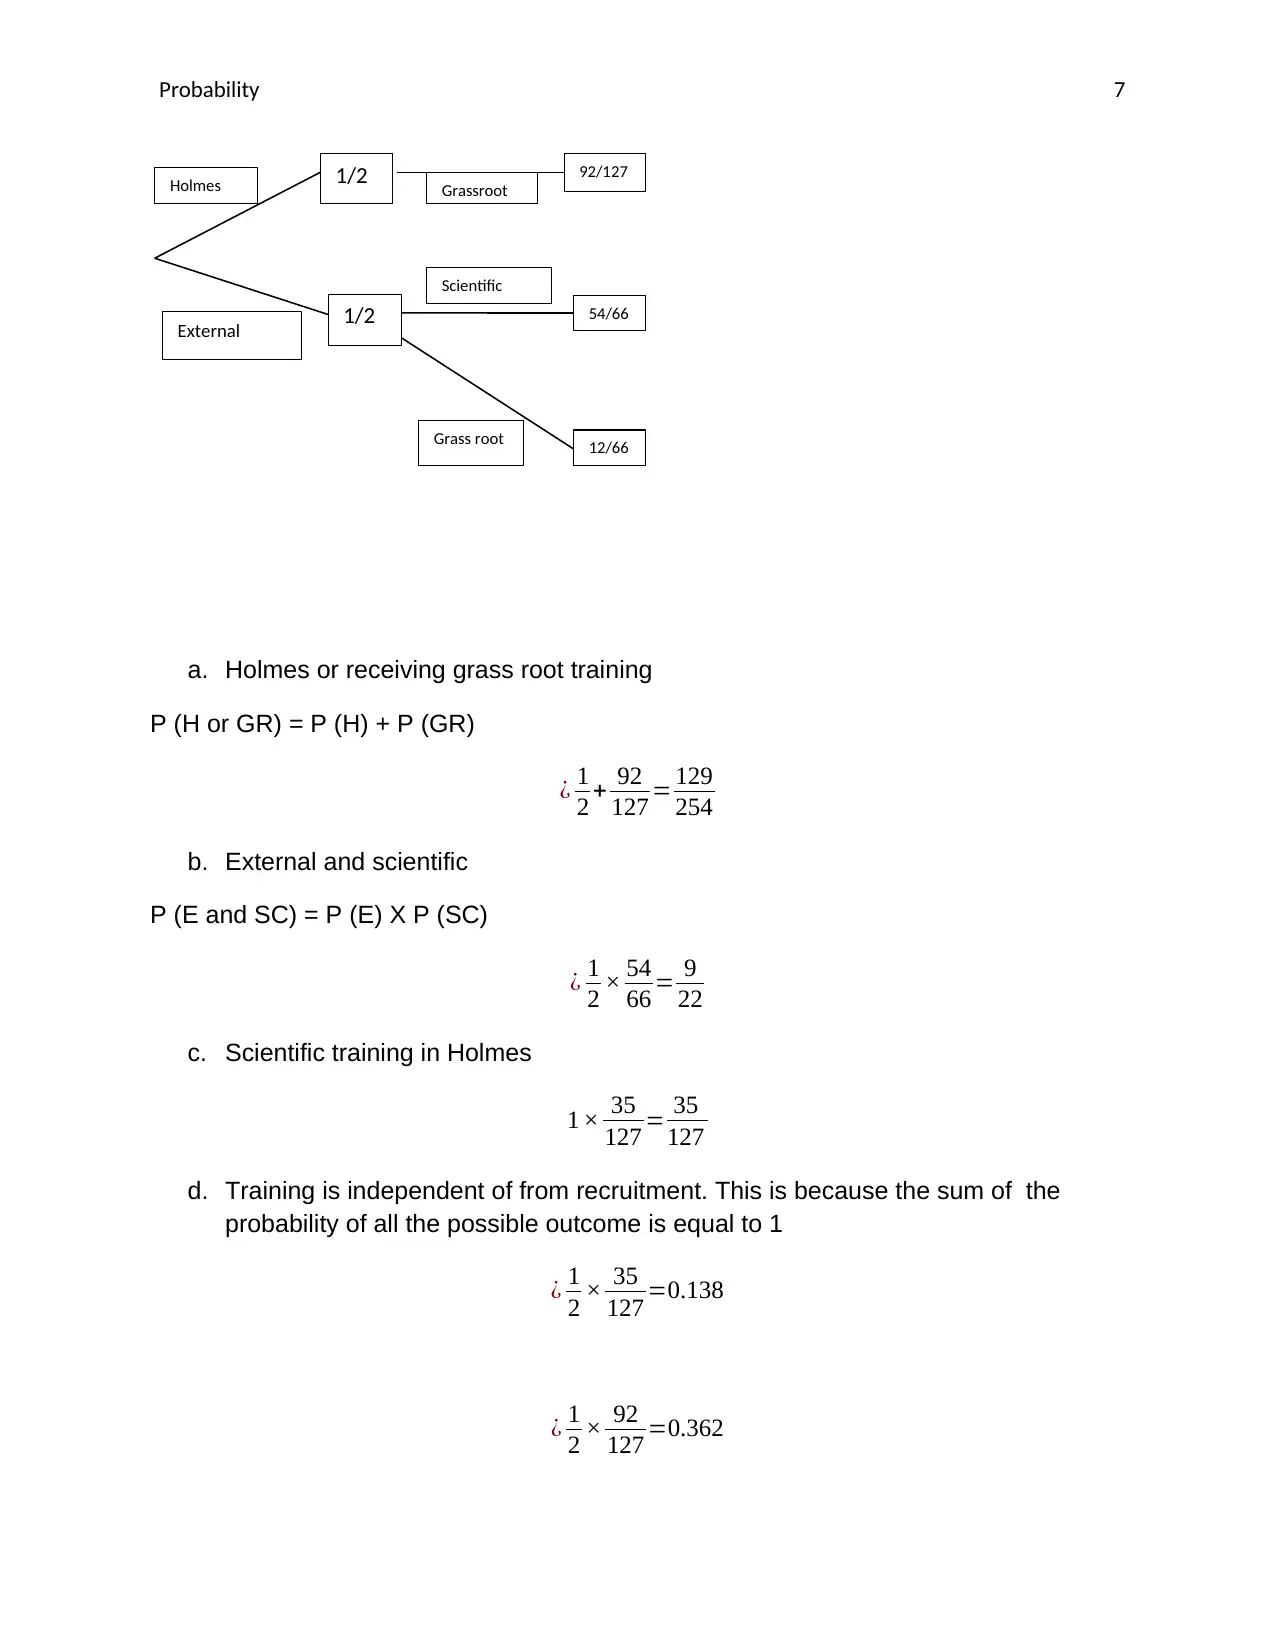
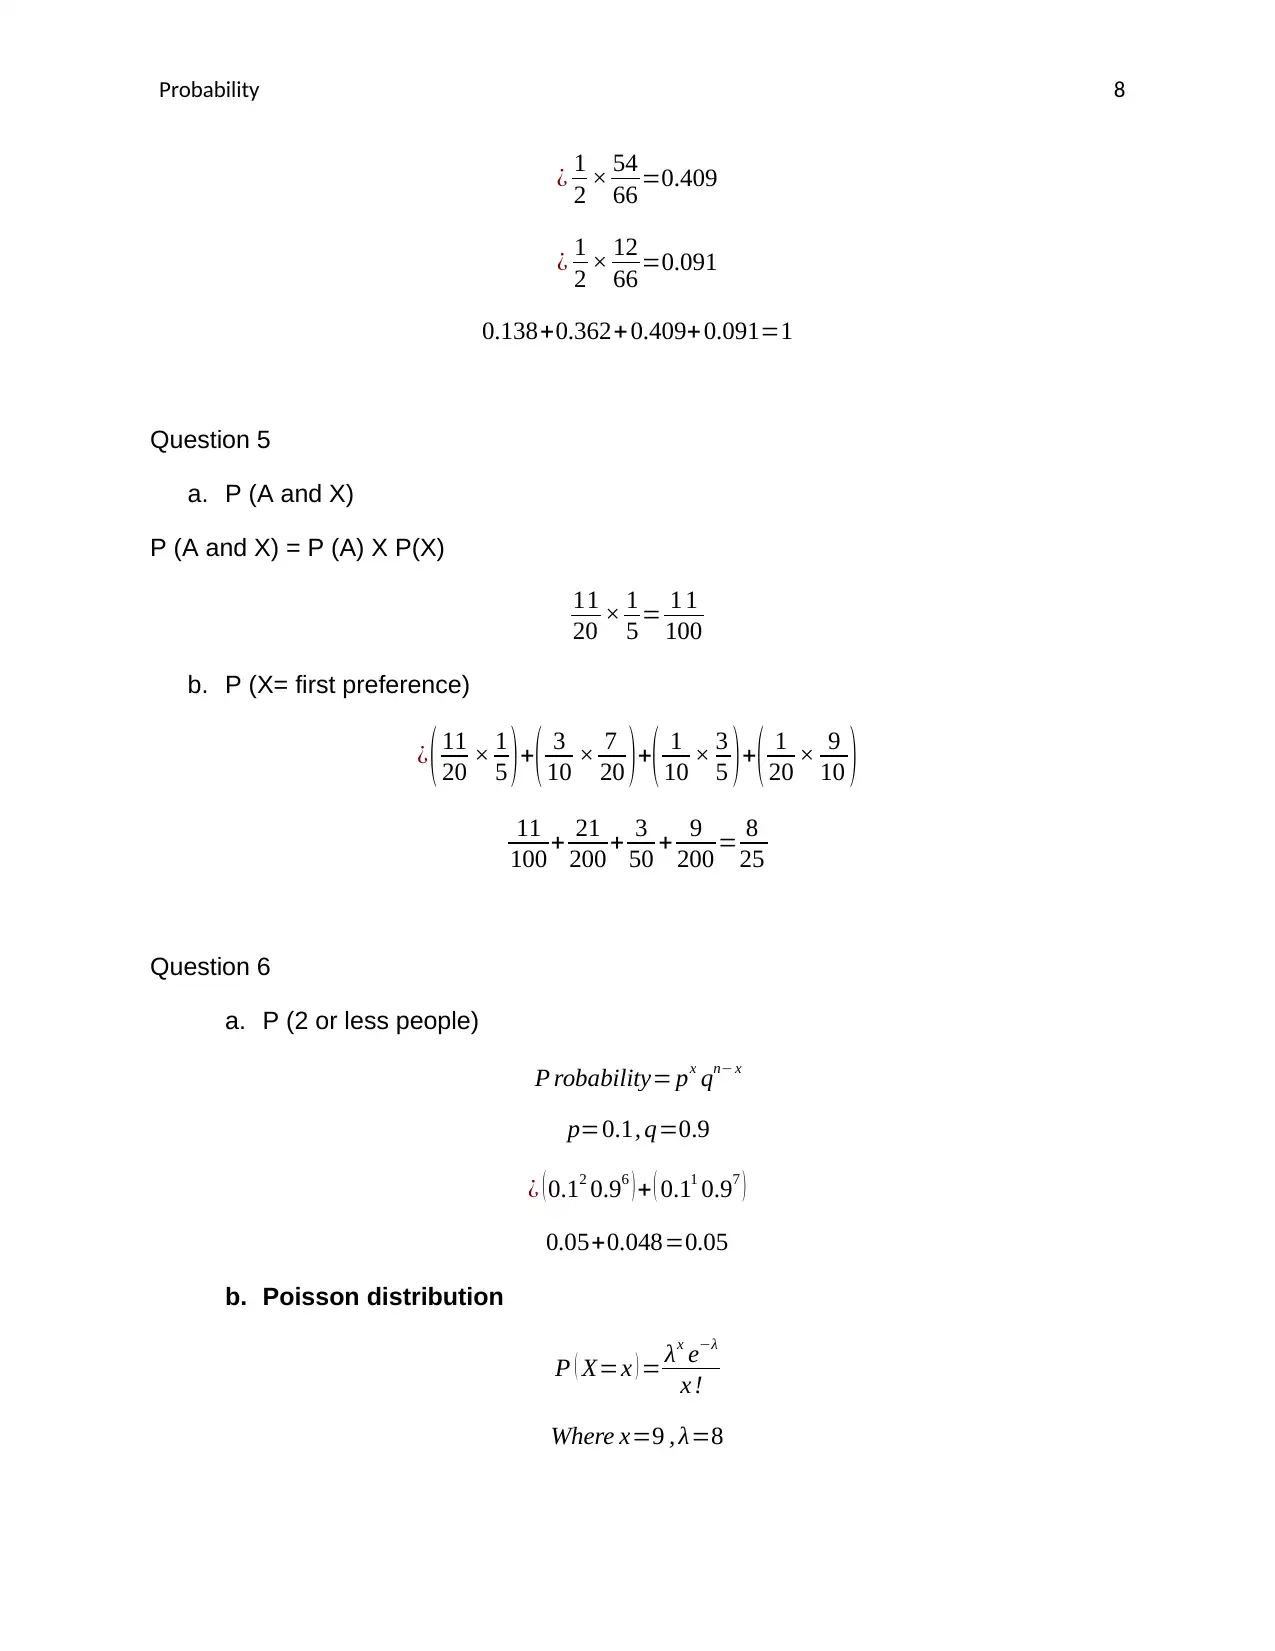
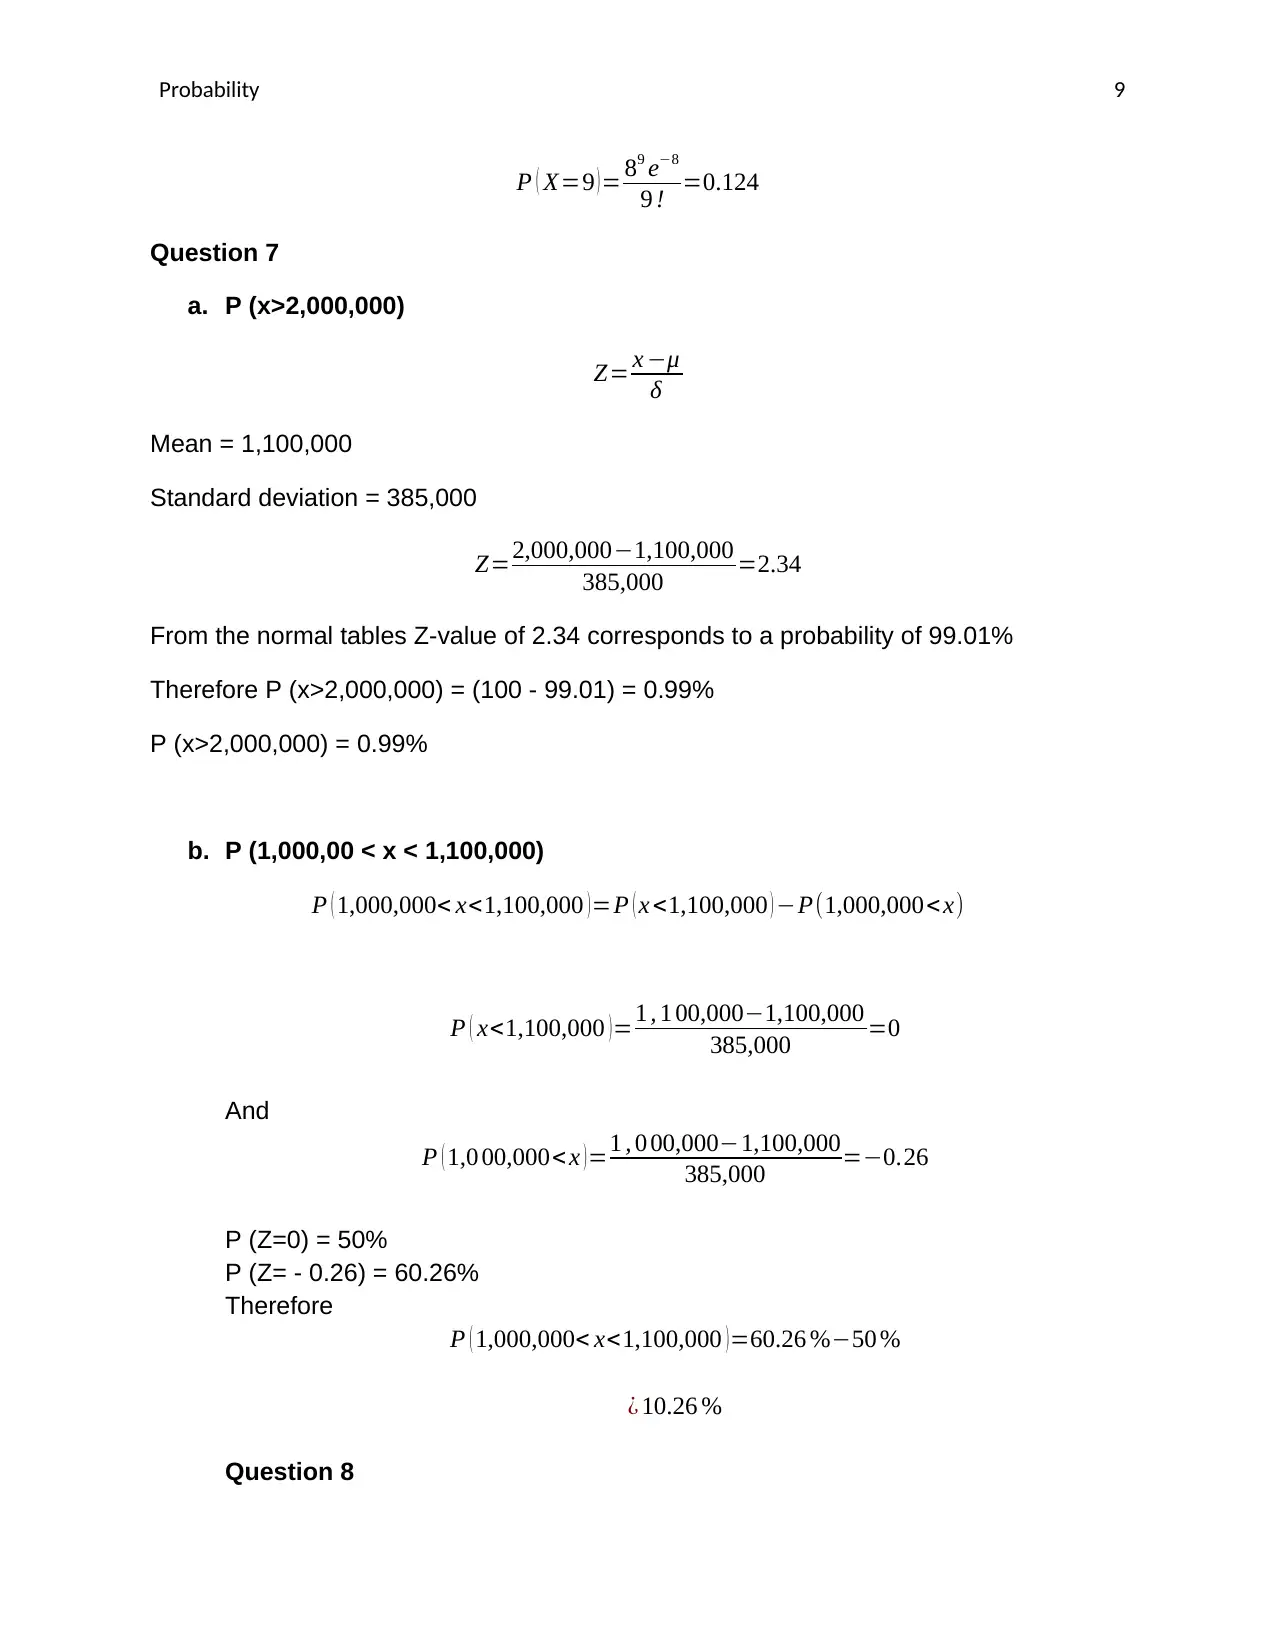
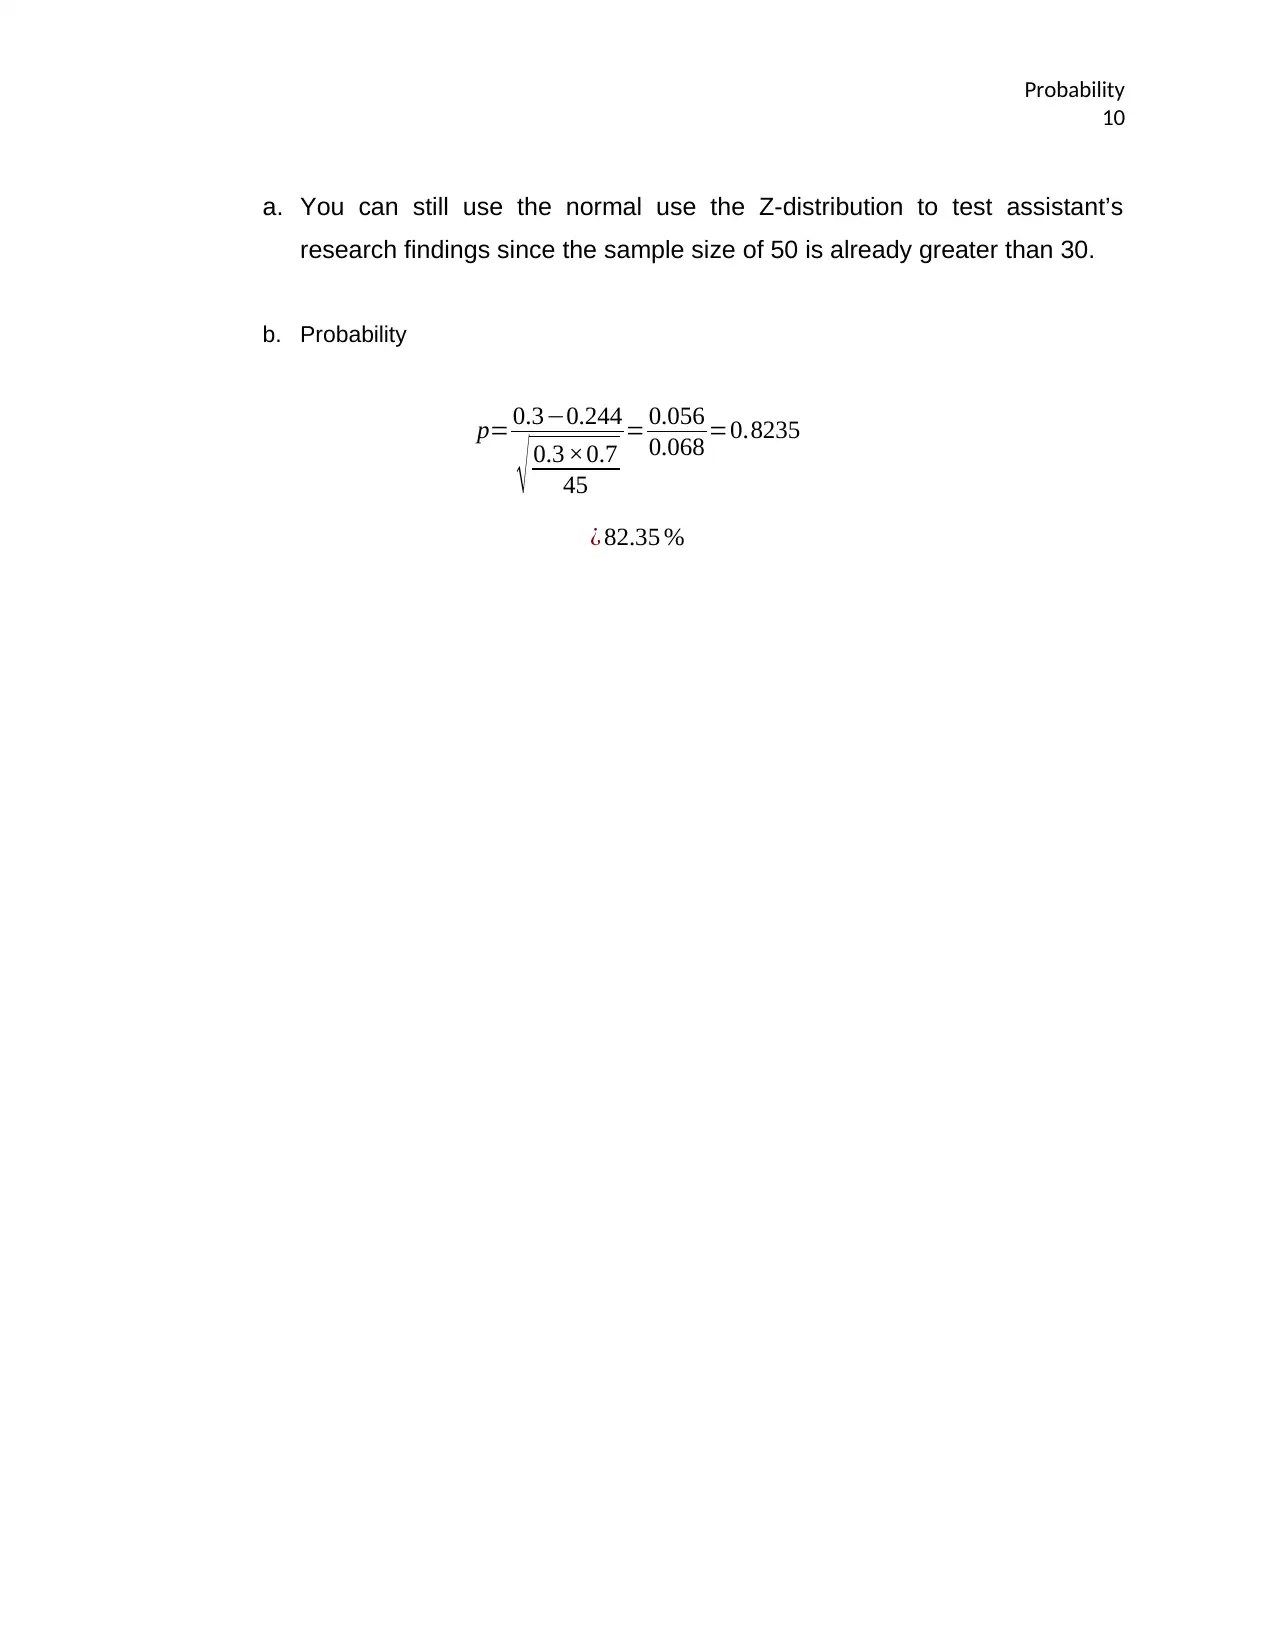
This assignment solution covers a range of probability and statistical concepts. It begins with a frequency distribution table and histogram, followed by measures of central tendency, including quartiles and the correlation coefficient. The assignment then delves into regression analysis, establishing a regression equation, and interpreting the coefficient of determination. Further, it explores probability calculations, including conditional probability and the application of the Poisson distribution. The solution also addresses the normal distribution and the use of Z-scores. The document provides detailed explanations and calculations for each problem, offering a comprehensive understanding of the concepts discussed.
Document Page
Probability 1
Name:
Tutor
Institution:
Course
Date
tabler-icon-diamond-filled.svg

Secure Best Marks with AI Grader

Need help grading? Try our AI Grader for instant feedback on your assignments.
Document Page
Probability 2
Question 1
a. Frequency distribution table
CLASS MID-POINT FREQUENCY RELATIVE FREQ. CUM. FREQUENCY CUM. REL. FREQ
169 - 925 547 35 0.583 35 0.58
926 - 1682 1303 18 0.3 53 0.88
1683 - 2439 2061 3 0.05 56 0.93
2440 - 3196 2818 3 0.05 59 0.98
3197 - 3953 3575 0 0 59 0.98
3954 - 4710 4332 0 0 59 0.98
4711 - 5467 5089 0 0 59 0.98
5468 - 6224 5846 0 0 59 0.98
6225 - 6981 6603 0 0 59 0.98
6982 - 7738 7360 1 0.016 60 1
Table 1
b. Histogram
169 -
925 926 -
1682 1683 -
2439 2440 -
3196 3197 -
3953 3954 -
4710 4711 -
5467 5468 -
6224 6225 -
6981 6982 -
7738
0
5
10
15
20
25
30
35
40
Histogram
Class
Frequency
Figure 1
Document Page
Probability 3
c. Measures of central tendency
Mean 1033.433333
Median 715
Mode 401
Measures of central tendency
Table 2
Question 2
a. The above is a sample and not a population. A population refers to the entire
largest set of items that a study is interested in while a sample is a subset of a
population.
b. Standard deviation
standard deviation=
i=1
n
¿ ¿ ¿ ¿
mean , μ ,= 472+413+503+ 612+399+ 538+455
7 = 3392
7 =484.57
¿ ¿
22.57+731.75+ 48.52+2319.77+1046.03+407.82+124.91=4701.38
4701.38=68.57
standard deviation=68.57
c. Interquartile range
Interquartile range=upper quartilelower quartile
Lower quartile=( 1
4 × 7 ) position=1.75
Therefore the lower quartile is in 1.75th position after arranging the data in order from the
smallest to the largest.
Document Page
Probability 4
5884, 6014, 6214, 6916, 7209, 7223, 8158
1.75th position is between 5884 and 6014, thus 1st quartile = (5884 +6014)/2
Lower quartile=5884 +6014
2 =5949
Upper quartile=( 3
4 × 7 ) position=5.25
Therefore the upper quartile is in 5.25th position after arranging the data in order from
the smallest to the largest.
5884, 6014, 6214, 6916, 7209, 7223, 8158
5.25th position is between 7209 and 7223, thus 3rd quartile = (7209 +7223)/2
Upper quartile=7209+ 7223
2 =7216
Interquartile range=upper quartilelower quartile
Interquartile range=72165949=1267
Interquartile range=1267
d. Correlation coefficient
From excel output we have,
Weekly attendance No. of chocolate bars sold
Weekly attendance 1
No. of chocolate bars sold 0.977144848 1
Table 3
It can be observed that the correlation coefficient between number of chocolate bars
sold per week and weekly attendance is 0.98. This indicates that the two variables are
highly correlated. This indicates that more chocolate bars are sold when more Holmes
students attend classes and the converse is also true. It is therefore advisable for the
tabler-icon-diamond-filled.svg

Secure Best Marks with AI Grader

Need help grading? Try our AI Grader for instant feedback on your assignments.
Document Page
Probability 5
manager of the supermarket to stock less chocolate when Holmes is closed during the
holidays.
Question 3
a. Regression equation
S implelinear regression equation is y =bx +c
Where b is the slope and c is the y-intercept
X Y X^2 Y^2 XY
472 6916 222784 47831056 3264352
413 5884 170569 34621456 2430092
503 7223 253009 52171729 3633169
612 8158 374544 66552964 4992696
399 6014 159201 36168196 2399586
538 7209 289444 51969681 3878442
455 6214 207025 38613796 2827370
∑X= 3392 ∑Y= 47618 ∑X^2= 1676576 ∑Y^2= 327928878 ∑XY= 23425707
Table 4
b=¿ ¿
b=¿ ¿
b=1 0.68
c= Y b ¿ ¿ ¿
c= 47618(10.68 ( 3392 ) )
7 =11391.44
7 =1627.35
So theregression equation is y=10.68 x+ 1627.35
y=10.68 x +1627.35
Document Page
Probability 6
It is the weekly attendance that affects the number of chocolate bars sold in a week. So
weekly attendance is the independent variable (x) while number of chocolate bars sold
in a week is the dependent variable (y)
When Holmes is closed it means x = 0
So to calculate the number of chocolate bars sold, we have,
y=10.68 ( 0 ) +1627.35
1627.35 chocolate bars
When students increase by 10 we have;
y=10.68 ( 10 ) +1627.35=1734.15
1734.15 chocolate bars
b. Coefficient of determination
Coefficient of det .= SSR
SST
= 3808766
3989021 =0.95
Coefficient of determination of 0.95 indicates that 95% of the variation in the dependent
variable (number of chocolate bars per week) is caused by the independent variable
(number of students attending Holmes in a week).
Question 4
35/127
Scientific
Document Page
Probability 7
a. Holmes or receiving grass root training
P (H or GR) = P (H) + P (GR)
¿ 1
2 + 92
127 = 129
254
b. External and scientific
P (E and SC) = P (E) X P (SC)
¿ 1
2 × 54
66 = 9
22
c. Scientific training in Holmes
1 × 35
127 = 35
127
d. Training is independent of from recruitment. This is because the sum of the
probability of all the possible outcome is equal to 1
¿ 1
2 × 35
127 =0.138
¿ 1
2 × 92
127 =0.362
1/2
1/2
Holmes
External
92/127
54/66
12/66
Grassroot
Scientific
Grass root
tabler-icon-diamond-filled.svg

Paraphrase This Document

Need a fresh take? Get an instant paraphrase of this document with our AI Paraphraser
Document Page
Probability 8
¿ 1
2 × 54
66 =0.409
¿ 1
2 × 12
66 =0.091
0.138+0.362+ 0.409+ 0.091=1
Question 5
a. P (A and X)
P (A and X) = P (A) X P(X)
11
20 × 1
5 = 1 1
100
b. P (X= first preference)
¿ ( 11
20 × 1
5 )+( 3
10 × 7
20 )+( 1
10 × 3
5 )+( 1
20 × 9
10 )
11
100 + 21
200 + 3
50 + 9
200 = 8
25
Question 6
a. P (2 or less people)
P robability= px qn x
p=0.1, q=0.9
¿ ( 0.12 0.96 ) + ( 0.11 0.97 )
0.05+0.048=0.05
b. Poisson distribution
P ( X=x ) = λx eλ
x !
Where x=9 , λ=8
Document Page
Probability 9
P ( X=9 ) = 89 e8
9 ! =0.124
Question 7
a. P (x>2,000,000)
Z= x μ
δ
Mean = 1,100,000
Standard deviation = 385,000
Z=2,000,0001,100,000
385,000 =2.34
From the normal tables Z-value of 2.34 corresponds to a probability of 99.01%
Therefore P (x>2,000,000) = (100 - 99.01) = 0.99%
P (x>2,000,000) = 0.99%
b. P (1,000,00 < x < 1,100,000)
P ( 1,000,000< x<1,100,000 )=P ( x <1,100,000 ) P(1,000,000<x)
P ( x<1,100,000 )=1 , 1 00,0001,100,000
385,000 =0
And
P ( 1,0 00,000< x )=1 , 0 00,0001,100,000
385,000 =0.26
P (Z=0) = 50%
P (Z= - 0.26) = 60.26%
Therefore
P ( 1,000,000< x<1,100,000 )=60.26 %50 %
¿ 10.26 %
Question 8
Document Page
Probability
10
a. You can still use the normal use the Z-distribution to test assistant’s
research findings since the sample size of 50 is already greater than 30.
b. Probability
p= 0.30.244
0.3 ×0.7
45
= 0.056
0.068 =0.8235
¿ 82.35 %
chevron_up_icon
1 out of 10
circle_padding
hide_on_mobile
zoom_out_icon
[object Object]