Counting, Probability Distributions and Statistical Data Analysis
VerifiedAdded on 2023/06/11
|25
|2735
|494
Homework Assignment
AI Summary
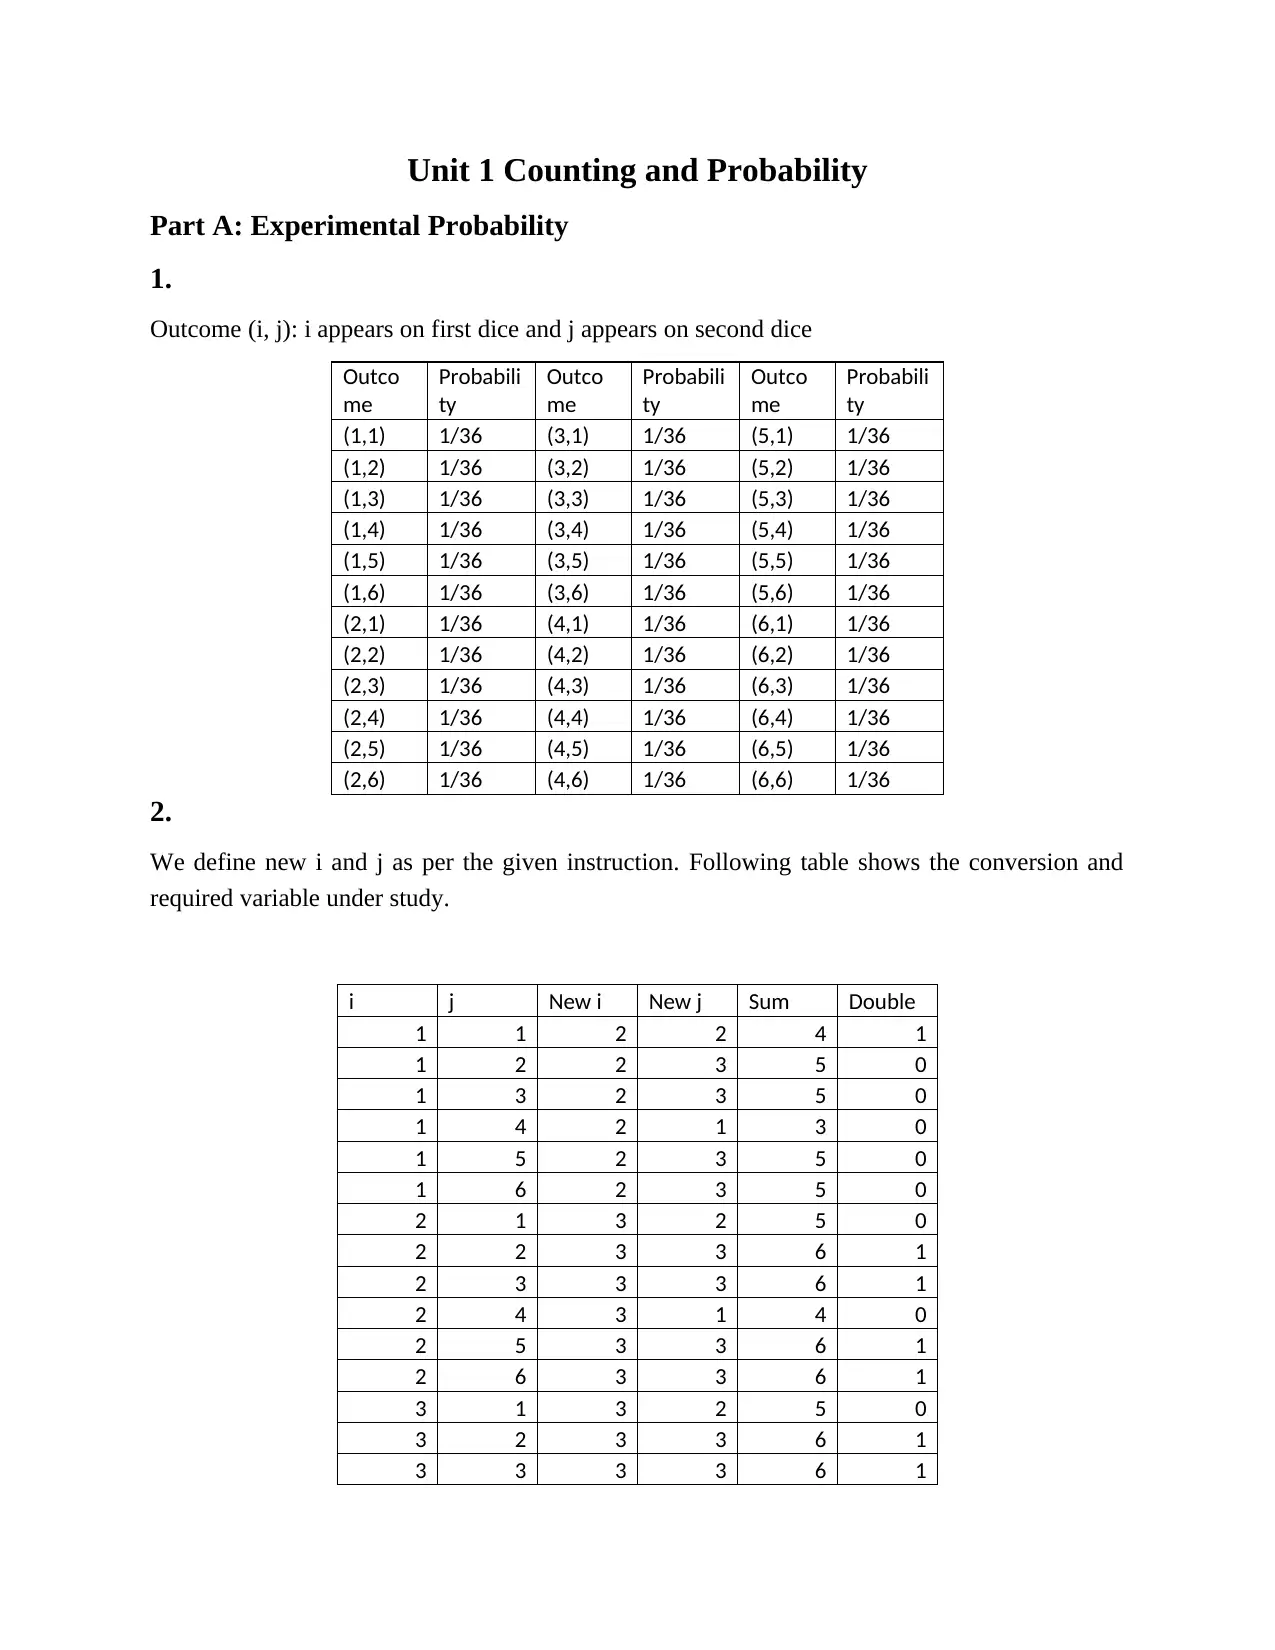
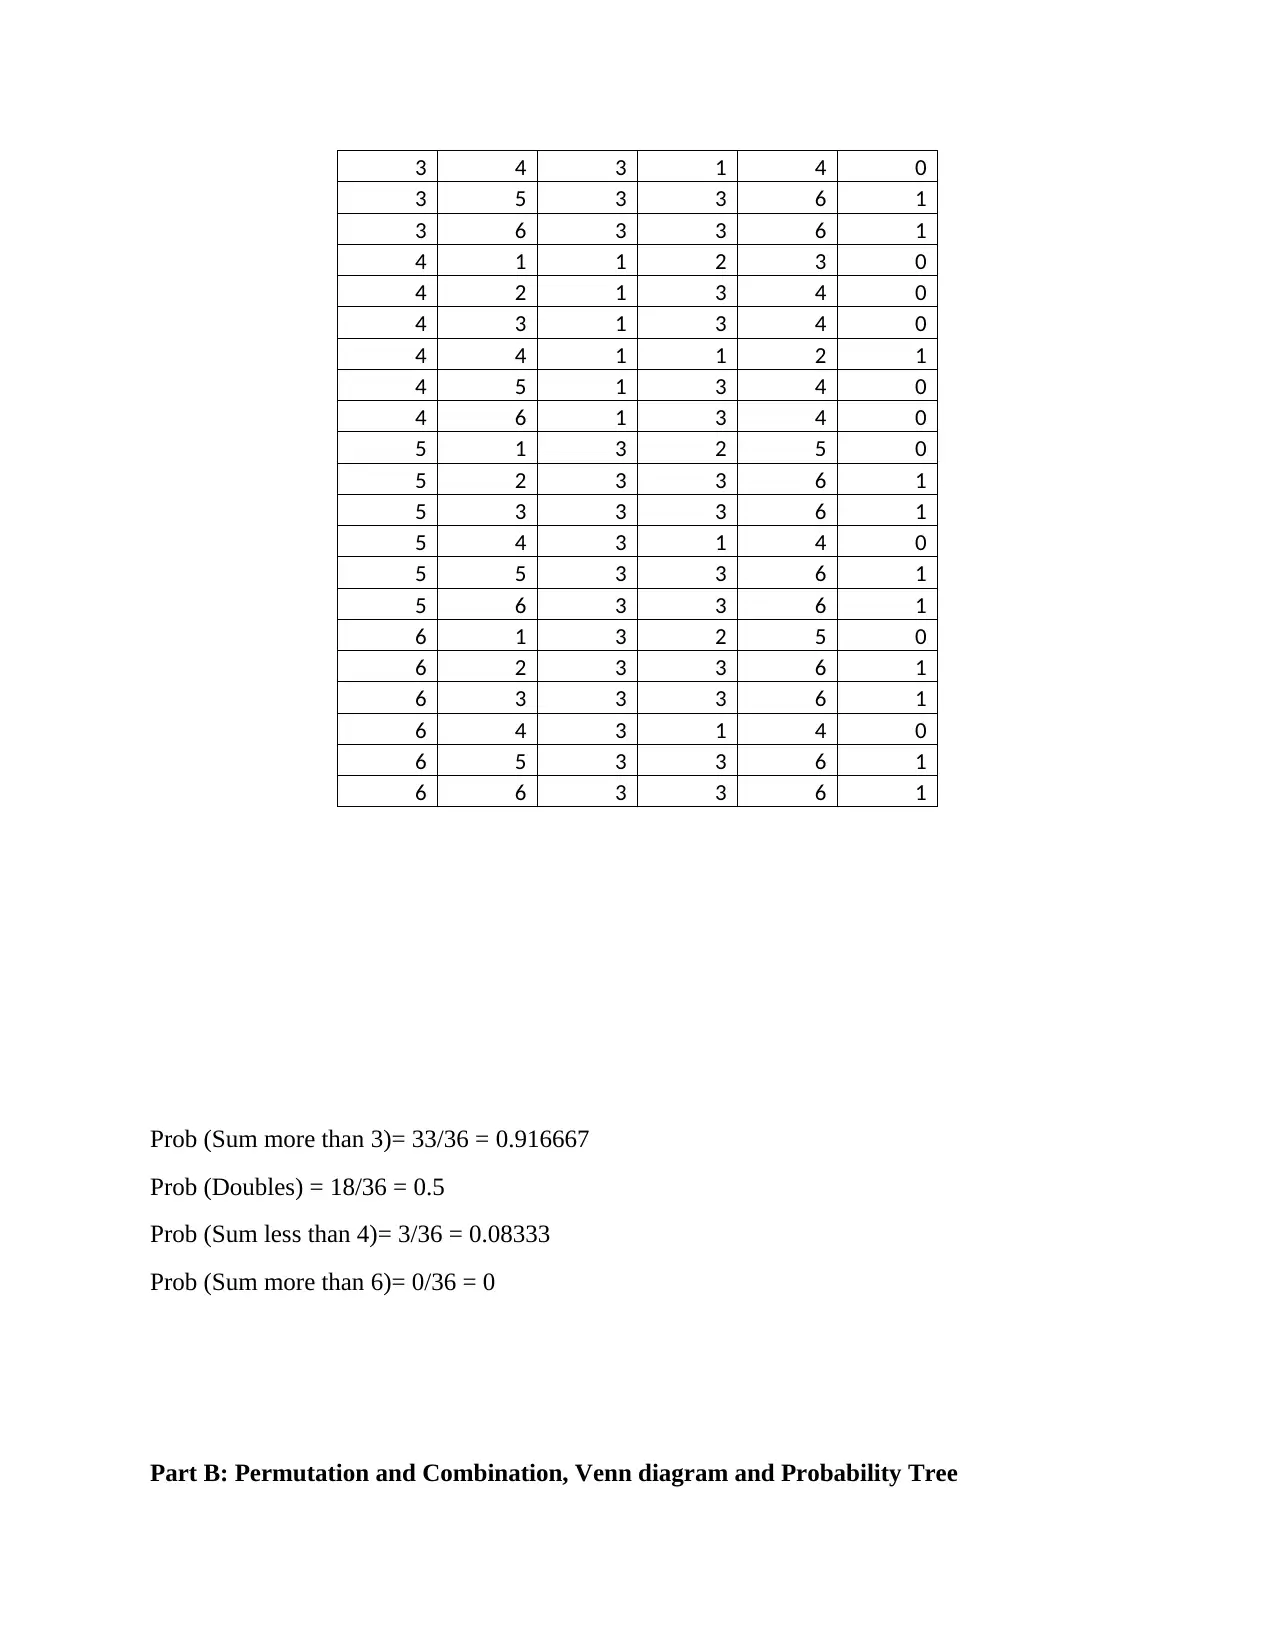
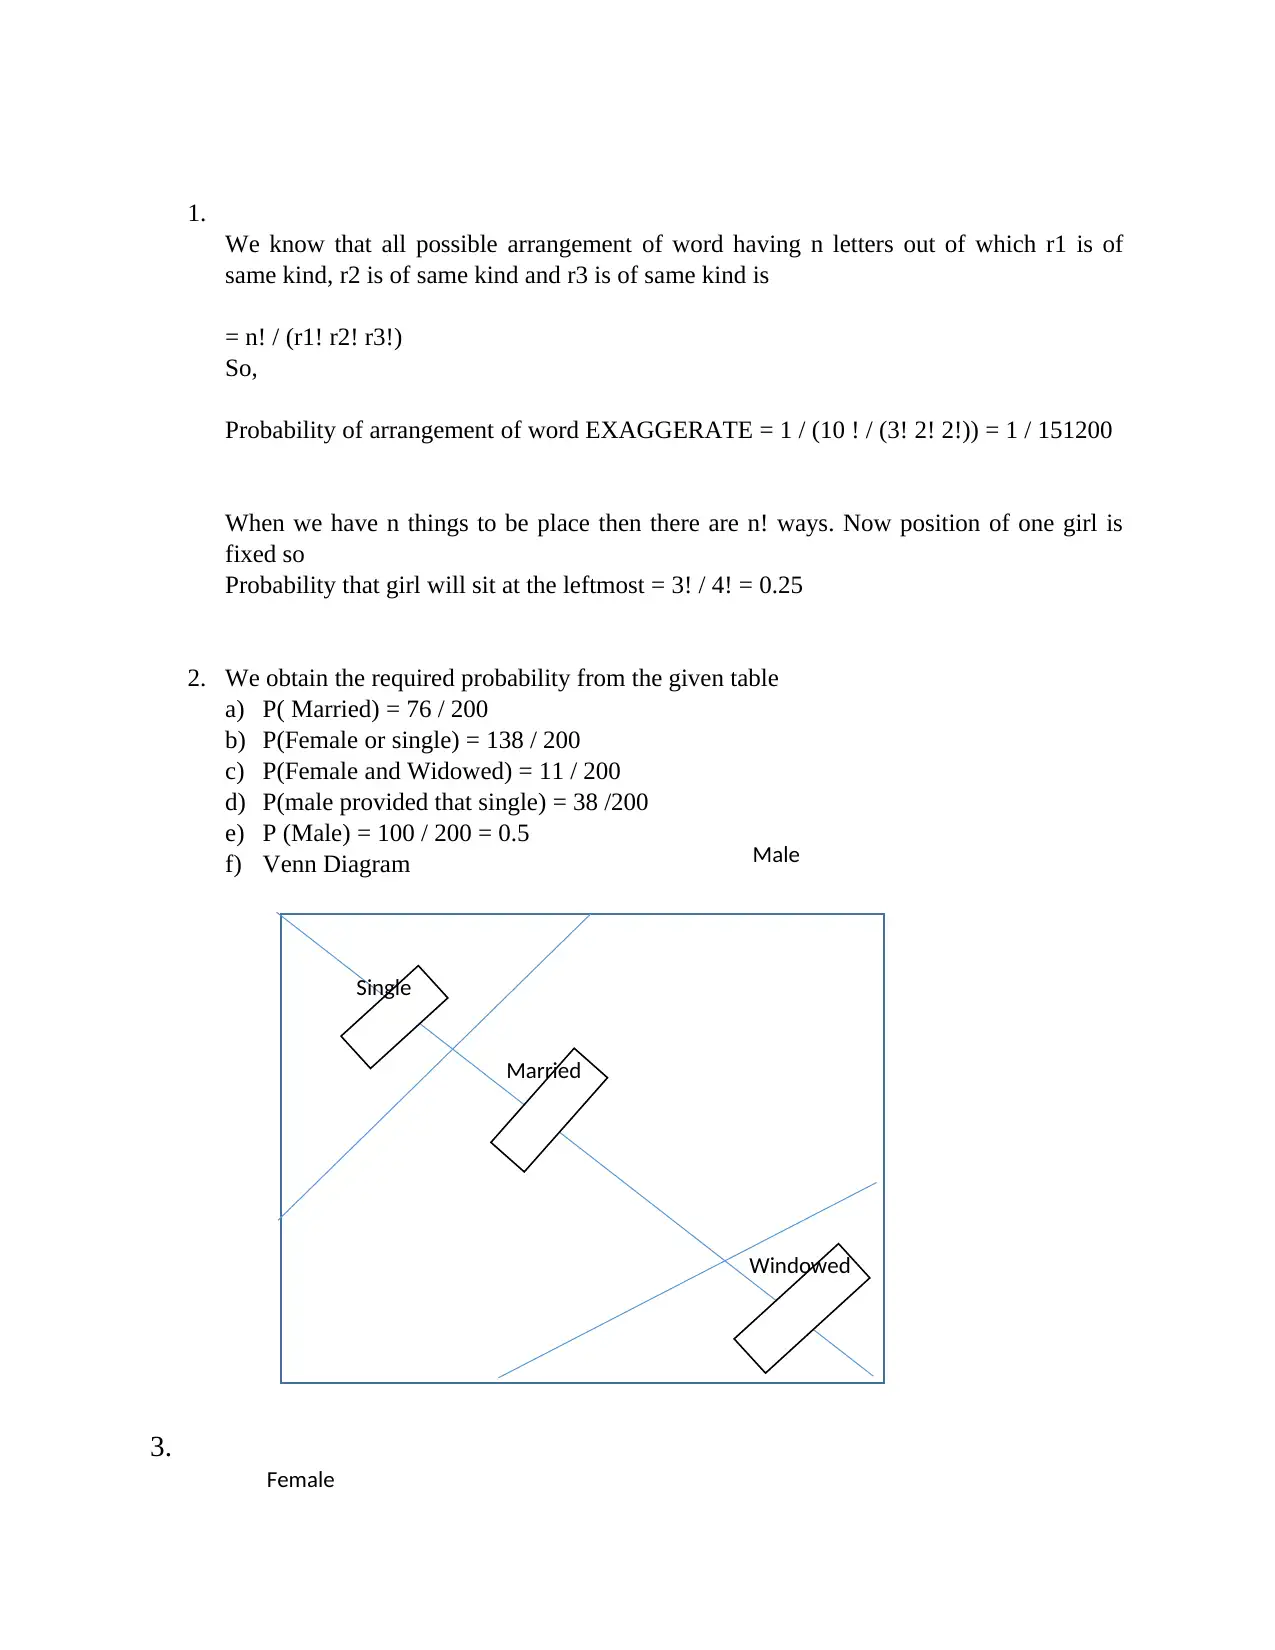
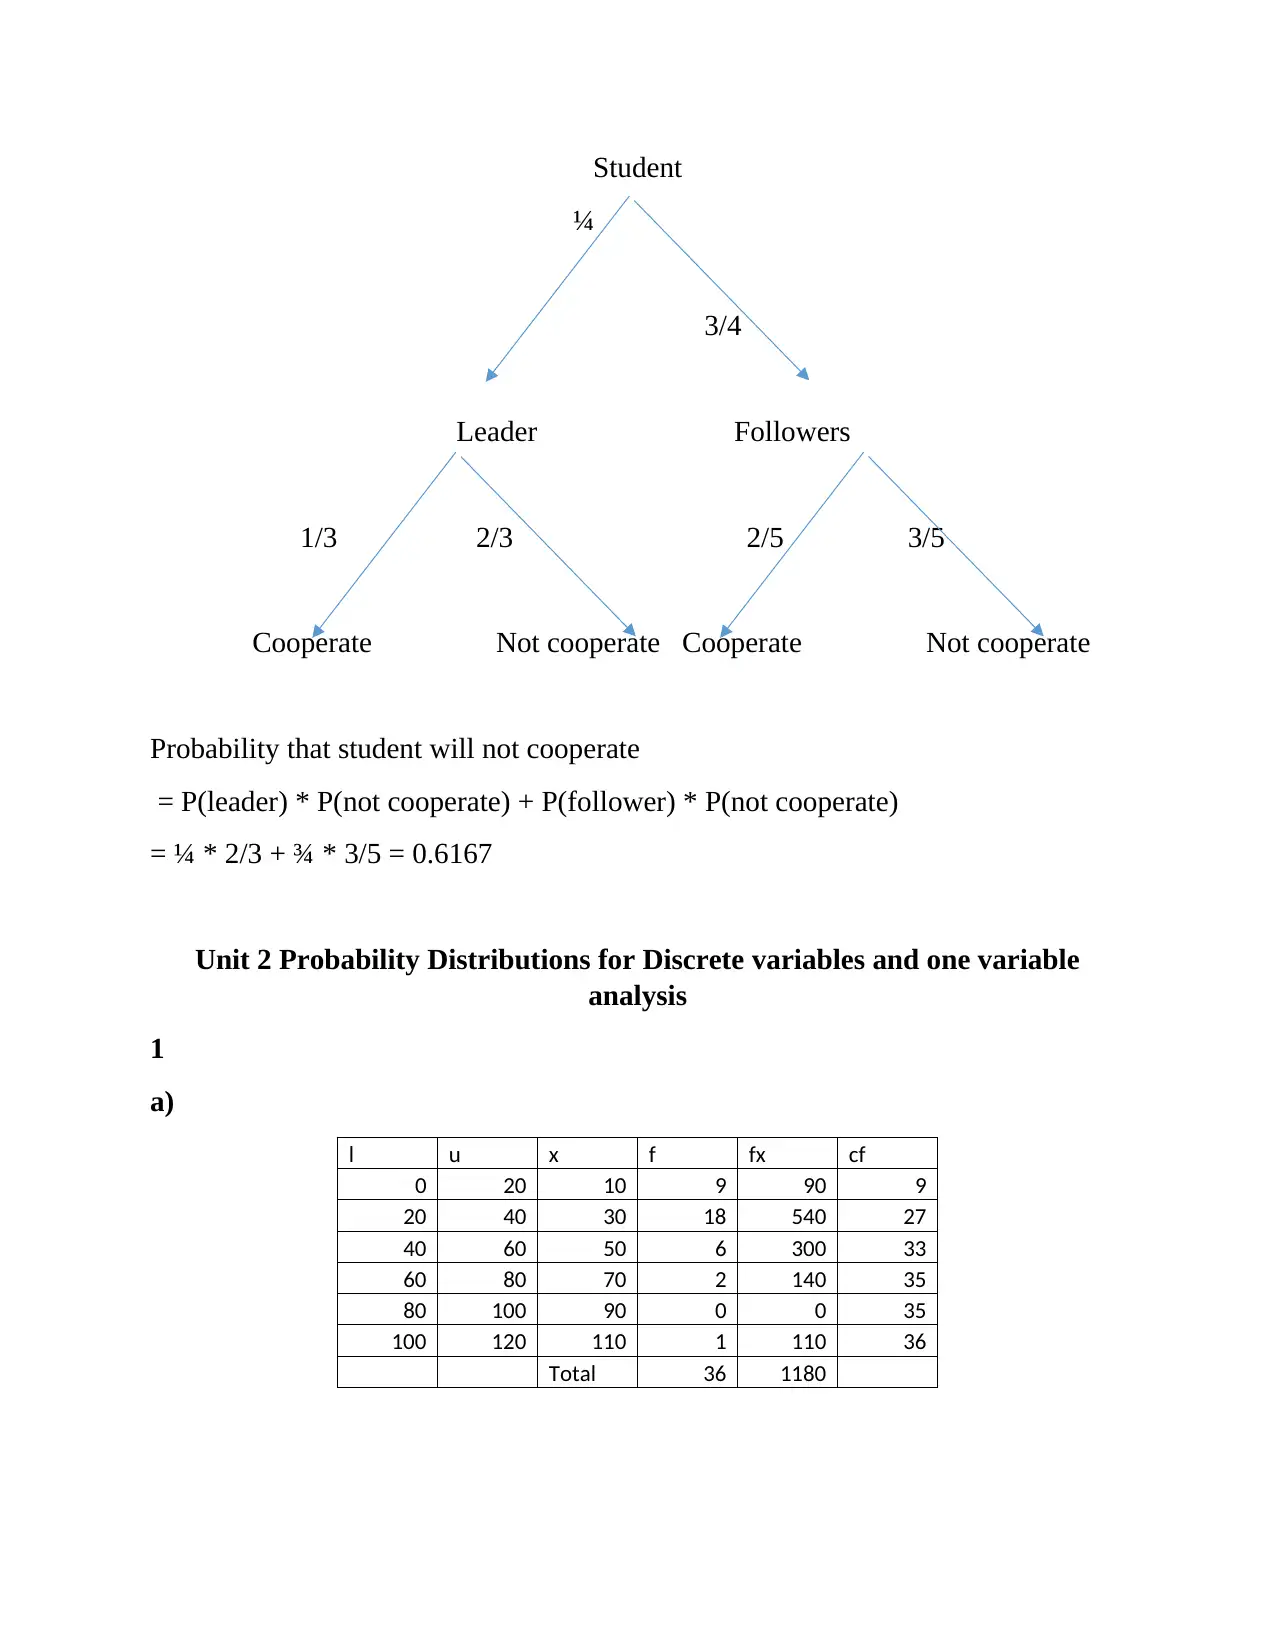
This assignment provides solutions to problems related to counting and probability, including experimental probability, permutations, combinations, and Venn diagrams. It also covers probability distributions for discrete and continuous variables, including calculations of mean, median, mode, interquartile range (IQR), variance, and standard deviation. The assignment includes data analysis using MS Excel, normal distribution calculations, and regression analysis to determine the relationship between instructional hours and student scores. The analysis includes identifying and removing outliers to improve the accuracy of the regression model. The assignment concludes with a discussion on the reliability of data and potential biases in data collection.

Unit 1 Counting and Probability
Part A: Experimental Probability
1.
Outcome (i, j): i appears on first dice and j appears on second dice
Outco
me
Probabili
ty
Outco
me
Probabili
ty
Outco
me
Probabili
ty
(1,1) 1/36 (3,1) 1/36 (5,1) 1/36
(1,2) 1/36 (3,2) 1/36 (5,2) 1/36
(1,3) 1/36 (3,3) 1/36 (5,3) 1/36
(1,4) 1/36 (3,4) 1/36 (5,4) 1/36
(1,5) 1/36 (3,5) 1/36 (5,5) 1/36
(1,6) 1/36 (3,6) 1/36 (5,6) 1/36
(2,1) 1/36 (4,1) 1/36 (6,1) 1/36
(2,2) 1/36 (4,2) 1/36 (6,2) 1/36
(2,3) 1/36 (4,3) 1/36 (6,3) 1/36
(2,4) 1/36 (4,4) 1/36 (6,4) 1/36
(2,5) 1/36 (4,5) 1/36 (6,5) 1/36
(2,6) 1/36 (4,6) 1/36 (6,6) 1/36
2.
We define new i and j as per the given instruction. Following table shows the conversion and
required variable under study.
i j New i New j Sum Double
1 1 2 2 4 1
1 2 2 3 5 0
1 3 2 3 5 0
1 4 2 1 3 0
1 5 2 3 5 0
1 6 2 3 5 0
2 1 3 2 5 0
2 2 3 3 6 1
2 3 3 3 6 1
2 4 3 1 4 0
2 5 3 3 6 1
2 6 3 3 6 1
3 1 3 2 5 0
3 2 3 3 6 1
3 3 3 3 6 1
Paraphrase This Document
Need a fresh take? Get an instant paraphrase of this document with our AI Paraphraser

3 4 3 1 4 0
3 5 3 3 6 1
3 6 3 3 6 1
4 1 1 2 3 0
4 2 1 3 4 0
4 3 1 3 4 0
4 4 1 1 2 1
4 5 1 3 4 0
4 6 1 3 4 0
5 1 3 2 5 0
5 2 3 3 6 1
5 3 3 3 6 1
5 4 3 1 4 0
5 5 3 3 6 1
5 6 3 3 6 1
6 1 3 2 5 0
6 2 3 3 6 1
6 3 3 3 6 1
6 4 3 1 4 0
6 5 3 3 6 1
6 6 3 3 6 1
Prob (Sum more than 3)= 33/36 = 0.916667
Prob (Doubles) = 18/36 = 0.5
Prob (Sum less than 4)= 3/36 = 0.08333
Prob (Sum more than 6)= 0/36 = 0
Part B: Permutation and Combination, Venn diagram and Probability Tree

1.
We know that all possible arrangement of word having n letters out of which r1 is of
same kind, r2 is of same kind and r3 is of same kind is
= n! / (r1! r2! r3!)
So,
Probability of arrangement of word EXAGGERATE = 1 / (10 ! / (3! 2! 2!)) = 1 / 151200
When we have n things to be place then there are n! ways. Now position of one girl is
fixed so
Probability that girl will sit at the leftmost = 3! / 4! = 0.25
2. We obtain the required probability from the given table
a) P( Married) = 76 / 200
b) P(Female or single) = 138 / 200
c) P(Female and Widowed) = 11 / 200
d) P(male provided that single) = 38 /200
e) P (Male) = 100 / 200 = 0.5
f) Venn Diagram
3.
Male
Female
Single
Married
Windowed
⊘ This is a preview!⊘
Do you want full access?
Subscribe today to unlock all pages.

Trusted by 1+ million students worldwide

Student
¼
3/4
Leader Followers
1/3 2/3 2/5 3/5
Cooperate Not cooperate Cooperate Not cooperate
Probability that student will not cooperate
= P(leader) * P(not cooperate) + P(follower) * P(not cooperate)
= ¼ * 2/3 + ¾ * 3/5 = 0.6167
Unit 2 Probability Distributions for Discrete variables and one variable
analysis
1
a)
l u x f fx cf
0 20 10 9 90 9
20 40 30 18 540 27
40 60 50 6 300 33
60 80 70 2 140 35
80 100 90 0 0 35
100 120 110 1 110 36
Total 36 1180
Paraphrase This Document
Need a fresh take? Get an instant paraphrase of this document with our AI Paraphraser

Mean= ∑ fx
∑ f =1180/ 36 = 32.7778
Median:
Here n=36 so 36/2=18 so
20-40 is median class
Median = l + (n/2 – cf) * w/ f
l is lower bound of median class
n is total frequency
cf is cumulative frequency of pre median class
f is frequency of median class
w is width of class
Here l=20, n=36, cf=9, f=18, w=20
Median = 20 + (36/2 – 9) * 20/ 18 = 20 + (18 – 9) * 20 / 18 = 20 + 10 = 30
Mode: the class which has highest frequency is modal class
20-40 is modal class.
Mode = l + (f1-f0)/((f1-f0)+(f1-f2))*w
l is lower bound of median class
f1 is frequency of modal class
f0 is frequency of premodal class
f2 is frequency of post modal class
w is width of class
Mode = 20 + (18 -9) / ((18 – 9) + (18 – 6)) * 20 = 28.57142857
b)

0-20 20-40 40-60 60-80 80-100 100-120
0
2
4
6
8
10
12
14
16
18
20
Class
Frequency
c)
IQR = Q3 – Q1
From the data,
For Q3:
Here n=36 so 36*3/4=27 so
40-60 is Q3 class
Q3 = l + (3*n/4 – cf) * w/ f
l is lower bound of Q3 class
n is total frequency
cf is cumulative frequency of pre Q3 class
f is frequency of Q3 class
w is width of class
Here l=40, n=36, cf=27, f=6, w=20
Q3 = 40 + (3*36/4 – 27) * 20/ 6 = 40
For Q1:
Here n=36 so 36/4=9 so
20-40 is Q1 class
⊘ This is a preview!⊘
Do you want full access?
Subscribe today to unlock all pages.

Trusted by 1+ million students worldwide

Q1 = l + (n/4 – cf) * w/ f
l is lower bound of Q1 class
n is total frequency
cf is cumulative frequency of pre Q1 class
f is frequency of Q1 class
w is width of class
Here l=20, n=36, cf=9, f=18, w=20
Q3 = 20 + (36/4 – 9) * 20/18 = 20
So
Q3 = 40
Q1 = 20
IQR = 20
Box Whisker Plot
l is lower bound of Q1 class
n is total frequency
cf is cumulative frequency of pre Q1 class
f is frequency of Q1 class
w is width of class
Here l=20, n=36, cf=9, f=18, w=20
Q3 = 20 + (36/4 – 9) * 20/18 = 20
So
Q3 = 40
Q1 = 20
IQR = 20
Box Whisker Plot
Paraphrase This Document
Need a fresh take? Get an instant paraphrase of this document with our AI Paraphraser

1
0
5
10
15
20
25
30
35
Box Plot
A B C
d)
Variance = ∑ f x2
∑ f - (mean)2
Variance = 54000 / 36 – (mean)* (mean) = 425.6173
Standard deviation = √var iance = 20.63049
e)
This data have lower mean with some more variation in time.
0
5
10
15
20
25
30
35
Box Plot
A B C
d)
Variance = ∑ f x2
∑ f - (mean)2
Variance = 54000 / 36 – (mean)* (mean) = 425.6173
Standard deviation = √var iance = 20.63049
e)
This data have lower mean with some more variation in time.

2.
We used MS Excel for the calculation.
a)
mean
31.9444
4
mode 12
Median 28.5
Q1 20.75
Q3 38.75
IQR 18
SD
21.6266
3
Var
467.711
1
b)
Mean, median and mode of grouped data is more than ungrouped data.
SD is minimum for grouped data than ungrouped data.
c)
74 and 118 are outliers in data
d)
mean
28.1764
7
mode 12
Median 27.5
Q1 20.25
Q3 38.75
IQR 18.5
SD
14.2626
2
Var 203.422
⊘ This is a preview!⊘
Do you want full access?
Subscribe today to unlock all pages.

Trusted by 1+ million students worldwide

5
3.
Report:
From the given frequency distribution of time the cars spent on lot we observed that, the average
time spent by car on lot is 32.7778 days with standard deviation of 20.63 days. The minimum
time is 1 day while maximum day is 120 days.
From the histogram we can observed that data is positively skewed means most of the cars spent
less time on lot. First quartile and third quartile are equidistance from median. The upper part of
data is more skewed suggest that if car is more than 40 days on lot then the probability that it will
be there for longer time.
Paraphrase This Document
Need a fresh take? Get an instant paraphrase of this document with our AI Paraphraser

Unit 4: Probability Distribution for continuous variables and Two variable
Data Analysis
a)
b)
Data Analysis
a)
b)

1.
We obtained the area/probability from normal distribution table and verified using MS Excel
function Norm.Dist
a)
Prob = 0.3907
b)
We obtained the area/probability from normal distribution table and verified using MS Excel
function Norm.Dist
a)
Prob = 0.3907
b)
⊘ This is a preview!⊘
Do you want full access?
Subscribe today to unlock all pages.

Trusted by 1+ million students worldwide
1 out of 25
Related Documents

Your All-in-One AI-Powered Toolkit for Academic Success.
+13062052269
info@desklib.com
Available 24*7 on WhatsApp / Email
Unlock your academic potential
Copyright © 2020–2025 A2Z Services. All Rights Reserved. Developed and managed by ZUCOL.