Analyzing Project Completion Probabilities Using Critical Path Method
VerifiedAdded on  2020/10/22
|12
|1761
|427
AI Summary
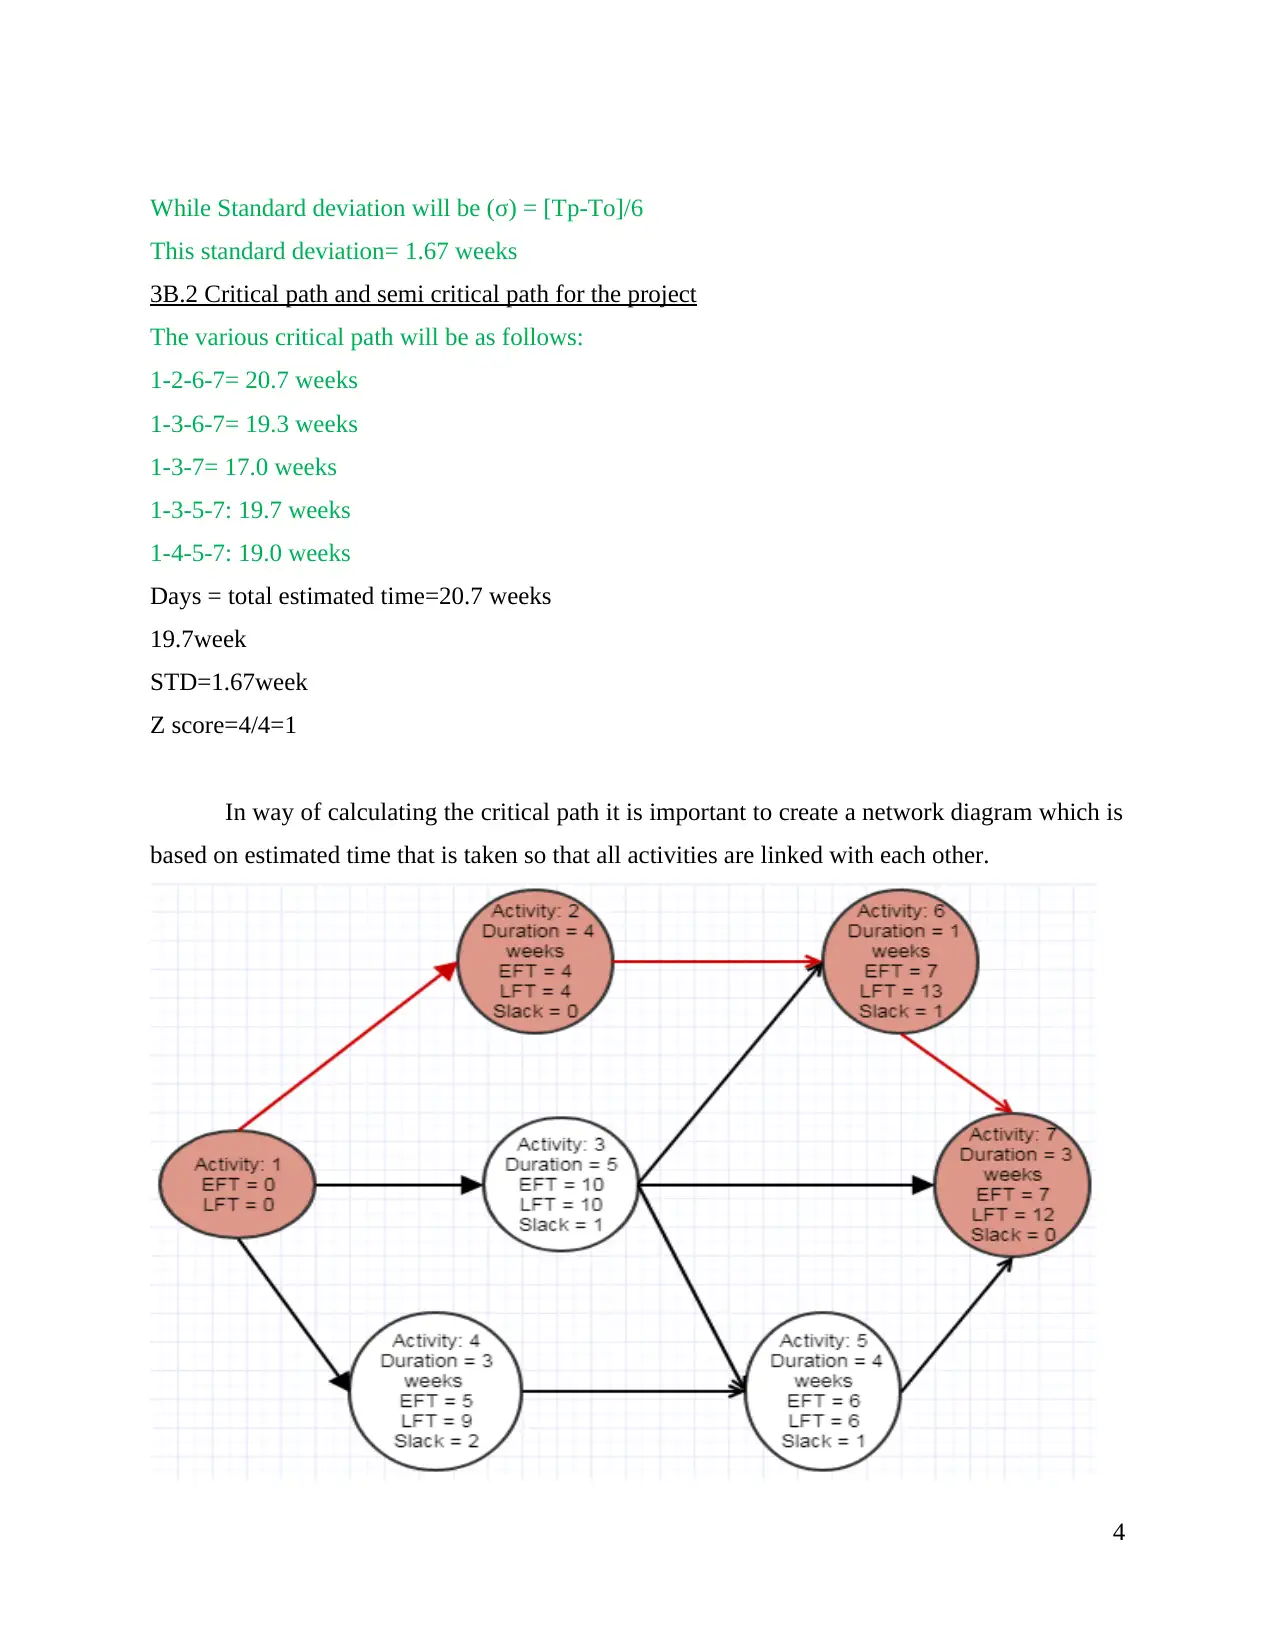
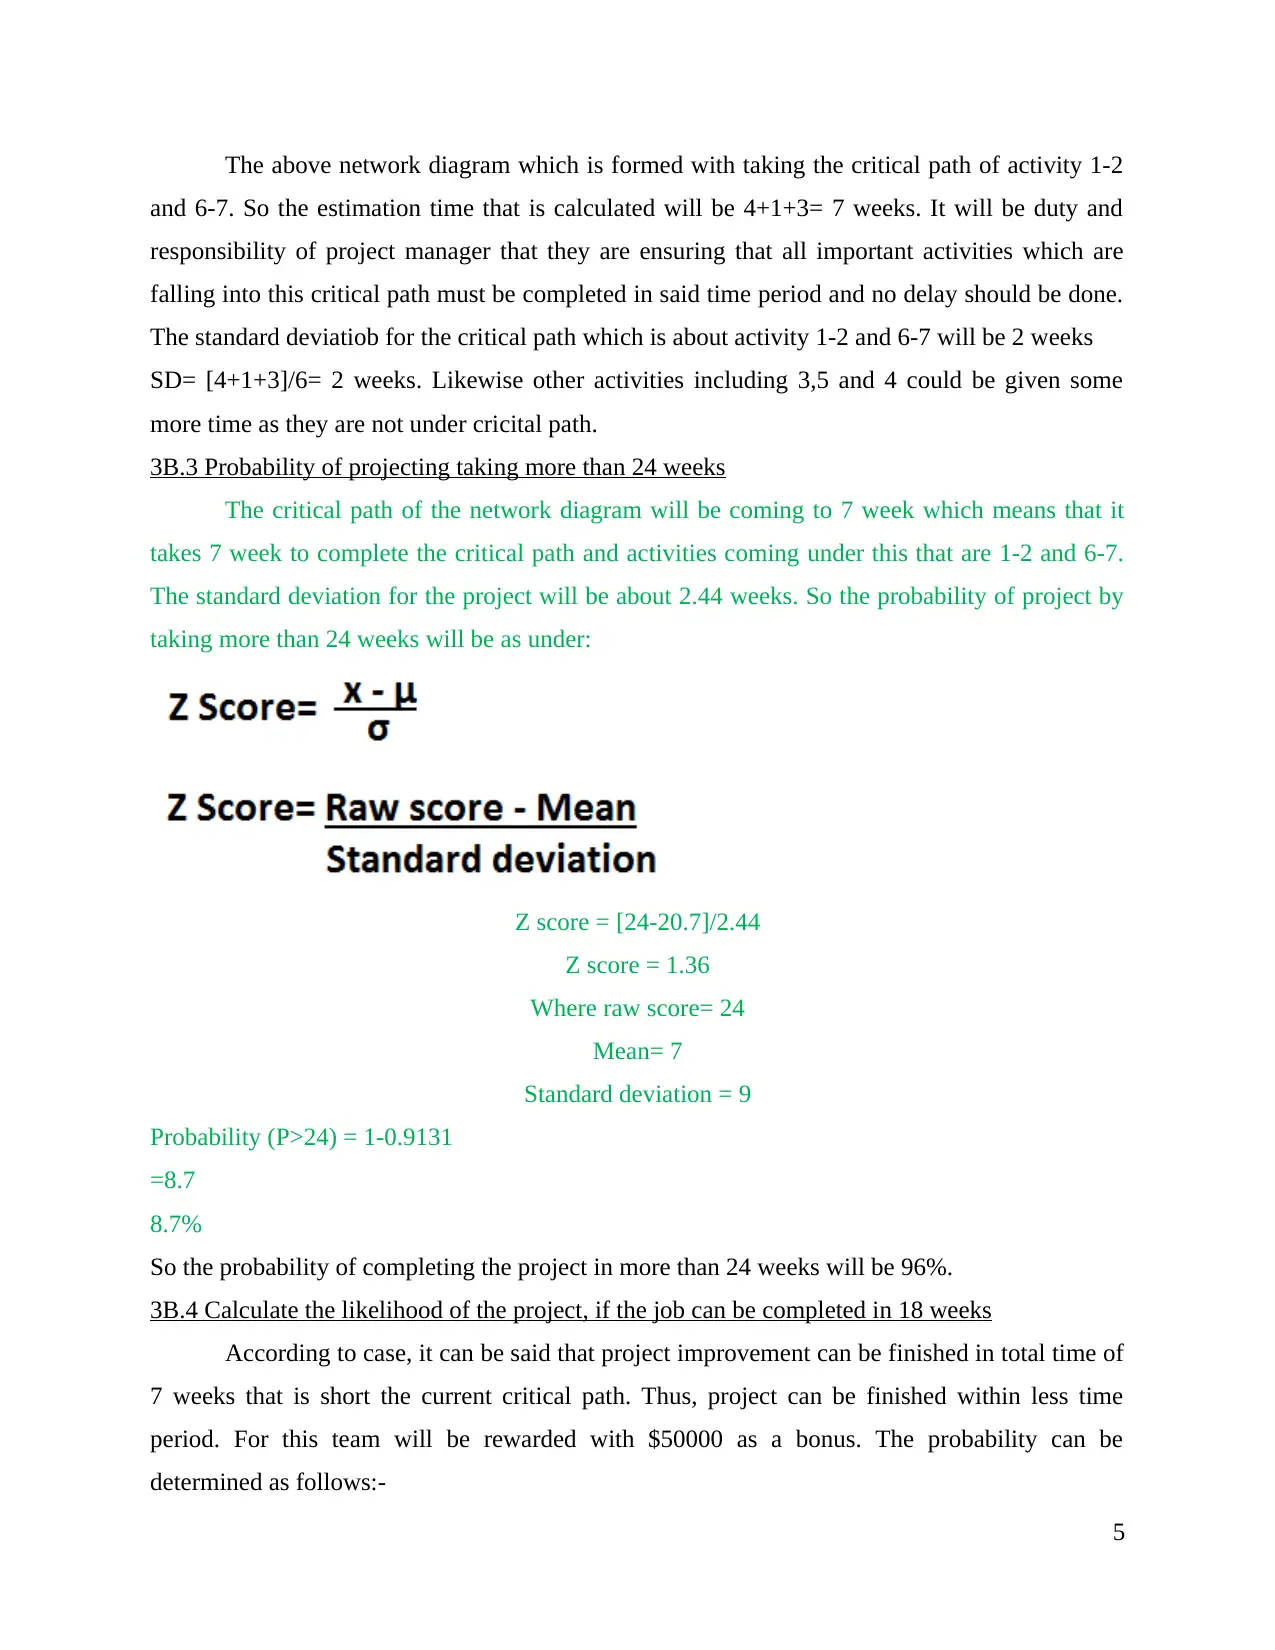
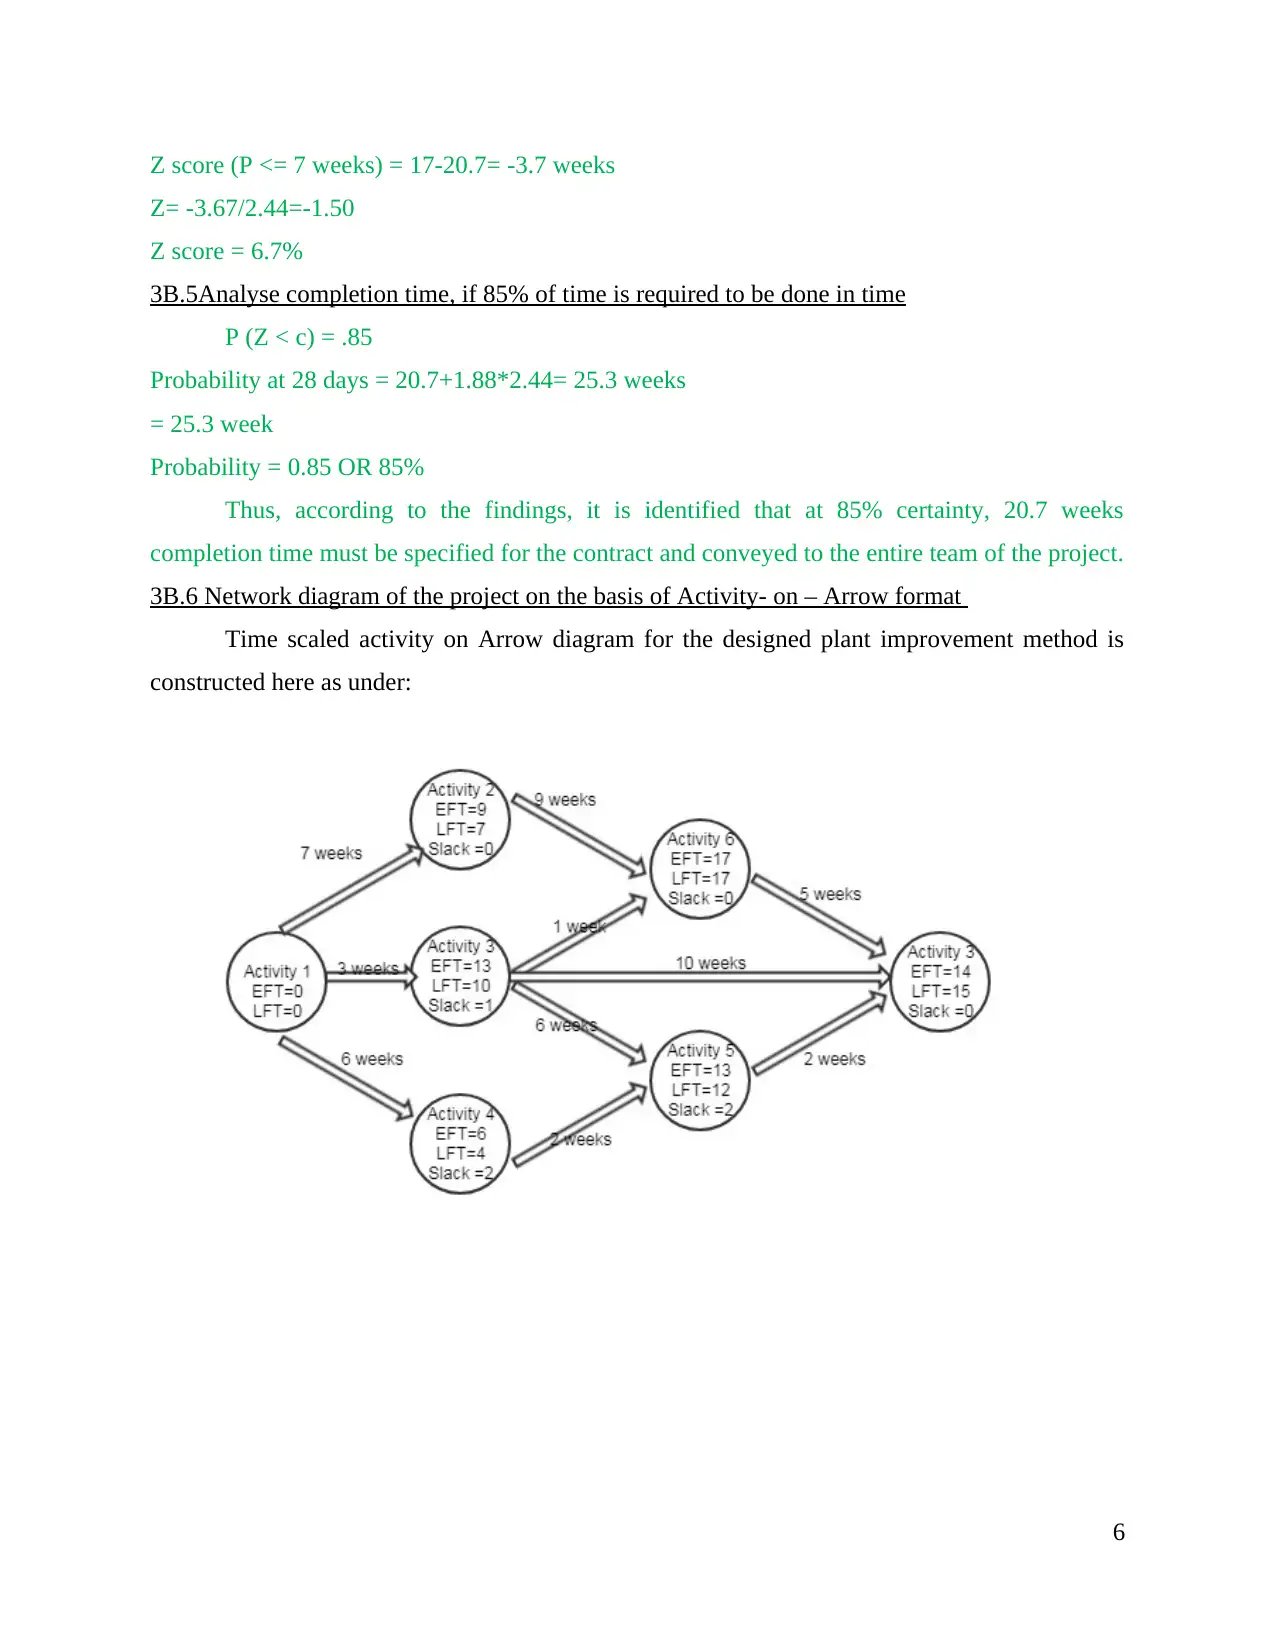
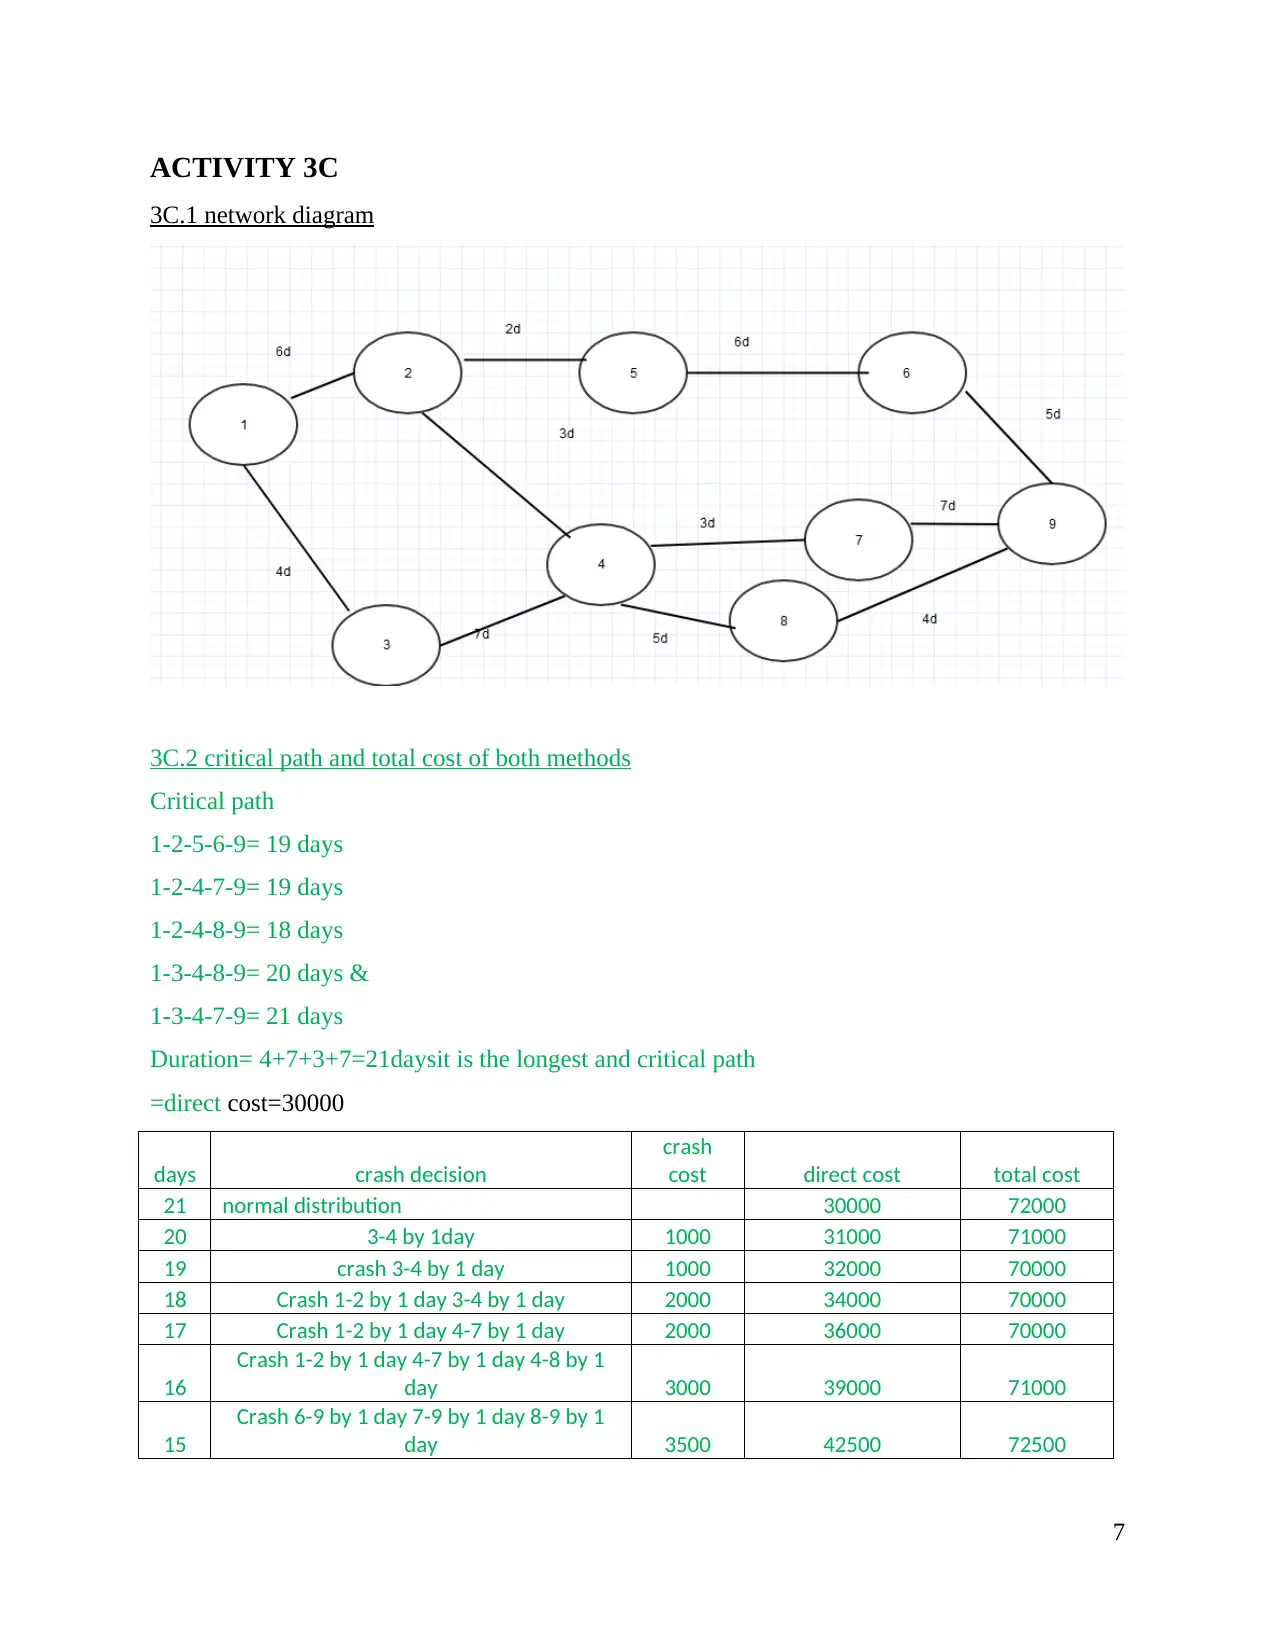
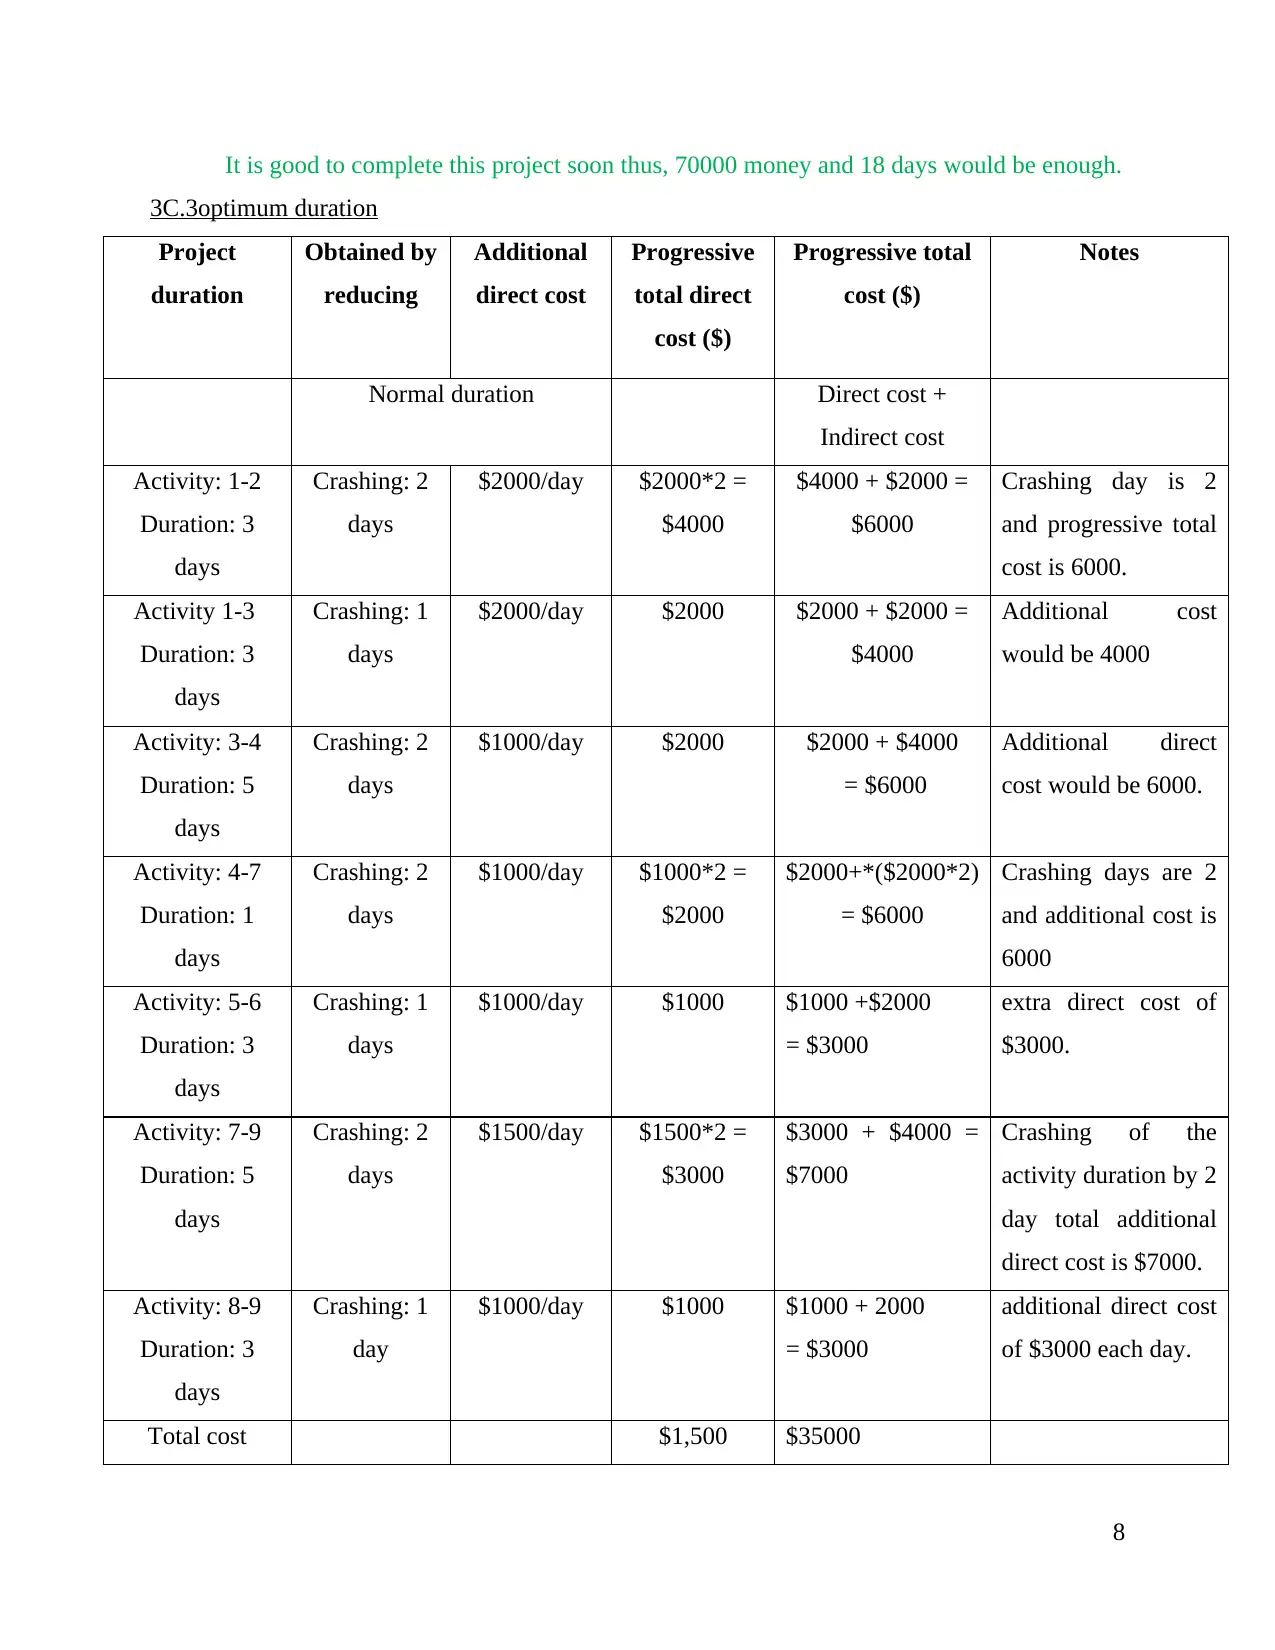
The study focuses on evaluating project completion probabilities through critical path analysis, emphasizing critical activities with zero slack time. By applying PERT calculations to determine expected times and variances, the study assesses probability scenarios for project timelines. The findings illustrate that while the initial critical path has a high likelihood of meeting deadlines, cost optimization strategies suggest alternative paths may reduce expenses without significantly increasing risk. This comprehensive analysis underscores the importance of balancing timely completion with budget constraints in project management.

INDUSTRIAL TECHNIQUES IN
MAINTENANCE MANAGEMENT
1 2018
MAINTENANCE MANAGEMENT
1 2018
Paraphrase This Document
Need a fresh take? Get an instant paraphrase of this document with our AI Paraphraser

TABLE OF CONTENTS
INTRODUCTION...........................................................................................................................1
ACTIVITY 3A.................................................................................................................................1
3 A.1 network diagram................................................................................................................1
3 A.2 Bar chart.............................................................................................................................2
3 A.3 Refine schedule..................................................................................................................2
ACTIVITY 3B.................................................................................................................................3
3B.1 Calculate the estimated time and the standard deviation on that estimate for each activity.
.....................................................................................................................................................3
3B.2 Critical path and semi critical path for the project,.............................................................4
3B.3 Probability of projecting taking more than 24 weeks.........................................................5
3B.4 Calculate the likelihood of the project, if the job can be completed in 18 weeks...............6
3B.5Analyse completion time, if 85% of time is required to be done in time............................7
3B.6 Network diagram of the project on the basis of Activity- on – Arrow format...................7
ACTIVITY 3C.................................................................................................................................8
3C.1 network diagram.................................................................................................................8
3C.2 critical path and total cost of both methods........................................................................8
3C.3optimum duration.................................................................................................................9
CONCLUSION..............................................................................................................................10
REFERENCES..............................................................................................................................11
2 2018

INTRODUCTION
Project planning is considered as most essential task that helps project manager in defining
scope and identifying need of resources (Critical path analysis, 2012). Present study will Draw
the network for given job. It will calculate the estimated time and the standard deviation on that
estimate for each activity
ACTIVITY 3A
3 A.1 network diagram
Activities Duration People EFT LFT Float
1-2 2 2 2 5 3
1-3 3 2 3 3 0
2-4 2 4 4 7 3
2-5 3 5 5 10 5
3-4 4 3 7 7 0
4-5 3 1 10 10 0
Critical path: 1-3, 3-4, 4-5
As per the diagram critical path is 1-3, 3-4, 4-5. Completion duration for this project would
be 3+4+3 days= 10 days (Burke, 2013).
1
⊘ This is a preview!⊘
Do you want full access?
Subscribe today to unlock all pages.

Trusted by 1+ million students worldwide

3 A.2 Bar chart
Days 3, 4 and 5 require 11, 12 and 8 people and shows resource conflict due to five people available.
Act D1 D2 D3 D4 D5 D6 D7 D8 D9 D10 D11 D12 D13
1-2 2 2
1-3 2 2 2
2-4 4 4
2-5 5 5 5
3-4 3 3 3 3
4-5 1 1 1
Total 4 4 11 12 8 3 3 1 1 1
Project Duration is 10 days without considering resource constraints.
Activities 2-4, 2-5 and 4-5 are required to be shifted, by this way existing five people will be able
to manage it
3 A.3 Refine schedule
As at the 7th day one workers went on leave due to medical reason for 2 days that this is
will impact on entire project and there would be require to do rescheduling.
Activities People Duration EFT LFT Float
1-2 2 2 2 5 3
1-3 2 3 3 3 0
2
Paraphrase This Document
Need a fresh take? Get an instant paraphrase of this document with our AI Paraphraser

2-4 4 2 7 7 0
2-5 5 3 10 10 0
3-4 3 4 7 7 0
4-5 1 3 10 10 0
ACTIVITY 3B
Activity Optimistic
time
Most
likely
time
Pessimistic
time
Estimating
time
Standard
deviation
Variance
1-2 6 10 12 9.7 1 1
1-3 10 10 10 10 0 0
1-4 3 5 9 5.3 1 1
2-6 1 7 13 7 2 4
3-5 2 2 2 2 0 0
3-6 5 4 11 5.3 1 1
3-7 4 7 10 7 1 1
4-5 6 6 6 6 0 0
5-7 2 8 12 7.7 1.666666667 2.777777778
6-7 1 4 7 4 1 1
64 8.666666667
3B.1 Calculate the estimated time and the standard deviation on that estimate for each activity.
The estimated time for this will be calculated by following formula:
To + tm+ tp /6
Where
To = Optimistic time
Tm= Most likely time
Tp= Pessimistic time
So estimated time will be 20.7 weeks
3

While Standard deviation will be (σ) = [Tp-To]/6
This standard deviation= 1.67 weeks
3B.2 Critical path and semi critical path for the project
The various critical path will be as follows:
1-2-6-7= 20.7 weeks
1-3-6-7= 19.3 weeks
1-3-7= 17.0 weeks
1-3-5-7: 19.7 weeks
1-4-5-7: 19.0 weeks
Days = total estimated time=20.7 weeks
19.7week
STD=1.67week
Z score=4/4=1
In way of calculating the critical path it is important to create a network diagram which is
based on estimated time that is taken so that all activities are linked with each other.
4
⊘ This is a preview!⊘
Do you want full access?
Subscribe today to unlock all pages.

Trusted by 1+ million students worldwide

The above network diagram which is formed with taking the critical path of activity 1-2
and 6-7. So the estimation time that is calculated will be 4+1+3= 7 weeks. It will be duty and
responsibility of project manager that they are ensuring that all important activities which are
falling into this critical path must be completed in said time period and no delay should be done.
The standard deviatiob for the critical path which is about activity 1-2 and 6-7 will be 2 weeks
SD= [4+1+3]/6= 2 weeks. Likewise other activities including 3,5 and 4 could be given some
more time as they are not under cricital path.
3B.3 Probability of projecting taking more than 24 weeks
The critical path of the network diagram will be coming to 7 week which means that it
takes 7 week to complete the critical path and activities coming under this that are 1-2 and 6-7.
The standard deviation for the project will be about 2.44 weeks. So the probability of project by
taking more than 24 weeks will be as under:
Z score = [24-20.7]/2.44
Z score = 1.36
Where raw score= 24
Mean= 7
Standard deviation = 9
Probability (P>24) = 1-0.9131
=8.7
8.7%
So the probability of completing the project in more than 24 weeks will be 96%.
3B.4 Calculate the likelihood of the project, if the job can be completed in 18 weeks
According to case, it can be said that project improvement can be finished in total time of
7 weeks that is short the current critical path. Thus, project can be finished within less time
period. For this team will be rewarded with $50000 as a bonus. The probability can be
determined as follows:-
5
Paraphrase This Document
Need a fresh take? Get an instant paraphrase of this document with our AI Paraphraser

Z score (P <= 7 weeks) = 17-20.7= -3.7 weeks
Z= -3.67/2.44=-1.50
Z score = 6.7%
3B.5Analyse completion time, if 85% of time is required to be done in time
P (Z < c) = .85
Probability at 28 days = 20.7+1.88*2.44= 25.3 weeks
= 25.3 week
Probability = 0.85 OR 85%
Thus, according to the findings, it is identified that at 85% certainty, 20.7 weeks
completion time must be specified for the contract and conveyed to the entire team of the project.
3B.6 Network diagram of the project on the basis of Activity- on – Arrow format
Time scaled activity on Arrow diagram for the designed plant improvement method is
constructed here as under:
6

ACTIVITY 3C
3C.1 network diagram
3C.2 critical path and total cost of both methods
Critical path
1-2-5-6-9= 19 days
1-2-4-7-9= 19 days
1-2-4-8-9= 18 days
1-3-4-8-9= 20 days &
1-3-4-7-9= 21 days
Duration= 4+7+3+7=21daysit is the longest and critical path
=direct cost=30000
days crash decision
crash
cost direct cost total cost
21 normal distribution 30000 72000
20 3-4 by 1day 1000 31000 71000
19 crash 3-4 by 1 day 1000 32000 70000
18 Crash 1-2 by 1 day 3-4 by 1 day 2000 34000 70000
17 Crash 1-2 by 1 day 4-7 by 1 day 2000 36000 70000
16
Crash 1-2 by 1 day 4-7 by 1 day 4-8 by 1
day 3000 39000 71000
15
Crash 6-9 by 1 day 7-9 by 1 day 8-9 by 1
day 3500 42500 72500
7
⊘ This is a preview!⊘
Do you want full access?
Subscribe today to unlock all pages.

Trusted by 1+ million students worldwide

It is good to complete this project soon thus, 70000 money and 18 days would be enough.
3C.3optimum duration
Project
duration
Obtained by
reducing
Additional
direct cost
Progressive
total direct
cost ($)
Progressive total
cost ($)
Notes
Normal duration Direct cost +
Indirect cost
Activity: 1-2
Duration: 3
days
Crashing: 2
days
$2000/day $2000*2 =
$4000
$4000 + $2000 =
$6000
Crashing day is 2
and progressive total
cost is 6000.
Activity 1-3
Duration: 3
days
Crashing: 1
days
$2000/day $2000 $2000 + $2000 =
$4000
Additional cost
would be 4000
Activity: 3-4
Duration: 5
days
Crashing: 2
days
$1000/day $2000 $2000 + $4000
= $6000
Additional direct
cost would be 6000.
Activity: 4-7
Duration: 1
days
Crashing: 2
days
$1000/day $1000*2 =
$2000
$2000+*($2000*2)
= $6000
Crashing days are 2
and additional cost is
6000
Activity: 5-6
Duration: 3
days
Crashing: 1
days
$1000/day $1000 $1000 +$2000
= $3000
extra direct cost of
$3000.
Activity: 7-9
Duration: 5
days
Crashing: 2
days
$1500/day $1500*2 =
$3000
$3000 + $4000 =
$7000
Crashing of the
activity duration by 2
day total additional
direct cost is $7000.
Activity: 8-9
Duration: 3
days
Crashing: 1
day
$1000/day $1000 $1000 + 2000
= $3000
additional direct cost
of $3000 each day.
Total cost $1,500 $35000
8
Paraphrase This Document
Need a fresh take? Get an instant paraphrase of this document with our AI Paraphraser

CONCLUSION
From the above study it can be concluded that critical path for activities is 1-3-4-5. The
additional direct cost is 10500. total cost will be increase from $30000 to $45500
9
From the above study it can be concluded that critical path for activities is 1-3-4-5. The
additional direct cost is 10500. total cost will be increase from $30000 to $45500
9

REFERENCES
Books and Journals
Bingham, E. and Gibson Jr, G.E., 2016. Infrastructure Project Scope Definition Using Project
Definition Rating Index. Journal of Management in Engineering. 13(2). p.04016037.
Burke, R., 2013. Project management: planning and control techniques. New Jersey, USA
Online
Critical path analysis. 2012. [PDF]. Available through:
<http://www.icaiknowledgegateway.org/littledms/folder1/chapter-13-critical-path-
analysis-pm.pdf>
10
⊘ This is a preview!⊘
Do you want full access?
Subscribe today to unlock all pages.

Trusted by 1+ million students worldwide
1 out of 12
Related Documents

Your All-in-One AI-Powered Toolkit for Academic Success.
 +13062052269
info@desklib.com
Available 24*7 on WhatsApp / Email
Unlock your academic potential
Copyright © 2020–2025 A2Z Services. All Rights Reserved. Developed and managed by ZUCOL.