University Statistics Assignment: Probability and Sampling
VerifiedAdded on 2022/08/10
|7
|928
|452
Homework Assignment
AI Summary
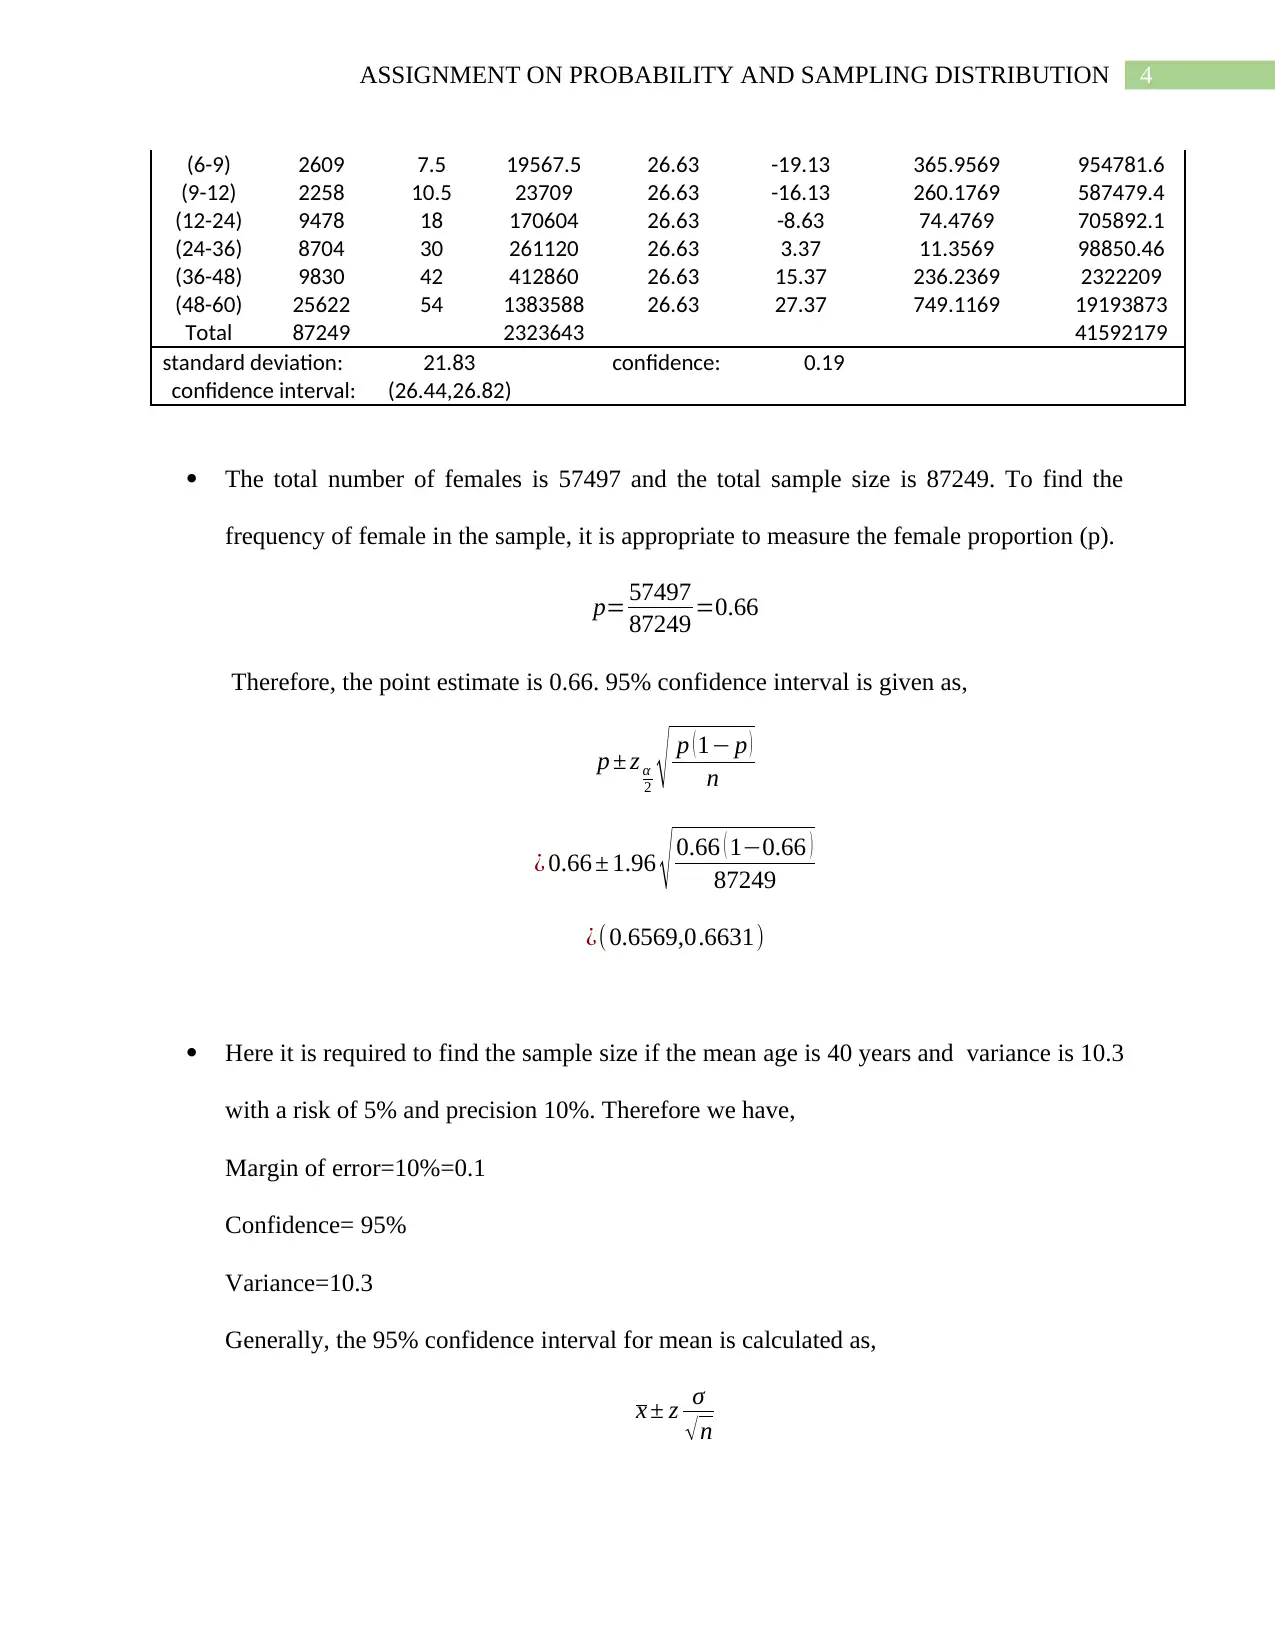
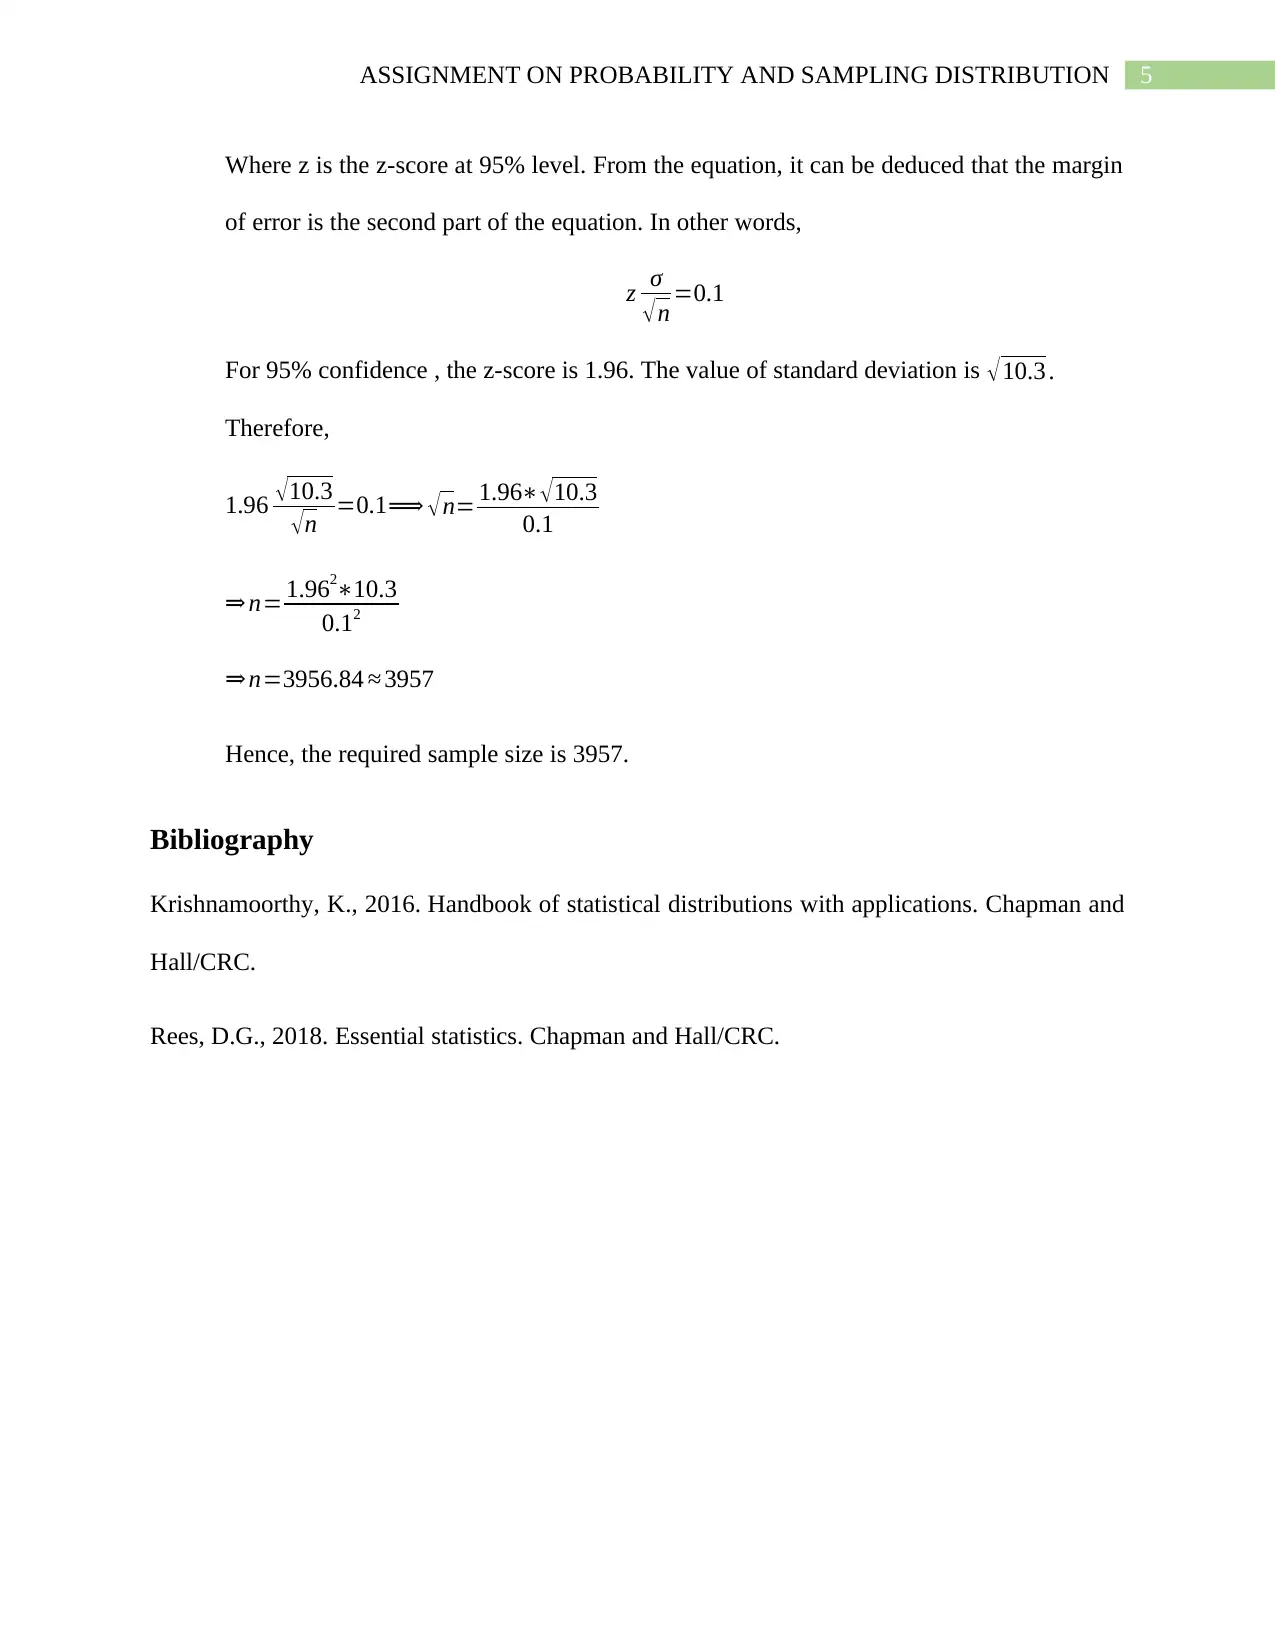
This assignment provides solutions to a statistics homework focusing on probability and sampling distributions. The problems cover various statistical concepts, including the binomial distribution, normal distribution, and Poisson distribution. The first problem calculates the probability of observing no basophil granulocytes in a sample of leucocytes. The second problem addresses the probability of a certain number of individuals contracting a disease based on a Poisson distribution. The third problem involves analyzing blood test results using a normal distribution to determine the proportion of children with results above or below certain thresholds. The fourth problem focuses on confidence intervals, calculating them for the duration of anxiolytic treatment and estimating sample sizes based on given parameters. The assignment also includes calculations for confidence intervals of age and treatment duration. Finally, the solution provides references to relevant statistical literature.

Running Head: ASSIGNMENT ON PROBABILITY AND SAMPLING DISTRIBUTION
ASSIGNMENT ON PROBABILITY AND SAMPLING DISTRIBUTION
Name of the Student:
Name of the University:
Author Note:
ASSIGNMENT ON PROBABILITY AND SAMPLING DISTRIBUTION
Name of the Student:
Name of the University:
Author Note:
Paraphrase This Document
Need a fresh take? Get an instant paraphrase of this document with our AI Paraphraser

1ASSIGNMENT ON PROBABILITY AND SAMPLING DISTRIBUTION
Answer 1
The proportion of basophil granulocytes is 0.6 in 100 leucocytes. Using these condition, the
fraction of basophil in 300 samples is equal to 180.Hence, there are 120 leucocytes where
basophil is absent.
According to the theory, when sample size is very large, binomial is approximated to normal
distribution with mean np and variance np(1-p), n= sample size, p=probability.
Here n=300 , p=0.4.
Thus, μ=300∗0.4=120 , σ = √300∗0.4∗0.6=8.49
Therefore,
P ( X=120 )=P ( 120−0.5< X <120+0.5 ), 0.5 is the correction factor.
¿ P ( 119.5<X <120.5 ) =0.047(using normal table)
Hence, the probability of absence of basophil in 300 leucocytes is 0.047.
Answer 2
It is given that there are 10 cases of disease D in a year, on average. It was assumed that the
probability of a person living in that area affected with D is very low. Hence it can be said that
the probability distribution of disease infected person follows Poisson distribution with
parameter 10.
P ( X=x ) =e− λ λx
x ! , λ=10 , x=0,1,2, …

2ASSIGNMENT ON PROBABILITY AND SAMPLING DISTRIBUTION
Probability that there are strictly less than 3 person having this disease during one year is
calculated as,
P ( X <3 ) =P ( X=0 )+ P ( X =1 ) + P ( X=2 )
¿ 0.0028Therefore, the probability that the number of person infected with disease D strictly less
than 3 is 0.0028.
Answer 3
Here it is given that the blood test results of children below 15 years follow normal distribution
with mean 22 and variance 34.In other words, if X denotes the blood test result then,
X N ¿). The density function is,
f ( x )= 1
√2 πσ e
−(x− μ)2
2 σ2
, μ=22 , σ2=34
The proportion of children having test result higher than 25 is given as,
P ( X >25 ) =1−P ( X <25 ) =∫
−∞
25
f ( x ) dx=¿ ¿0.3035
That means 30.35% children have blood test result greater than 25.
The fraction of students having result less than 12 is,
P ( X <12 ) =∫
−∞
12
f ( x ) dx=¿ 0.0432 ¿
Therefore, only 4.32% children have blood test result less than 12.
⊘ This is a preview!⊘
Do you want full access?
Subscribe today to unlock all pages.

Trusted by 1+ million students worldwide

3ASSIGNMENT ON PROBABILITY AND SAMPLING DISTRIBUTION
Answer 4
The mean duration of treatment of anxiolytic use is 12 months and variance=20.5. The
95% confidence interval of treatment duration is given by
Confidence Interval=mean ±confidence
Which is equal to 12 ±0.03
Therefore, the 95% fluctuation interval for duration of treatment is (11.97, 12.03).
The proportion of female in total French population is 0.52. In the given data, the total
sample size is 87249. Using this fraction, the expected number of females in the sample
will be 87249∗0.52=45369.5≈ 45370.
The estimate of mean age is 50.06 years. A 90% confidence interval for the mean age is
(49.95, 50.17). The necessary calculations are given below:
Age x f xf Mean(m) x-m (x-m)^2 f*(x-m)^2
(0-20) 10 4321 43210 50.06 -40.06 1604.5190 6933127
(20-30) 25 9699 242475 50.06 -25.06 628.0036 6091007
(30-40) 35 14332 501620 50.06 -15.06 226.8036 3250549
(40-50) 45 16250 731250 50.06 -5.06 25.6036 416058.5
(50-60) 55 15876 873180 50.00 5.00 25.0000 396900
(60-70) 65 10773 700245 50.06 14.94 223.2036 2404572
(70-80) 75 9875 740625 50.06 24.94 622.0036 6142286
(80-90) 85 5305 450925 50.06 34.94 1220.8036 6476363
(90-115) 102.5 818 83845 50.06 52.44 2749.9536 2249462
Total 87249 4367375 34360324
Standard Deviation: 19.84 Confidence: 0.11
Confidence interval= (49.95,50.17)
The mean duration of treatment is 26.63 months . A 99% confidence interval is
(26.44,26.82). The relevant calculations are given below,
Duration f x xf mean=m x-m (x-m)^2 f*(x-m)^2
(0-3) 25724 1.5 38586 26.63 -25.13 631.6331 16248129
(3-6) 3024 4.5 13608 26.63 -22.13 489.7369 1480964
Paraphrase This Document
Need a fresh take? Get an instant paraphrase of this document with our AI Paraphraser

4ASSIGNMENT ON PROBABILITY AND SAMPLING DISTRIBUTION
(6-9) 2609 7.5 19567.5 26.63 -19.13 365.9569 954781.6
(9-12) 2258 10.5 23709 26.63 -16.13 260.1769 587479.4
(12-24) 9478 18 170604 26.63 -8.63 74.4769 705892.1
(24-36) 8704 30 261120 26.63 3.37 11.3569 98850.46
(36-48) 9830 42 412860 26.63 15.37 236.2369 2322209
(48-60) 25622 54 1383588 26.63 27.37 749.1169 19193873
Total 87249 2323643 41592179
standard deviation: 21.83 confidence: 0.19
confidence interval: (26.44,26.82)
The total number of females is 57497 and the total sample size is 87249. To find the
frequency of female in the sample, it is appropriate to measure the female proportion (p).
p= 57497
87249 =0.66
Therefore, the point estimate is 0.66. 95% confidence interval is given as,
p ± z α
2 √ p (1− p )
n
¿ 0.66 ± 1.96 √ 0.66 ( 1−0.66 )
87249
¿( 0.6569,0.6631)
Here it is required to find the sample size if the mean age is 40 years and variance is 10.3
with a risk of 5% and precision 10%. Therefore we have,
Margin of error=10%=0.1
Confidence= 95%
Variance=10.3
Generally, the 95% confidence interval for mean is calculated as,
x ± z σ
√n

5ASSIGNMENT ON PROBABILITY AND SAMPLING DISTRIBUTION
Where z is the z-score at 95% level. From the equation, it can be deduced that the margin
of error is the second part of the equation. In other words,
z σ
√ n =0.1
For 95% confidence , the z-score is 1.96. The value of standard deviation is √10.3 .
Therefore,
1.96 √ 10.3
√ n =0.1⟹ √n= 1.96∗ √10.3
0.1
⇒ n= 1.962∗10.3
0.12
⇒ n=3956.84 ≈ 3957
Hence, the required sample size is 3957.
Bibliography
Krishnamoorthy, K., 2016. Handbook of statistical distributions with applications. Chapman and
Hall/CRC.
Rees, D.G., 2018. Essential statistics. Chapman and Hall/CRC.
⊘ This is a preview!⊘
Do you want full access?
Subscribe today to unlock all pages.

Trusted by 1+ million students worldwide

6ASSIGNMENT ON PROBABILITY AND SAMPLING DISTRIBUTION
1 out of 7
Related Documents

Your All-in-One AI-Powered Toolkit for Academic Success.
+13062052269
info@desklib.com
Available 24*7 on WhatsApp / Email
Unlock your academic potential
Copyright © 2020–2025 A2Z Services. All Rights Reserved. Developed and managed by ZUCOL.