Probability, Statistics and Quality Control - Assignment 1 Solution
VerifiedAdded on 2023/06/09
|9
|1113
|117
Homework Assignment
AI Summary
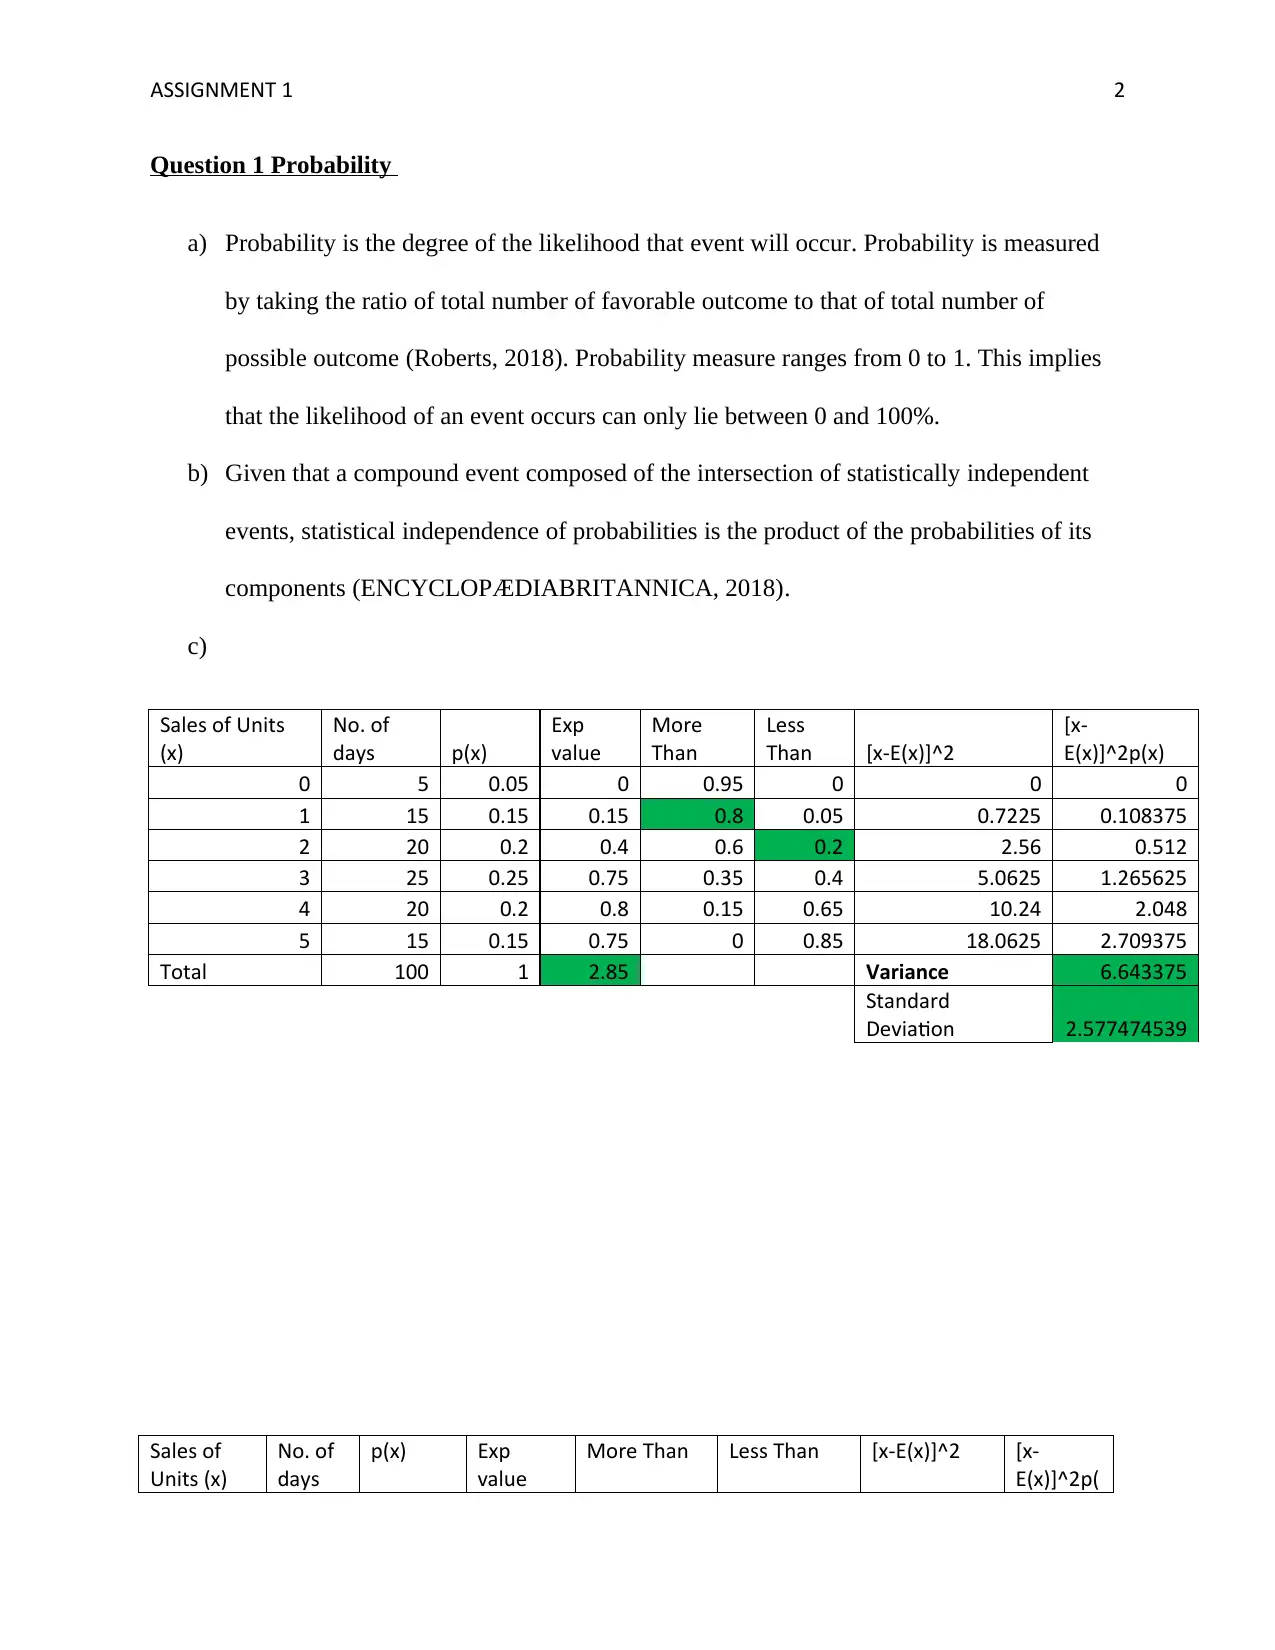
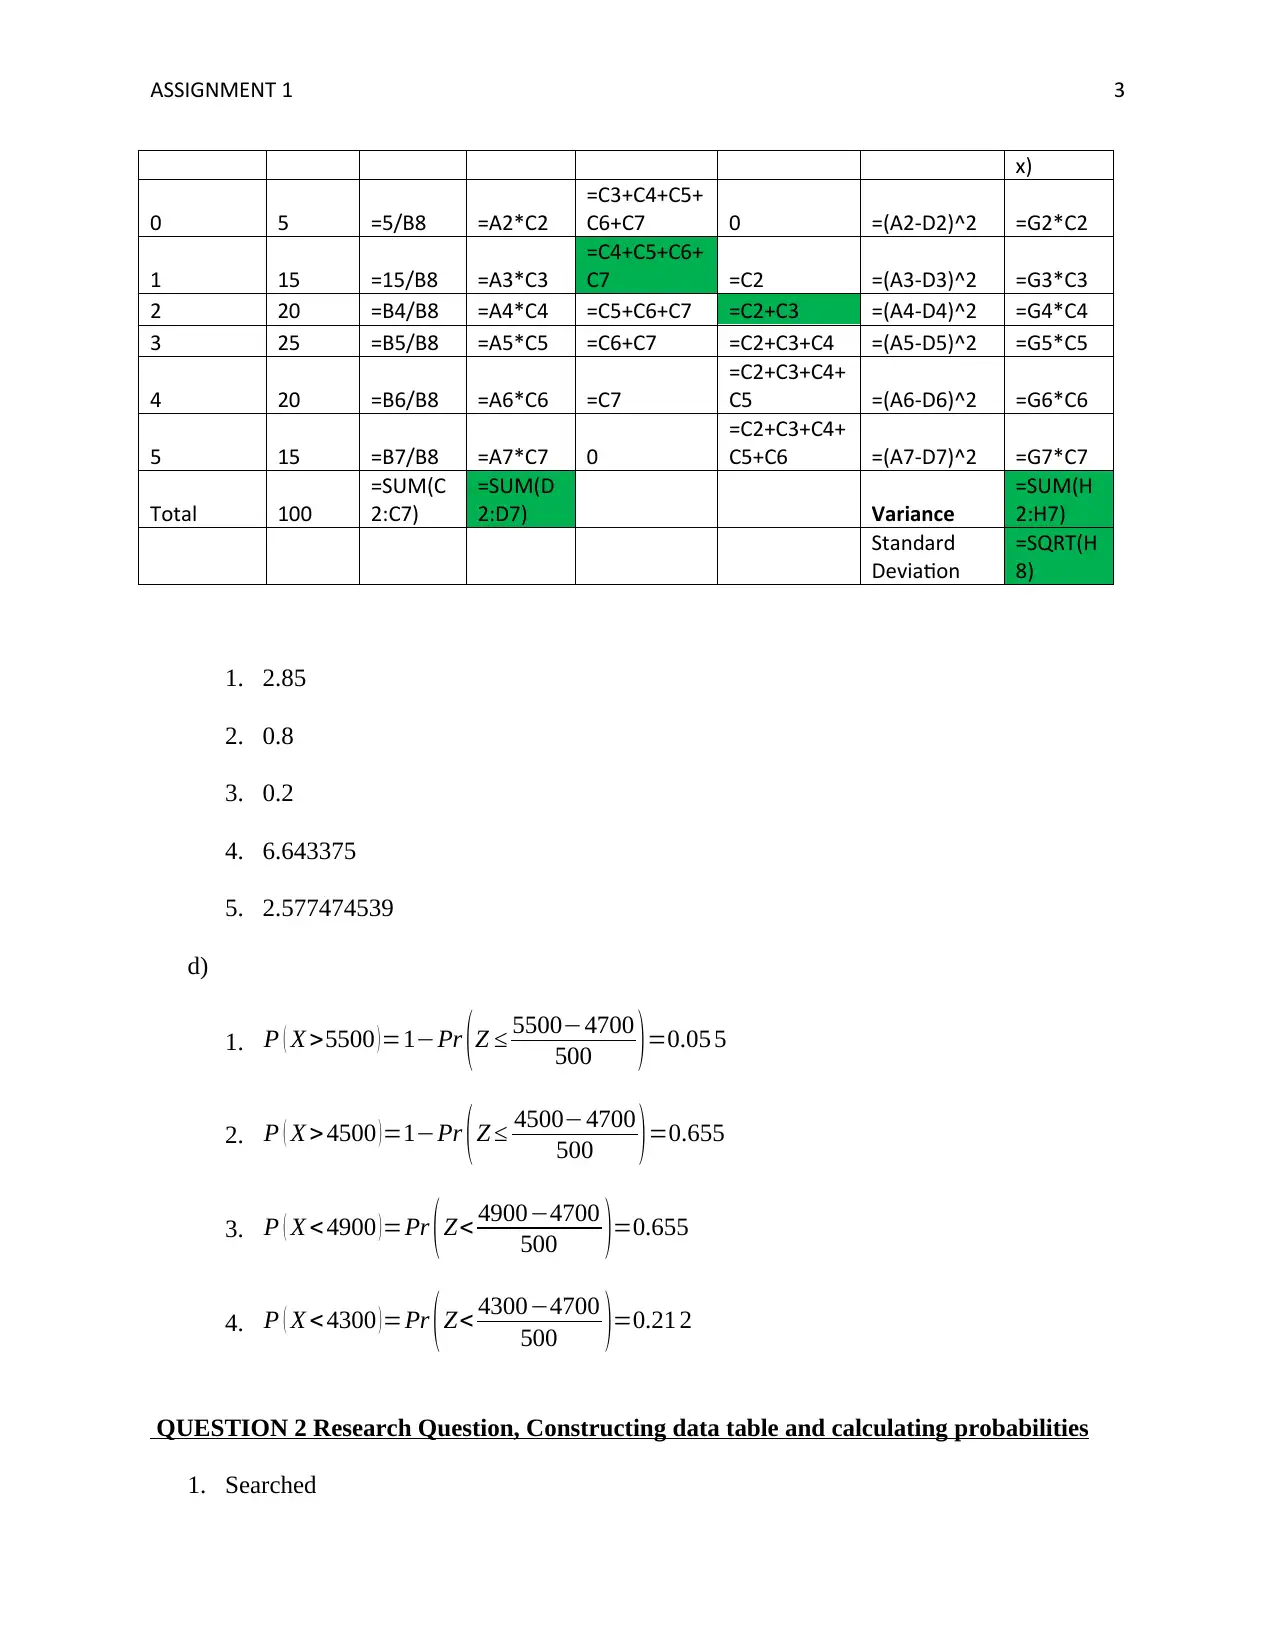
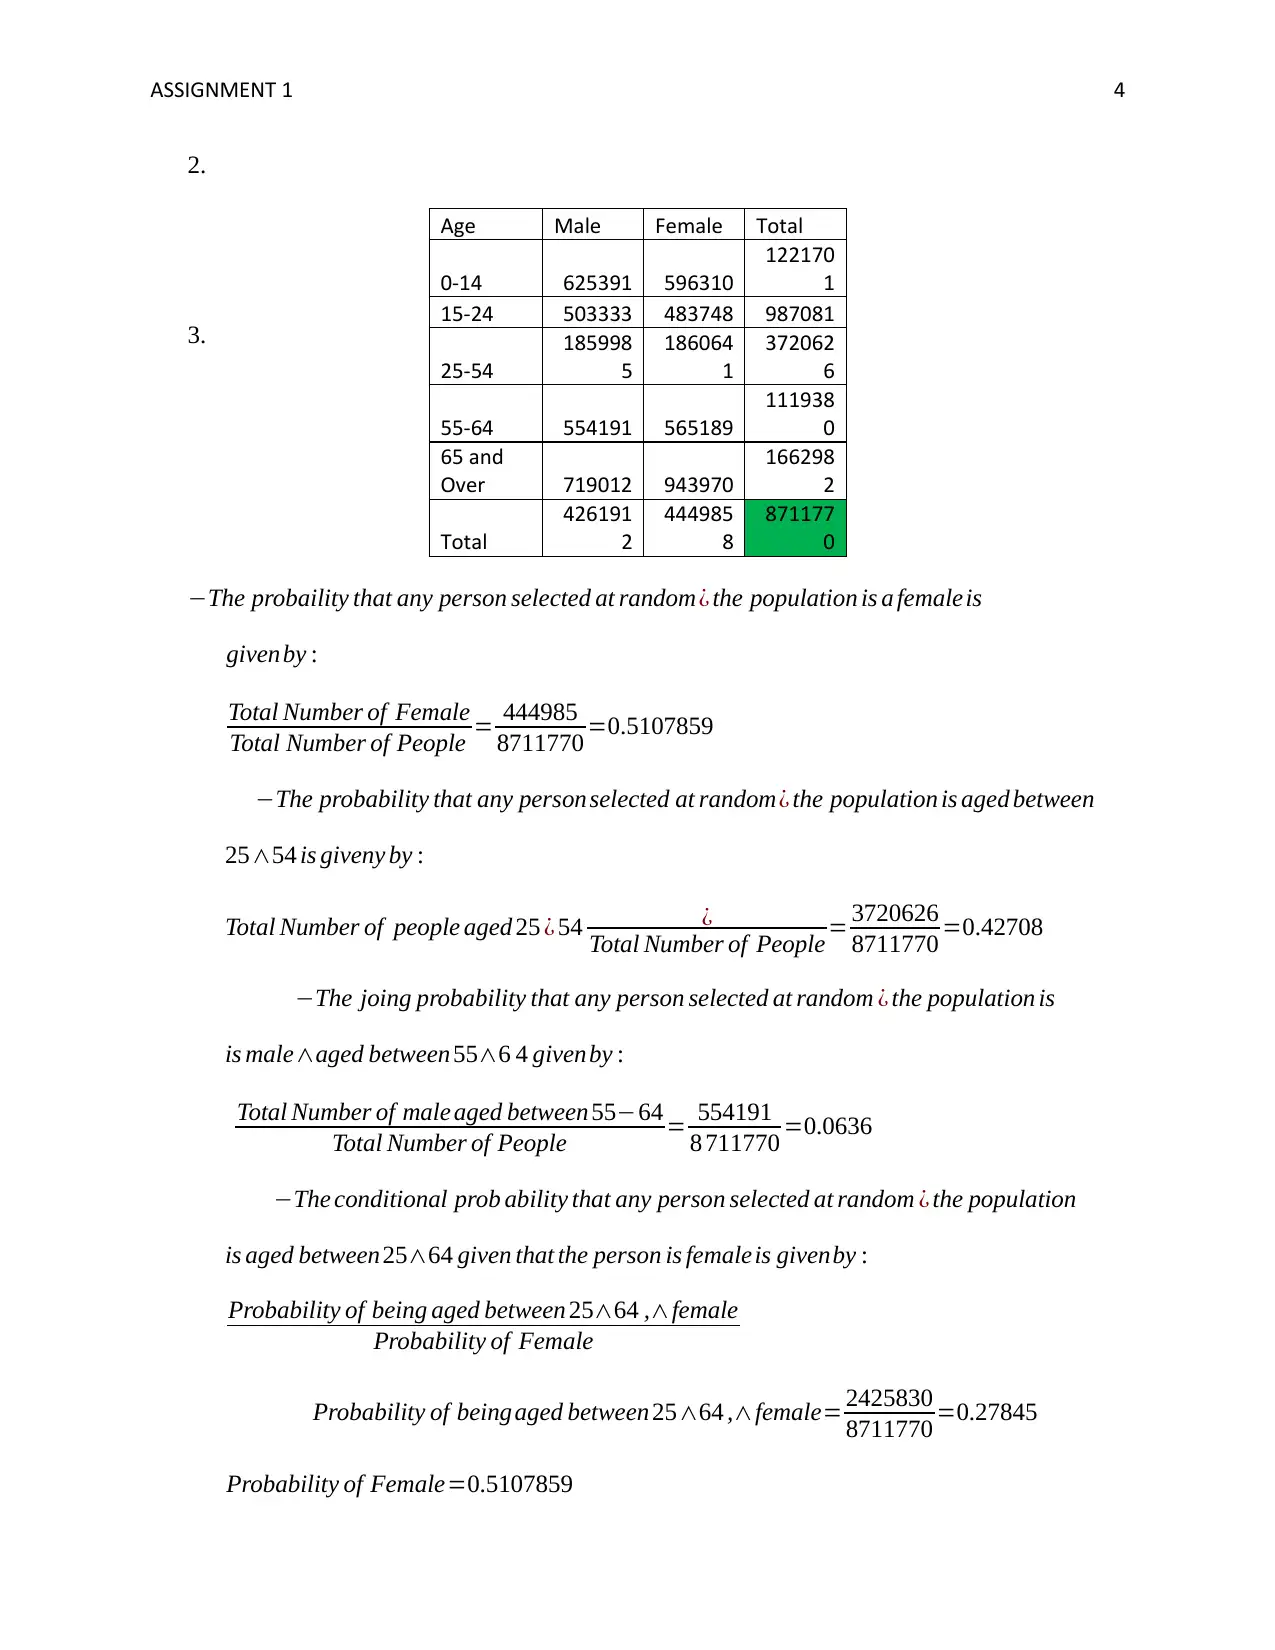
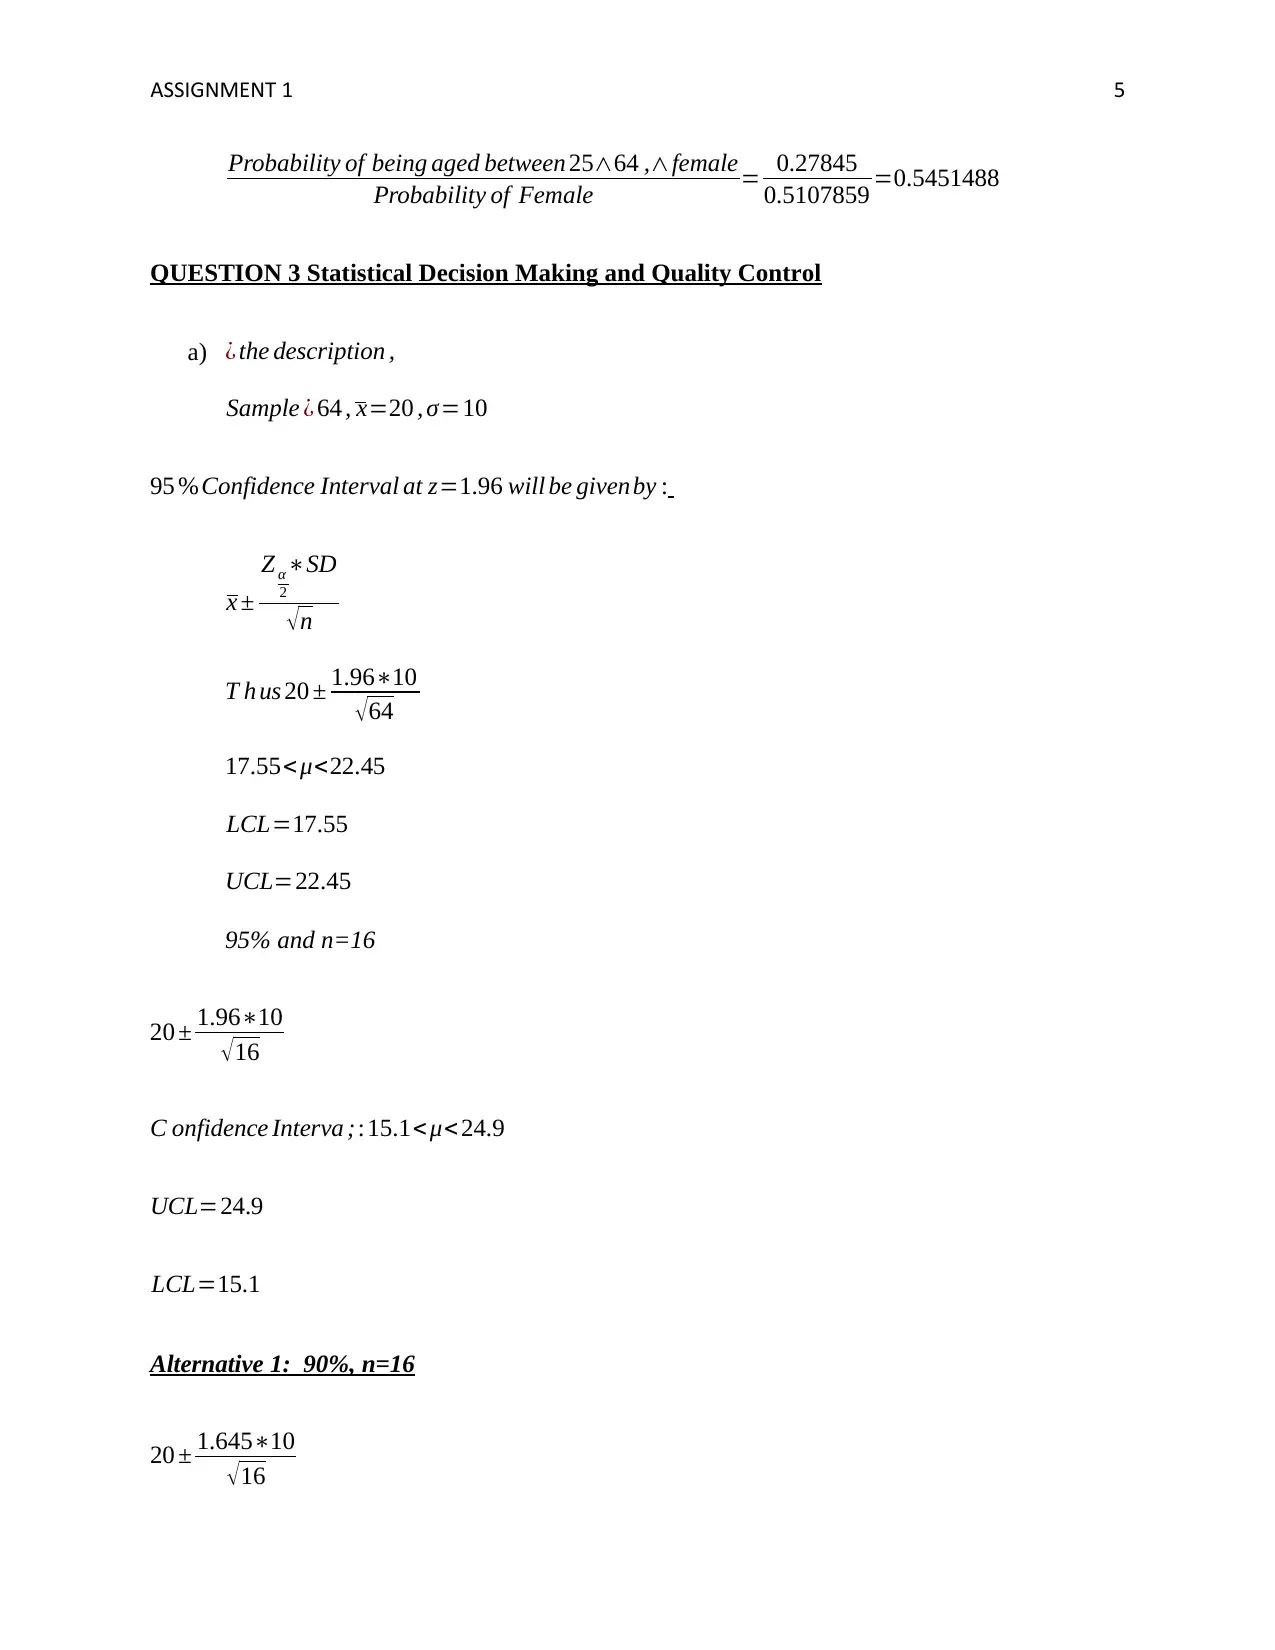
This assignment covers key concepts in probability and statistics, including the definition and measurement of probability, statistical independence, and quality control. It involves calculating probabilities related to sourdough bread sales, constructing data tables, and making statistical decisions based on confidence intervals and hypothesis testing. The assignment also includes practical applications such as determining confidence intervals for sample means and conducting hypothesis tests to assess claims about population parameters. The solutions demonstrate the application of statistical methods to real-world scenarios, providing insights into data analysis and decision-making processes. Desklib offers a wide range of study tools and resources, including past papers and solved assignments, to support students in their academic endeavors.

Running head: ASSIGNMENT 1 1
Paraphrase This Document
Need a fresh take? Get an instant paraphrase of this document with our AI Paraphraser

ASSIGNMENT 1 2
Question 1 Probability
a) Probability is the degree of the likelihood that event will occur. Probability is measured
by taking the ratio of total number of favorable outcome to that of total number of
possible outcome (Roberts, 2018). Probability measure ranges from 0 to 1. This implies
that the likelihood of an event occurs can only lie between 0 and 100%.
b) Given that a compound event composed of the intersection of statistically independent
events, statistical independence of probabilities is the product of the probabilities of its
components (ENCYCLOPÆDIABRITANNICA, 2018).
c)
Sales of Units
(x)
No. of
days p(x)
Exp
value
More
Than
Less
Than [x-E(x)]^2
[x-
E(x)]^2p(x)
0 5 0.05 0 0.95 0 0 0
1 15 0.15 0.15 0.8 0.05 0.7225 0.108375
2 20 0.2 0.4 0.6 0.2 2.56 0.512
3 25 0.25 0.75 0.35 0.4 5.0625 1.265625
4 20 0.2 0.8 0.15 0.65 10.24 2.048
5 15 0.15 0.75 0 0.85 18.0625 2.709375
Total 100 1 2.85 Variance 6.643375
Standard
Deviation 2.577474539
Sales of
Units (x)
No. of
days
p(x) Exp
value
More Than Less Than [x-E(x)]^2 [x-
E(x)]^2p(

ASSIGNMENT 1 3
x)
0 5 =5/B8 =A2*C2
=C3+C4+C5+
C6+C7 0 =(A2-D2)^2 =G2*C2
1 15 =15/B8 =A3*C3
=C4+C5+C6+
C7 =C2 =(A3-D3)^2 =G3*C3
2 20 =B4/B8 =A4*C4 =C5+C6+C7 =C2+C3 =(A4-D4)^2 =G4*C4
3 25 =B5/B8 =A5*C5 =C6+C7 =C2+C3+C4 =(A5-D5)^2 =G5*C5
4 20 =B6/B8 =A6*C6 =C7
=C2+C3+C4+
C5 =(A6-D6)^2 =G6*C6
5 15 =B7/B8 =A7*C7 0
=C2+C3+C4+
C5+C6 =(A7-D7)^2 =G7*C7
Total 100
=SUM(C
2:C7)
=SUM(D
2:D7) Variance
=SUM(H
2:H7)
Standard
Deviation
=SQRT(H
8)
1. 2.85
2. 0.8
3. 0.2
4. 6.643375
5. 2.577474539
d)
1. P ( X >5500 ) =1−Pr ( Z ≤ 5500−4700
500 ) =0.05 5
2. P ( X > 4500 )=1−Pr (Z ≤ 4500−4700
500 )=0.655
3. P ( X < 4900 )=Pr (Z< 4900−4700
500 )=0.655
4. P ( X < 4300 )=Pr (Z< 4300−4700
500 )=0.21 2
QUESTION 2 Research Question, Constructing data table and calculating probabilities
1. Searched
⊘ This is a preview!⊘
Do you want full access?
Subscribe today to unlock all pages.

Trusted by 1+ million students worldwide

ASSIGNMENT 1 4
2.
3.
−The probaility that any person selected at random¿ the population is a femaleis
givenby :
Total Number of Female
Total Number of People = 444985
8711770 =0.5107859
−The probability that any person selected at random¿ the population is aged between
25∧54 is giveny by :
Total Number of people aged 25 ¿ 54 ¿
Total Number of People = 3720626
8711770 =0.42708
−The joing probability that any person selected at random ¿ the population is
is male∧aged between 55∧6 4 givenby :
Total Number of male aged between 55−64
Total Number of People = 554191
8 711770 =0.0636
−The conditional prob ability that any person selected at random ¿ the population
is aged between 25∧64 given that the person is femaleis givenby :
Probability of being aged between 25∧64 ,∧female
Probability of Female
Probability of beingaged between 25∧64 ,∧female= 2425830
8711770 =0.27845
Probability of Female=0.5107859
Age Male Female Total
0-14 625391 596310
122170
1
15-24 503333 483748 987081
25-54
185998
5
186064
1
372062
6
55-64 554191 565189
111938
0
65 and
Over 719012 943970
166298
2
Total
426191
2
444985
8
871177
0
Paraphrase This Document
Need a fresh take? Get an instant paraphrase of this document with our AI Paraphraser

ASSIGNMENT 1 5
Probability of being aged between 25∧64 ,∧female
Probability of Female = 0.27845
0.5107859 =0.5451488
QUESTION 3 Statistical Decision Making and Quality Control
a) ¿ the description ,
Sample ¿ 64 , x=20 , σ=10
95 %Confidence Interval at z=1.96 will be givenby :
x ±
Z α
2
∗SD
√n
T h us 20 ± 1.96∗10
√64
17.55<μ<22.45
LCL=17.55
UCL=22.45
95% and n=16
20 ± 1.96∗10
√ 16
C onfidence Interva ;:15.1< μ<24.9
UCL=24.9
LCL=15.1
Alternative 1: 90%, n=16
20 ± 1.645∗10
√16

ASSIGNMENT 1 6
15.89<μ<24.11
Alternative 2: 95%, n=64
x ±
Z α
2
∗SD
√n
T h us 20 ± 1.96∗10
√64
17.55<μ<22.45
Alternative 3: 95% and n=36
20 ± 1.96∗10
√ 36
CI :16.73< μ<23.27
Thus the second alternative will produce the narrowest control limits. That is, 95% and n=64.
b)
1. Ho : μ ≤5.5
Ha : μ>5.5
2. x=5.8 σ =2.4 , n=64 ,∧α =0.05
Applying normal distribution,
Z= x −μ
σ
√n
=5.8−5.5
2.4
√64
= 0.3
0.3 =1
P ( Z <1 )=0.8413
⊘ This is a preview!⊘
Do you want full access?
Subscribe today to unlock all pages.

Trusted by 1+ million students worldwide

ASSIGNMENT 1 7
3. Since the 0.8413 is greater 0.05, there is no significant evidence to reject the null
hypothesis. Thus we conclude that the mean distance from home to the nearest fire
station is within 5.5km.
4. Sketch
3. Since the 0.8413 is greater 0.05, there is no significant evidence to reject the null
hypothesis. Thus we conclude that the mean distance from home to the nearest fire
station is within 5.5km.
4. Sketch
Paraphrase This Document
Need a fresh take? Get an instant paraphrase of this document with our AI Paraphraser

ASSIGNMENT 1 8
References
ENCYCLOPÆDIABRITANNICA. (2018). Statistical independence. Retrieved August 1, 2018,
from ENCYCLOPÆDIA BRITANNICA: https://www.britannica.com/topic/statistical-
independence
Feller, W. (2016). An Introduction to Probability Theory and Its Applications. New York: Wiley.
IndexMundi. (2018, January 20). Australia Age structure. Retrieved 8 2, 2018, from Index
Mundi: https://www.indexmundi.com/australia/age_structure.html
PopulationPyramid.com. (2017). Population Pyramids of the World from 1950 to 2100.
Retrieved 8 1, 2018, from Population Pyramid:
https://www.populationpyramid.net/australia/2017/
Roberts, D. (2018, January). Basic Concepts of Probability. Retrieved August 1, 2018, from
Maths Bits: https://mathbitsnotebook.com/Geometry/Probability/PBIntroduction.html
Rozanov, Y. (2018). Probability Theory: A Concise Course. London: Dover Publications.
Taylor, J. (2016). An Introduction to Measure and Probability. Springer: New York.
Tijms, H. Understanding Probability. Oxford.

ASSIGNMENT 1 9
⊘ This is a preview!⊘
Do you want full access?
Subscribe today to unlock all pages.

Trusted by 1+ million students worldwide
1 out of 9
Related Documents

Your All-in-One AI-Powered Toolkit for Academic Success.
+13062052269
info@desklib.com
Available 24*7 on WhatsApp / Email
Unlock your academic potential
Copyright © 2020–2025 A2Z Services. All Rights Reserved. Developed and managed by ZUCOL.