Probability Assignment: Analyzing TV Watching Time and Probabilities

Verified

Added on  2019/09/30

|6
|729
|320
Homework Assignment
AI Summary
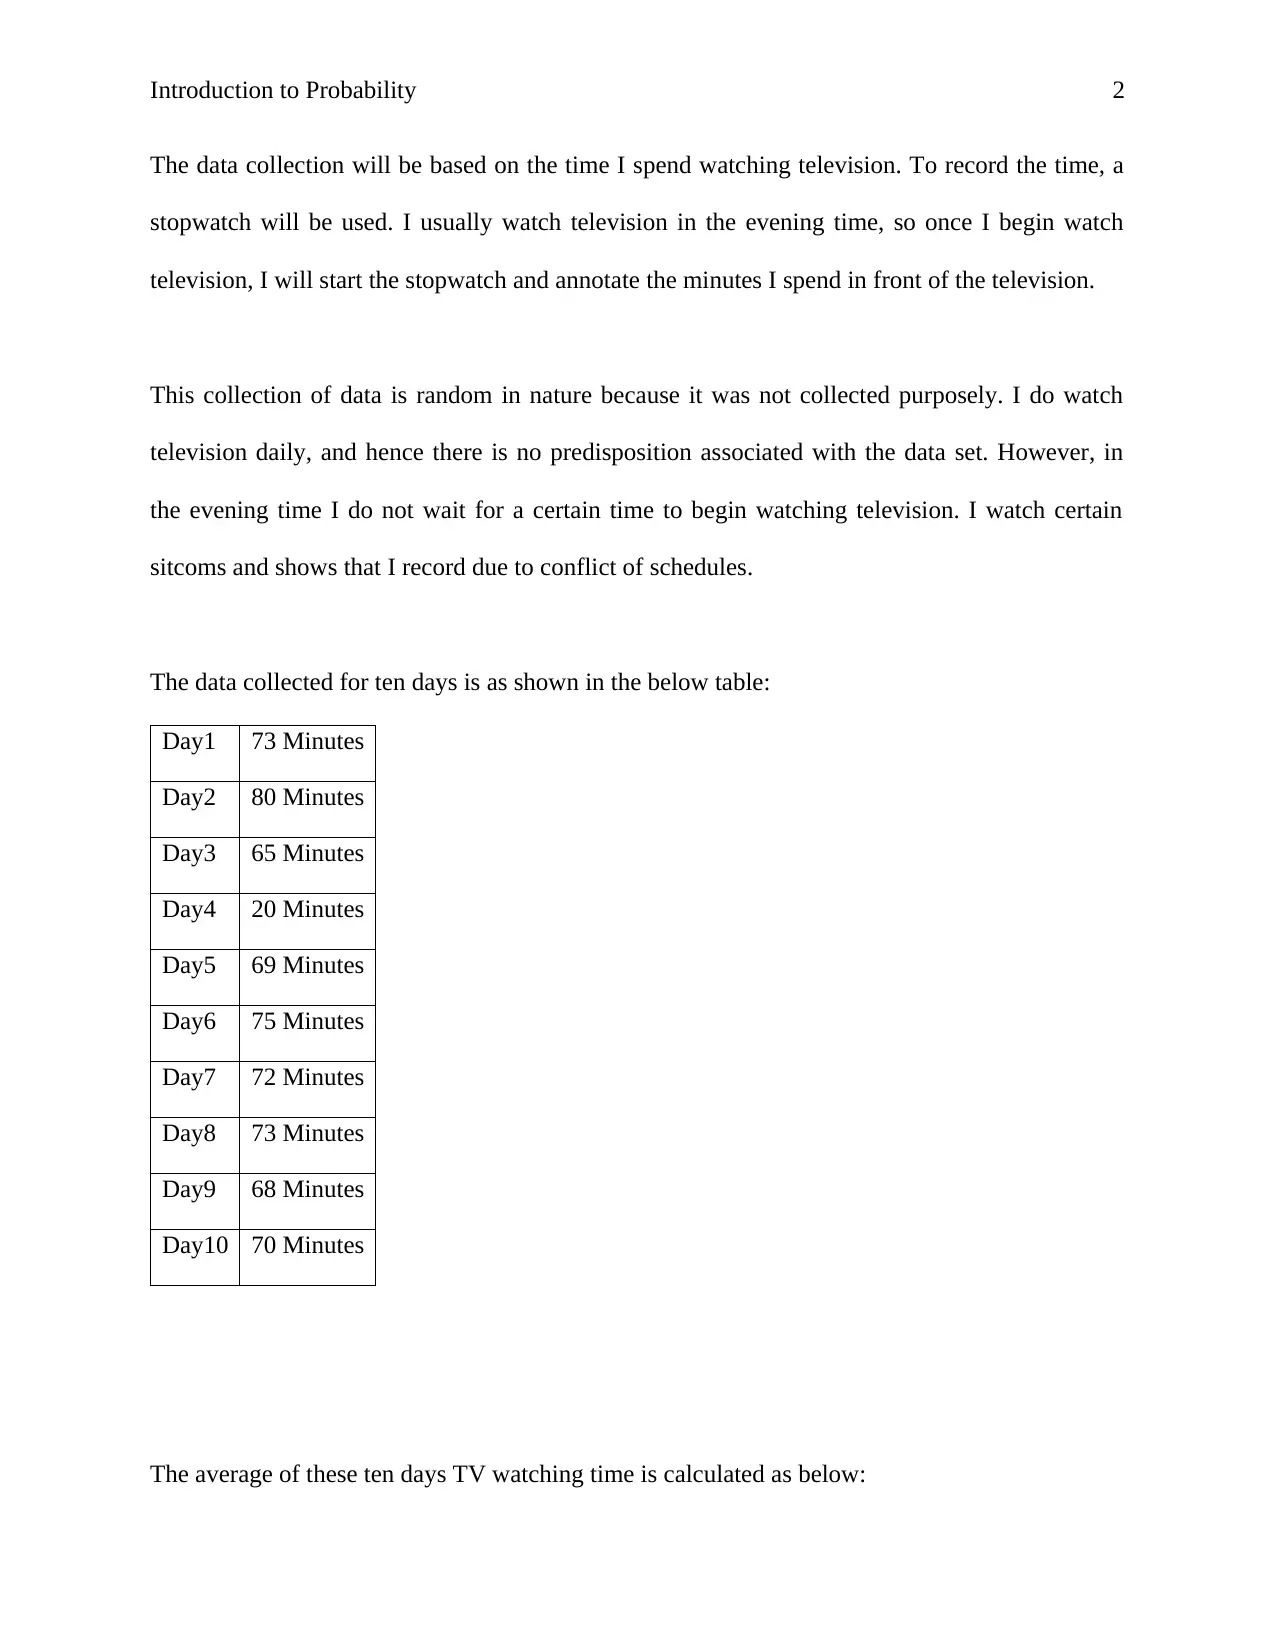
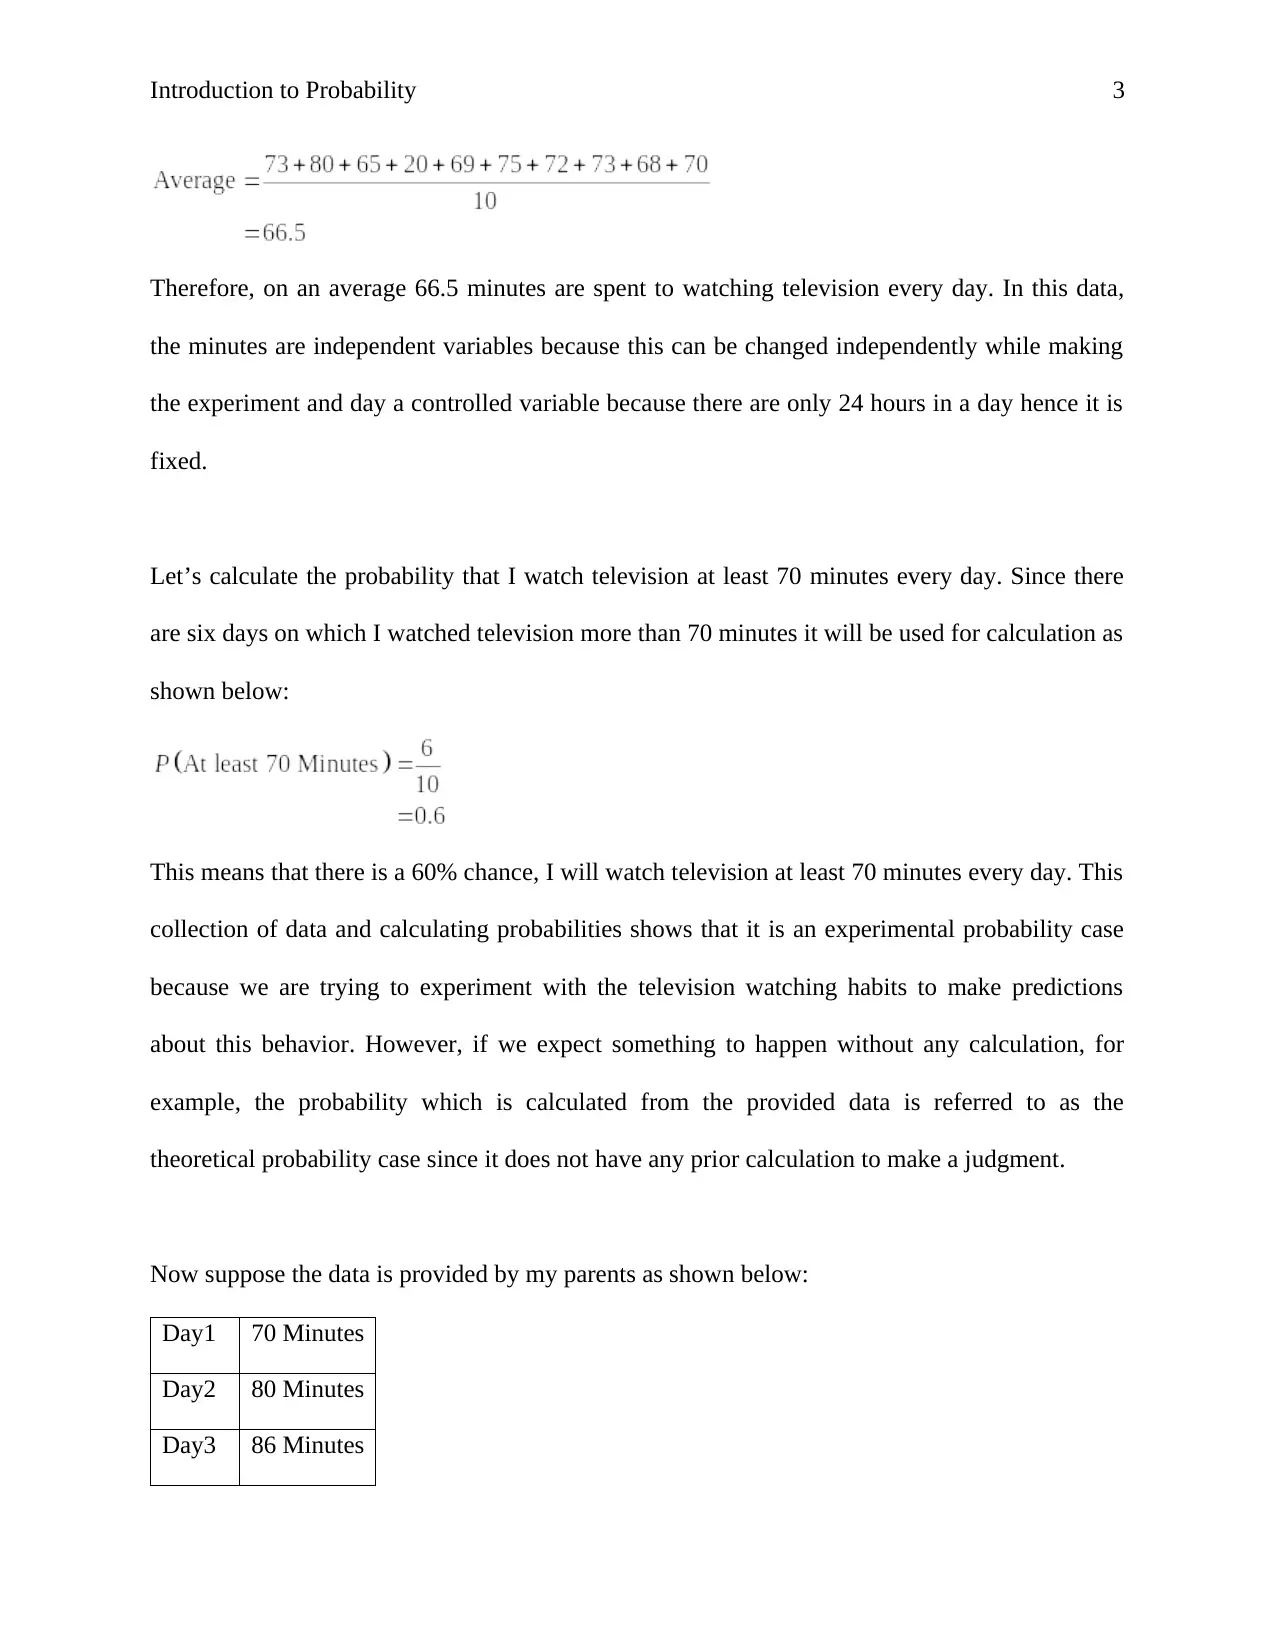
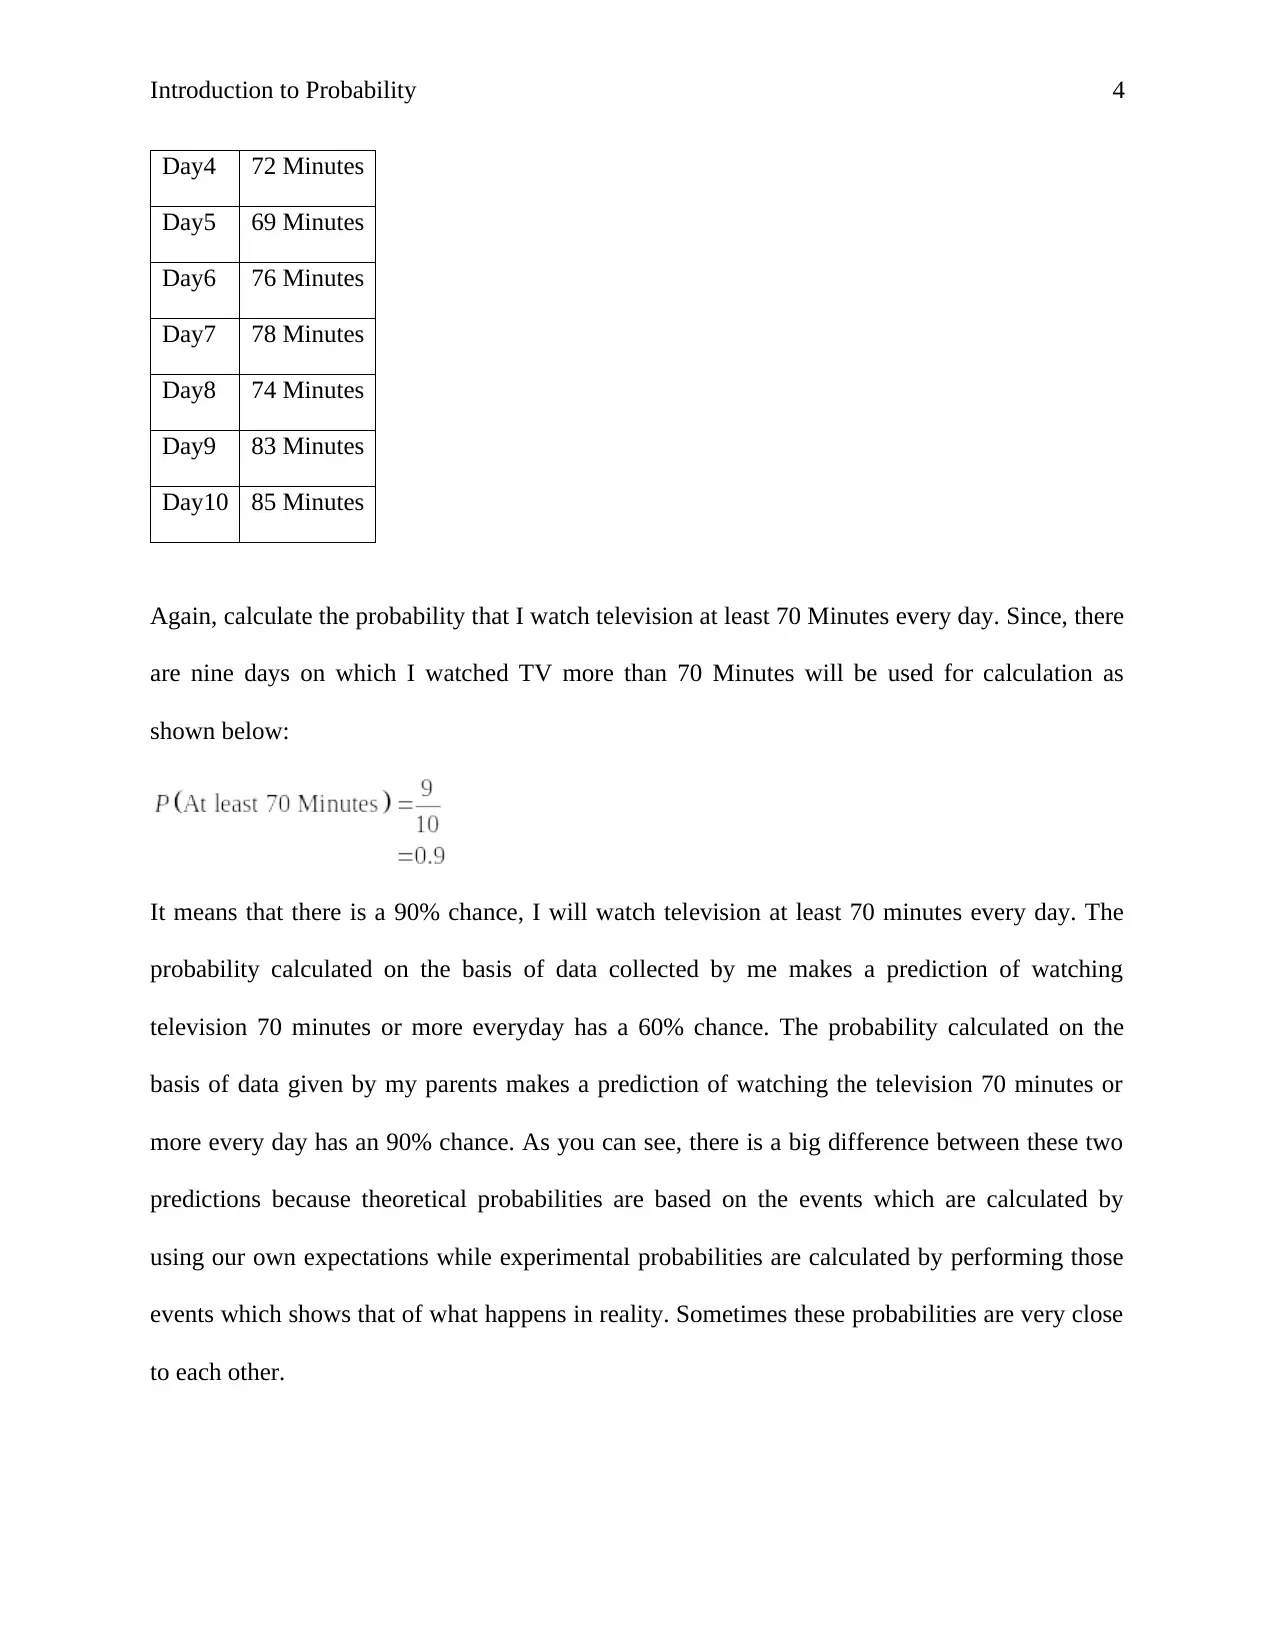
This assignment, prepared for the MAT201 Basic Statistics course, focuses on the application of probability concepts using the example of TV watching habits. The student collects data on their daily TV viewing time for ten days, calculating the average time spent watching television. The assignment then explores the probability of watching TV for at least 70 minutes daily, calculating this probability based on the student's data and then using hypothetical data provided by their parents. The core concepts of experimental and theoretical probability are explained and contrasted, highlighting how real-world observations (experimental probability) can differ from expectations (theoretical probability). The assignment concludes with a reflection on the differences between the probabilities calculated from the two datasets and emphasizes how unexpected events, such as a guest visit, can skew the data. References to relevant statistics textbooks are also included.
tabler-icon-diamond-filled.svg

Contribute Materials

Your contribution can guide someone’s learning journey. Share your documents today.
Document Page
Introduction to Probability 1
Introduction to Probability
Laura Peña-Duval
MAT201 / Basic Statistic
April 20, 2017
Professor Qian Liu
tabler-icon-diamond-filled.svg

Secure Best Marks with AI Grader

Need help grading? Try our AI Grader for instant feedback on your assignments.
Document Page
Introduction to Probability 2
The data collection will be based on the time I spend watching television. To record the time, a
stopwatch will be used. I usually watch television in the evening time, so once I begin watch
television, I will start the stopwatch and annotate the minutes I spend in front of the television.
This collection of data is random in nature because it was not collected purposely. I do watch
television daily, and hence there is no predisposition associated with the data set. However, in
the evening time I do not wait for a certain time to begin watching television. I watch certain
sitcoms and shows that I record due to conflict of schedules.
The data collected for ten days is as shown in the below table:
Day1 73 Minutes
Day2 80 Minutes
Day3 65 Minutes
Day4 20 Minutes
Day5 69 Minutes
Day6 75 Minutes
Day7 72 Minutes
Day8 73 Minutes
Day9 68 Minutes
Day10 70 Minutes
The average of these ten days TV watching time is calculated as below:
Document Page
Introduction to Probability 3
Therefore, on an average 66.5 minutes are spent to watching television every day. In this data,
the minutes are independent variables because this can be changed independently while making
the experiment and day a controlled variable because there are only 24 hours in a day hence it is
fixed.
Let’s calculate the probability that I watch television at least 70 minutes every day. Since there
are six days on which I watched television more than 70 minutes it will be used for calculation as
shown below:
This means that there is a 60% chance, I will watch television at least 70 minutes every day. This
collection of data and calculating probabilities shows that it is an experimental probability case
because we are trying to experiment with the television watching habits to make predictions
about this behavior. However, if we expect something to happen without any calculation, for
example, the probability which is calculated from the provided data is referred to as the
theoretical probability case since it does not have any prior calculation to make a judgment.
Now suppose the data is provided by my parents as shown below:
Day1 70 Minutes
Day2 80 Minutes
Day3 86 Minutes
Document Page
Introduction to Probability 4
Day4 72 Minutes
Day5 69 Minutes
Day6 76 Minutes
Day7 78 Minutes
Day8 74 Minutes
Day9 83 Minutes
Day10 85 Minutes
Again, calculate the probability that I watch television at least 70 Minutes every day. Since, there
are nine days on which I watched TV more than 70 Minutes will be used for calculation as
shown below:
It means that there is a 90% chance, I will watch television at least 70 minutes every day. The
probability calculated on the basis of data collected by me makes a prediction of watching
television 70 minutes or more everyday has a 60% chance. The probability calculated on the
basis of data given by my parents makes a prediction of watching the television 70 minutes or
more every day has an 90% chance. As you can see, there is a big difference between these two
predictions because theoretical probabilities are based on the events which are calculated by
using our own expectations while experimental probabilities are calculated by performing those
events which shows that of what happens in reality. Sometimes these probabilities are very close
to each other.
tabler-icon-diamond-filled.svg

Secure Best Marks with AI Grader

Need help grading? Try our AI Grader for instant feedback on your assignments.
Document Page
Introduction to Probability 5
The data collected by me for five days have one day with 20 minutes that is an infrequent and
occurred because a guest came to my home in the evening, cutting into my time short. This
unexpected visit made the data a bit skewed.
Document Page
Introduction to Probability 6
References
Bluman, Allan. G.(2009), Elementary Statistics. New York, NY: McGraw-Hill
Mann, Prem S.(2012), Introductory Statistics. New Jersey, NJ: John Wiley & Sons, Inc.
Rumsey, Deborah(2010), Statistics Essentials for Dummies. New Jersey, NJ: John Wiley &
Sons, Inc.
chevron_up_icon
1 out of 6
circle_padding
hide_on_mobile
zoom_out_icon
logo.png

Your All-in-One AI-Powered Toolkit for Academic Success.

Available 24*7 on WhatsApp / Email

[object Object]