2128IBA Business Processes: Process Mapping and Analysis Report
VerifiedAdded on 2023/02/01
|14
|3452
|49
Report
AI Summary
This report presents a comprehensive process mapping and analysis of the P-Bicycle Corporation, focusing on its manufacturing and service operations. It begins with an executive summary outlining the importance of process mapping in improving efficiency and customer satisfaction. The report then delves into the specific case of P-Bicycle Corporation, detailing its departmental structure and workflow, from sales and engineering to manufacturing and distribution. Relationship maps are utilized to visualize the broad connections within the business, highlighting key stakeholders and their interactions. Furthermore, the report employs cross-functional process maps to illustrate the sequence of steps, inputs, and outputs of various processes, identifying potential bottlenecks and areas for improvement. The analysis includes recommendations for streamlining processes, such as consolidating departments and improving communication between engineering and manufacturing. The report concludes with a summary of findings and suggestions for enhancing the corporation's overall performance, emphasizing the importance of customer perception and value for money.
Running head: PROCESS MAPPING AND ANALYSIS 1
Process Mapping and Analysis
Name
Institution Affiliation
Process Mapping and Analysis
Name
Institution Affiliation
Paraphrase This Document
Need a fresh take? Get an instant paraphrase of this document with our AI Paraphraser
PROCESS MAPPING AND ANALYSIS P-BICYCLE CORPORATION 2
Table of Contents Page
Title 3
Executive Summary 3
P-Bicycle Corporation Case 3
Relationship Maps 5
Cross Functional Process Maps 8
Process Analysis 11
Conclusion and Recommendations 12
References 13
Table of Contents Page
Title 3
Executive Summary 3
P-Bicycle Corporation Case 3
Relationship Maps 5
Cross Functional Process Maps 8
Process Analysis 11
Conclusion and Recommendations 12
References 13
PROCESS MAPPING AND ANALYSIS P-BICYCLE CORPORATION 3
Process Mapping and Analysis for P-Bicycle Corporation
Executive Summary
Processes are sequence of events that are used to realize outputs from various inputs.
Process mapping involves use of visual aids to illustrate the sequence of activities that aim at
delivering results to the end user and can be self generated or through interviewing. Whereas
the end users do not participate in the step by step activities of the process their perception is
derived from the outcome of the process although overall performance is determined by how
the process occurs. Process mapping improves methods that result in setting targets that are
measurable. A simple framework of improvement seeks to define the objectives of the
project, consider how to determine the improvements using various tools to measure
progress, and create teams that will create and conduct the mapping and analysis of the
process and consequently generate baselines for improvements. The top level managers have
an understanding of the end to end processes while those at the lowest level are also involved
in the process by virtue of their responsibility in the process flow.
P-Bicycle Corporation Case
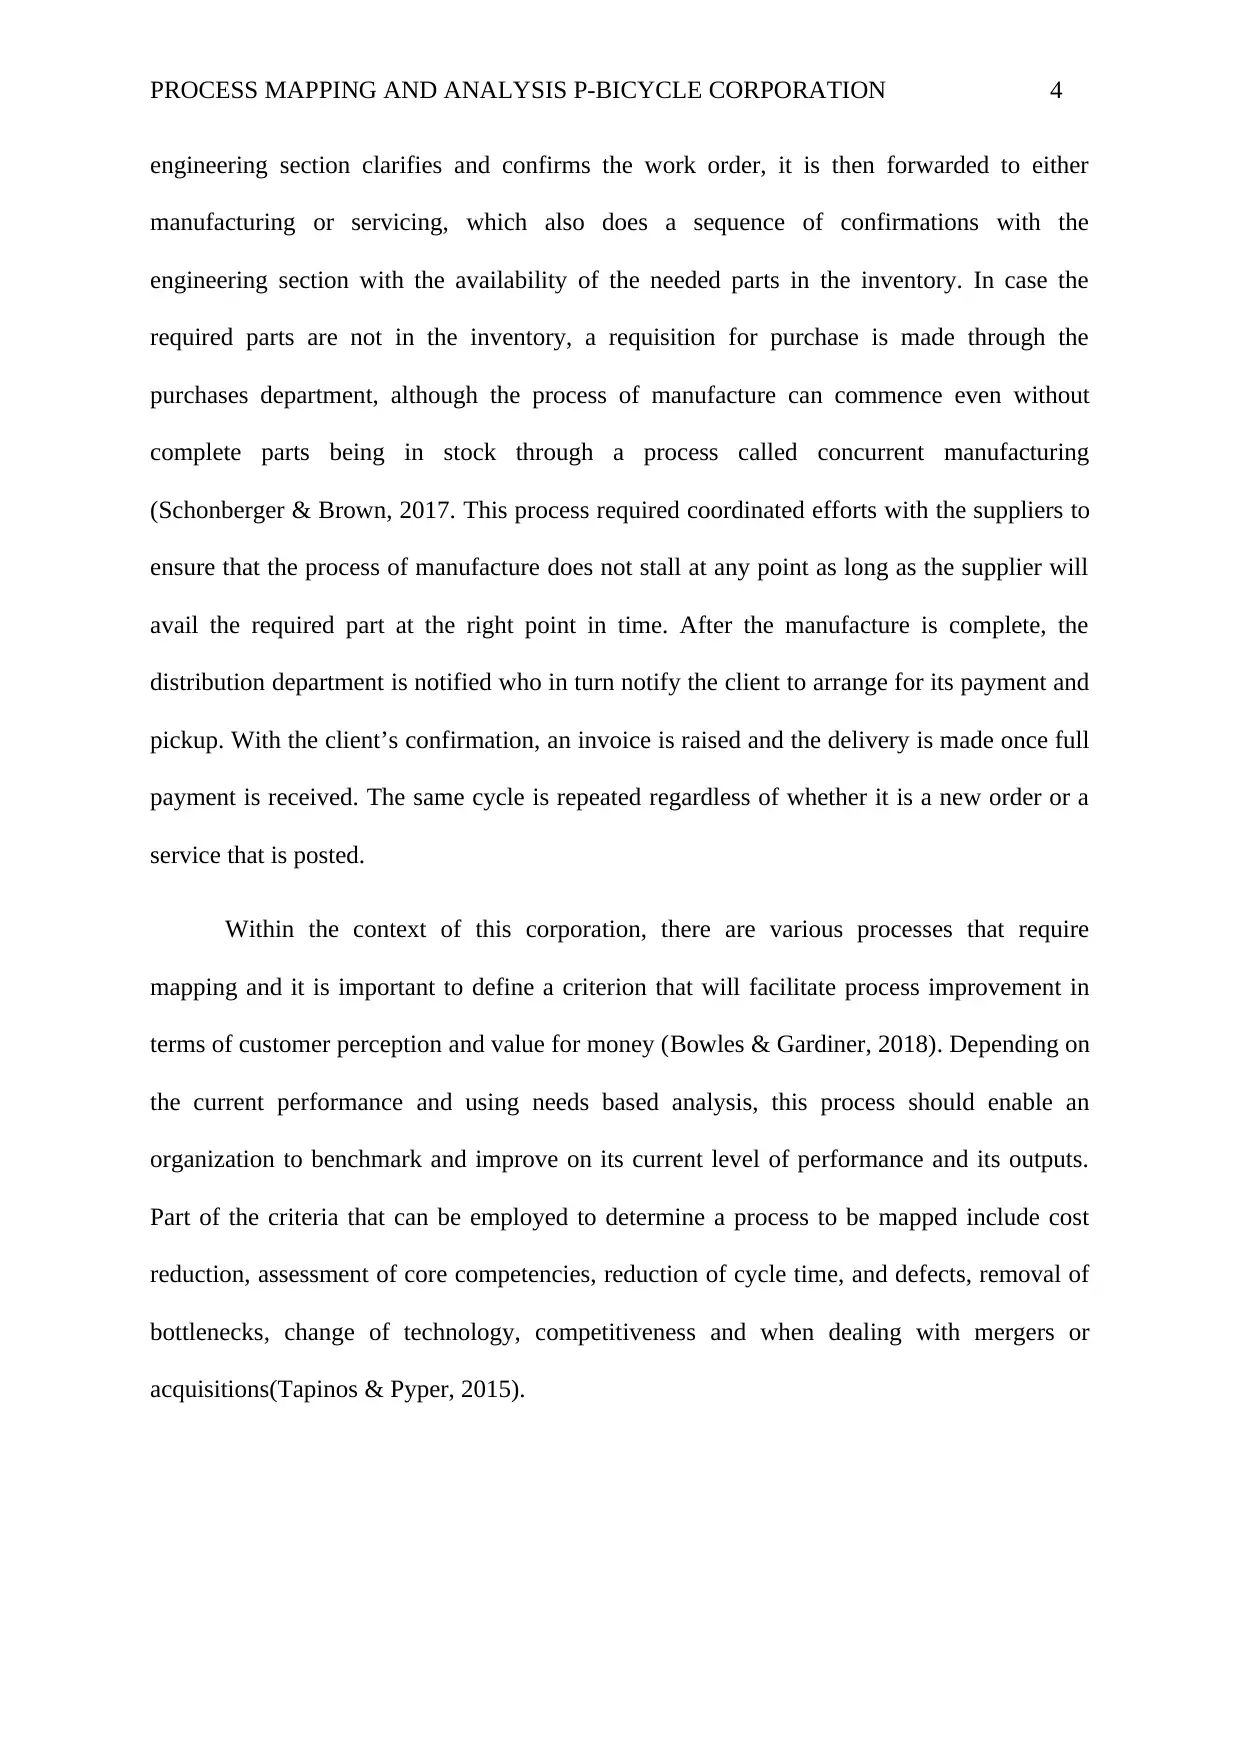
The company manufactures and services bicycles and runs under three portfolios all
operating under specific departments such as sales, engineering, servicing and manufacturing.
New job orders are handled through the sales department who take the customer requirements
and generate a work order. The work order is the basic document that initiates the event of
any process within the company. Customer approval is requested through the sales section
which then forwards the order to either the engineering or servicing section, depending on the
requirement. Verification of the work order is done by the engineering section which then
confirms the specifications and generates the details of the requirements and clarifications
with the customer is done at this stage for conformity with the specifications. Once the
Process Mapping and Analysis for P-Bicycle Corporation
Executive Summary
Processes are sequence of events that are used to realize outputs from various inputs.
Process mapping involves use of visual aids to illustrate the sequence of activities that aim at
delivering results to the end user and can be self generated or through interviewing. Whereas
the end users do not participate in the step by step activities of the process their perception is
derived from the outcome of the process although overall performance is determined by how
the process occurs. Process mapping improves methods that result in setting targets that are
measurable. A simple framework of improvement seeks to define the objectives of the
project, consider how to determine the improvements using various tools to measure
progress, and create teams that will create and conduct the mapping and analysis of the
process and consequently generate baselines for improvements. The top level managers have
an understanding of the end to end processes while those at the lowest level are also involved
in the process by virtue of their responsibility in the process flow.
P-Bicycle Corporation Case
The company manufactures and services bicycles and runs under three portfolios all
operating under specific departments such as sales, engineering, servicing and manufacturing.
New job orders are handled through the sales department who take the customer requirements
and generate a work order. The work order is the basic document that initiates the event of
any process within the company. Customer approval is requested through the sales section
which then forwards the order to either the engineering or servicing section, depending on the
requirement. Verification of the work order is done by the engineering section which then
confirms the specifications and generates the details of the requirements and clarifications
with the customer is done at this stage for conformity with the specifications. Once the
⊘ This is a preview!⊘
Do you want full access?
Subscribe today to unlock all pages.
Trusted by 1+ million students worldwide
PROCESS MAPPING AND ANALYSIS P-BICYCLE CORPORATION 4
engineering section clarifies and confirms the work order, it is then forwarded to either
manufacturing or servicing, which also does a sequence of confirmations with the
engineering section with the availability of the needed parts in the inventory. In case the
required parts are not in the inventory, a requisition for purchase is made through the
purchases department, although the process of manufacture can commence even without
complete parts being in stock through a process called concurrent manufacturing
(Schonberger & Brown, 2017. This process required coordinated efforts with the suppliers to
ensure that the process of manufacture does not stall at any point as long as the supplier will
avail the required part at the right point in time. After the manufacture is complete, the
distribution department is notified who in turn notify the client to arrange for its payment and
pickup. With the client’s confirmation, an invoice is raised and the delivery is made once full
payment is received. The same cycle is repeated regardless of whether it is a new order or a
service that is posted.
Within the context of this corporation, there are various processes that require
mapping and it is important to define a criterion that will facilitate process improvement in
terms of customer perception and value for money (Bowles & Gardiner, 2018). Depending on
the current performance and using needs based analysis, this process should enable an
organization to benchmark and improve on its current level of performance and its outputs.
Part of the criteria that can be employed to determine a process to be mapped include cost
reduction, assessment of core competencies, reduction of cycle time, and defects, removal of
bottlenecks, change of technology, competitiveness and when dealing with mergers or
acquisitions(Tapinos & Pyper, 2015).
Paraphrase This Document
Need a fresh take? Get an instant paraphrase of this document with our AI Paraphraser
PROCESS MAPPING AND ANALYSIS P-BICYCLE CORPORATION 5
Relationship Maps
Relationship maps are diagrams used to view broad connections within a business
entity and presents illustrations of who plays which role in the business processes creating an
understanding of the roles that interact. Relationship maps are at times called business
interaction models, entity relationship diagrams, organizational context diagrams or
organizational relationship maps. Entities entail the various elements of a business
organization including stakeholders, the user departments and roles as well as related
organizations. Computer applications which in some instances automate functional areas are
also regarded as entities. The maps are used to highlight entities in a business process and
also depict the existing relationships (Damelio, 2016). They are used to unravel complex
operations by communicating the reasons for interaction in order to make better informed
choices in consultation with the other entities involved in the process minimizing the risks of
omissions. The maps are applicable both in current and future relationship interactions to
illustrate the various entities involved in a project and should be reviewed by the team
working on the project early during the project cycle. Current state relationships are the first
visuals to be reviewed by project teams and the map should remain visual throughout the
project lifecycle (Poels et al., 2018).
Leaders who should use the current state relationship maps to guide business
operations include project managers, product owners and executive leaders. The maps should
capture future state relationships together with the expected impact to the affected entities.
Requirement deliverables use the relationship map as a reference. The development teams
review the relationship maps to be able to identify project tasks and it benefits every member
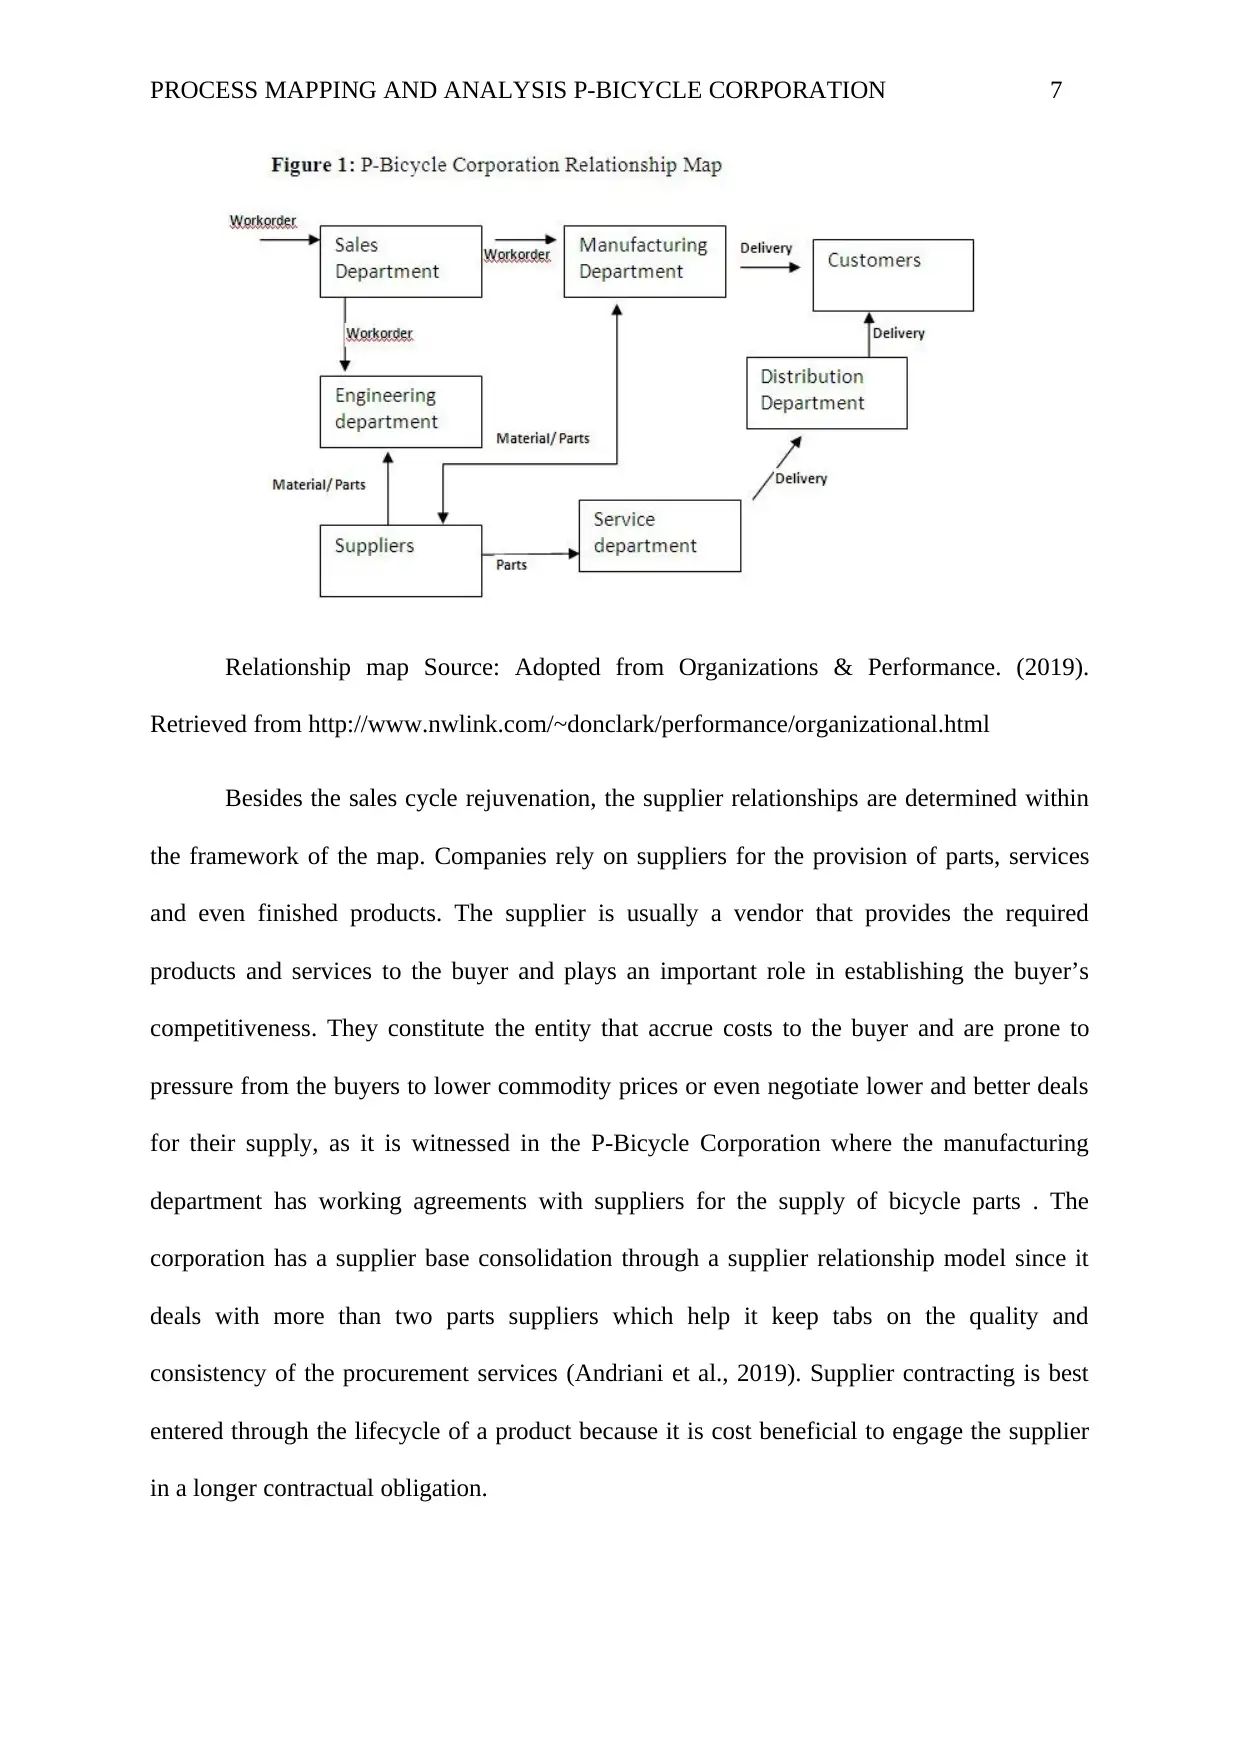
of the project team. The relationship map indicated below shows the linkages within the P-
Bicycle Corporation and is designed to portray the major functions and services rendered by
Relationship Maps
Relationship maps are diagrams used to view broad connections within a business
entity and presents illustrations of who plays which role in the business processes creating an
understanding of the roles that interact. Relationship maps are at times called business
interaction models, entity relationship diagrams, organizational context diagrams or
organizational relationship maps. Entities entail the various elements of a business
organization including stakeholders, the user departments and roles as well as related
organizations. Computer applications which in some instances automate functional areas are
also regarded as entities. The maps are used to highlight entities in a business process and
also depict the existing relationships (Damelio, 2016). They are used to unravel complex
operations by communicating the reasons for interaction in order to make better informed
choices in consultation with the other entities involved in the process minimizing the risks of
omissions. The maps are applicable both in current and future relationship interactions to
illustrate the various entities involved in a project and should be reviewed by the team
working on the project early during the project cycle. Current state relationships are the first
visuals to be reviewed by project teams and the map should remain visual throughout the
project lifecycle (Poels et al., 2018).
Leaders who should use the current state relationship maps to guide business
operations include project managers, product owners and executive leaders. The maps should
capture future state relationships together with the expected impact to the affected entities.
Requirement deliverables use the relationship map as a reference. The development teams
review the relationship maps to be able to identify project tasks and it benefits every member
of the project team. The relationship map indicated below shows the linkages within the P-
Bicycle Corporation and is designed to portray the major functions and services rendered by
PROCESS MAPPING AND ANALYSIS P-BICYCLE CORPORATION 6
the corporation and their interaction across all levels. It further shows the inputs and outputs
of the organization’s processes.
Sales teams are the lead stakeholders who understand the needs of the buyers and
within the buying cycle. An average sales opportunity involves many decision makers and
sales representatives must optimize their potential to identify these decision makers and get
their support. Within the framework of relationship maps, sales people are able to identify the
key decision makers and key risk areas and those organizations that are prudently managed
make use of relationship maps to identify key indicators such as which stakeholders are
important, the price and service quality (Damelio, 2016). In the P-Bicycle Corporation, the
relationship map is an essential tool that can be used to rejuvenate the company’s sales
strategy and ensure that the sales team’s campaigns reach to the desired stakeholders within
the sales process including the senior management. Visual relationship maps assist in
understanding the connection between many stakeholders, and help teams to focus on
execution and communication of value to business leaders (Franceschini et al., 2019). Within
the enterprise environment, relationship maps easily connect people using visual aids and
analyze the strengths of the relationships and know which ones to nurture and which ones
pose risks within the sales cycle.
⊘ This is a preview!⊘
Do you want full access?
Subscribe today to unlock all pages.
Trusted by 1+ million students worldwide
PROCESS MAPPING AND ANALYSIS P-BICYCLE CORPORATION 7
Relationship map Source: Adopted from Organizations & Performance. (2019).
Retrieved from http://www.nwlink.com/~donclark/performance/organizational.html
Besides the sales cycle rejuvenation, the supplier relationships are determined within
the framework of the map. Companies rely on suppliers for the provision of parts, services
and even finished products. The supplier is usually a vendor that provides the required
products and services to the buyer and plays an important role in establishing the buyer’s
competitiveness. They constitute the entity that accrue costs to the buyer and are prone to
pressure from the buyers to lower commodity prices or even negotiate lower and better deals
for their supply, as it is witnessed in the P-Bicycle Corporation where the manufacturing
department has working agreements with suppliers for the supply of bicycle parts . The
corporation has a supplier base consolidation through a supplier relationship model since it
deals with more than two parts suppliers which help it keep tabs on the quality and
consistency of the procurement services (Andriani et al., 2019). Supplier contracting is best
entered through the lifecycle of a product because it is cost beneficial to engage the supplier
in a longer contractual obligation.
Paraphrase This Document
Need a fresh take? Get an instant paraphrase of this document with our AI Paraphraser
PROCESS MAPPING AND ANALYSIS P-BICYCLE CORPORATION 8
On the same level, relationship mapping helps boost the interaction between the
suppliers and buyers through indicators on quality, research and development, service and
price. Relationship maps are good when long term contractual obligations are entered. The
cost benefits to the buyer originate from sharing of product improvement ideas resulting in
cost saving to make profit. Establishing strong buyer-supplier relationships is necessary in
employing strategies that increase profitability and minimizes supply risk.
The engineering department is the technical conduit through which the company’s
products are designed and manufactured. The same section serves two broad business
portfolios including the manufacturing of new bicycles as well as servicing. This poses a
challenge in both management and the technical capacity. Technical tasks are divided into
smaller elements that can be handled by specific teams, although this also comes with
challenges in management. These elements constitute relationships and make up the bulk of
product development including engineering standards, performance and consumer safety
characteristics. Capturing engineering elements’ relationships is critical in achieving robust
product quality and efficiency (Andriani et al., 2019). The presence of models of capturing
these elements in a simple way makes product engineering within a relationship map integral.
Cross Functional Process Maps
Despite cross functional process maps showing a business entity’s work processes, it
describes several functions together with their inputs and outputs through a sequence of steps.
A cross functional map can be drawn at any level of the business organization and it shows
the chains within the business that produce value and represents customer satisfaction outputs
(Rosenbaum, 2017). Unlike relationship maps which focus on the bigger supplier and
customer links picture, the cross functional map contains details of the organization’s
processes that create value for money. This kind of map illustrates specific steps needed to
PROCESS MAPPING AND ANALYSIS P-BICYCLE CORPORATION 9
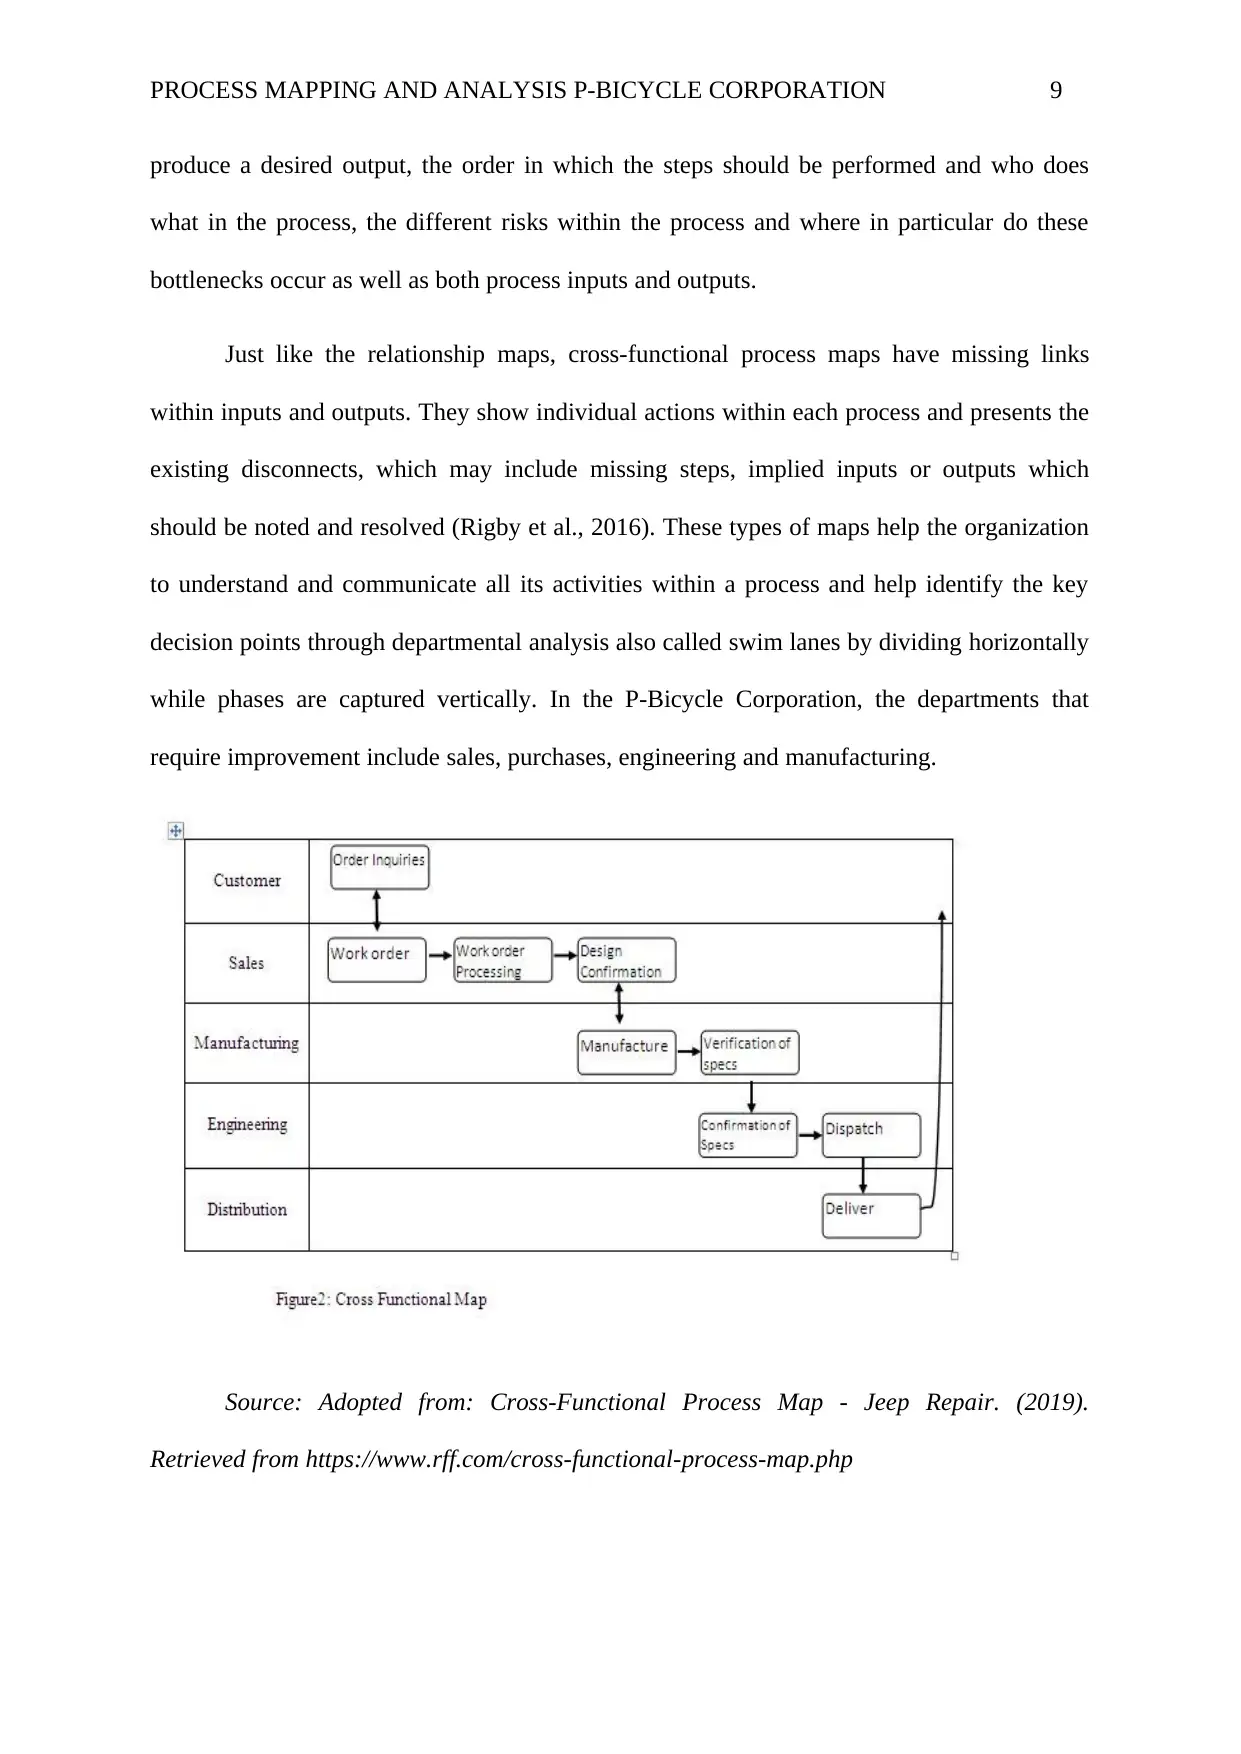
produce a desired output, the order in which the steps should be performed and who does
what in the process, the different risks within the process and where in particular do these
bottlenecks occur as well as both process inputs and outputs.
Just like the relationship maps, cross-functional process maps have missing links
within inputs and outputs. They show individual actions within each process and presents the
existing disconnects, which may include missing steps, implied inputs or outputs which
should be noted and resolved (Rigby et al., 2016). These types of maps help the organization
to understand and communicate all its activities within a process and help identify the key
decision points through departmental analysis also called swim lanes by dividing horizontally
while phases are captured vertically. In the P-Bicycle Corporation, the departments that
require improvement include sales, purchases, engineering and manufacturing.
Source: Adopted from: Cross-Functional Process Map - Jeep Repair. (2019).
Retrieved from https://www.rff.com/cross-functional-process-map.php
⊘ This is a preview!⊘
Do you want full access?
Subscribe today to unlock all pages.
Trusted by 1+ million students worldwide
PROCESS MAPPING AND ANALYSIS P-BICYCLE CORPORATION 10
The current processes at the corporation have bottlenecks which require mitigation in
order to increase efficiency. The distribution department performs only one function which
can easily be taken up by the sales team because the sales department is involved throughout
the order processing cycle. Between manufacturing and engineering, there is a duplication of
roles because the same engineers should be tasked with design production and approval as
well as product creation. It would be cost beneficial to amalgamate the departments to
improve on efficiency (Bals et al., 2009). Furthermore there is room for improving on service
quality by consolidating some phases like the time taken between the engineering and
manufacturing departments to consult on design specifications. If these two were
consolidated, the verification phase would not be replicated by the confirmation of product
specifications.
The cross functional process at the P-Bicycle Corporation begins with the customer
and ends with the customer. The majority of work is done by the sales team who must
generate work orders and conduct the cross examination to order conformity. Both the
engineering and manufacturing are technical levels that do the actual production. Customer
interaction is important to generate sales for the rest of the process to proceed. The point o f
interaction with the customer is the sales department, which regularly consults with the other
process levels to ensure customer satisfaction. The inputs for this process include the work
order generation from customer confirmed orders while outputs include the new bicycle
production and delivery or product servicing. The sections of the process that has a direct
impact on customer requirements are the design confirmation by the sales team, verification
of specifications by the engineering team and confirmation of the specifications by the
customer.
Paraphrase This Document
Need a fresh take? Get an instant paraphrase of this document with our AI Paraphraser
PROCESS MAPPING AND ANALYSIS P-BICYCLE CORPORATION 11
Process Analysis
In order to analyze a process, existing process maps must be interpreted complete
with their process performance information (Daley, 2004). The information required includes
costs and time as well as information on shortcomings of the process. Taking the P-Bicycle
case analysis, customer complaints are likely to emerge from the fact that the duration taken
for full product cycle is long. When the output takes long to be realized, the kind of analysis
most effective is related to time management. Therefore cycle time analysis is considered
because the outputs of the process have not reported any defects (Balleer et al., 2016). By
eliminating non value adding phases within the process improves on time wastage hence
reduces the time lifecycle and enhances productivity.
Value addition in a process has the capacity to increase customer satisfaction,
transform inputs as well as increase efficiency. Maps are used to benchmark areas of
performance improvement and during the analysis; questions must be generated to guide the
analysis process (Prasad, 2016. The bottleneck at the P-Bicycle Corporation is time wastage
and therefore the most appropriate tool to conduct the analysis is using the cycle time
reduction. The guiding questions when conducting this analysis may range from the phases
within the process cycle that consume the most time and the reasons for it. The steps that
need to be used to add value should also be considered vis a vis those that do not add value.
Redundancy, risks, bottlenecks should be identified such as those steps which cause delays,
or consume a lot of time in forward mobility (Balaid et al., 2016). When these steps have
been identified, there is need to determine other metrics such as how much time is used
within that specific step and whether it adds value or not. Thereafter the most appropriate tool
for mapping is chosen as either a process map or a flow chart.
PROCESS MAPPING AND ANALYSIS P-BICYCLE CORPORATION 12
Recommendations
In order to realize the full potential of the organization, benchmarking for
performance measures is important. A comparison with similar or competing organizations as
well as industry data will enable the organization keep abreast with current market trends.
Furthermore, it is critical to understand the organization’s internal and external capabilities to
stay ahead in the market. Since there are many functions that require managerial intervention,
implementation of process mapping techniques is recommended for both manufacturing and
business service environments through service blueprinting. Business reengineering will give
innovation an opportunity and adoption of new technologies in the workplace should be
encouraged.
Conclusion
Process mapping is used in organizations to ensure that the staff at all levels
understands their roles within the setup and all the activities that happen within a production
process from inputs until output is realized. These tools also help to eliminate unnecessary
activities and steps within the process hence increasing productivity and reducing cycle time
besides being used to allocate responsibilities, timescales and cost schedules for every
activity within the process. Tools used in process mapping are many and vary depending on
each organization and individual process expertise but the three commonly used tools include
relationship maps, cross functional maps or swim lane charts and process flow charts. When
process mapping, keep it simple and visual to make it a viable catalyst for improvement
within the workplace. Senior level management should engage with junior staff to identify
areas of improvement through a continuous review of results.
⊘ This is a preview!⊘
Do you want full access?
Subscribe today to unlock all pages.
Trusted by 1+ million students worldwide
1 out of 14
Related Documents


Your All-in-One AI-Powered Toolkit for Academic Success.
+13062052269
info@desklib.com
Available 24*7 on WhatsApp / Email
![[object Object]](/_next/static/media/star-bottom.7253800d.svg)
Unlock your academic potential
Copyright © 2020–2026 A2Z Services. All Rights Reserved. Developed and managed by ZUCOL.