Managerial Finance: A Comprehensive Analysis of Procter & Gamble
VerifiedAdded on  2020/05/28
|13
|1727
|123
Report
AI Summary
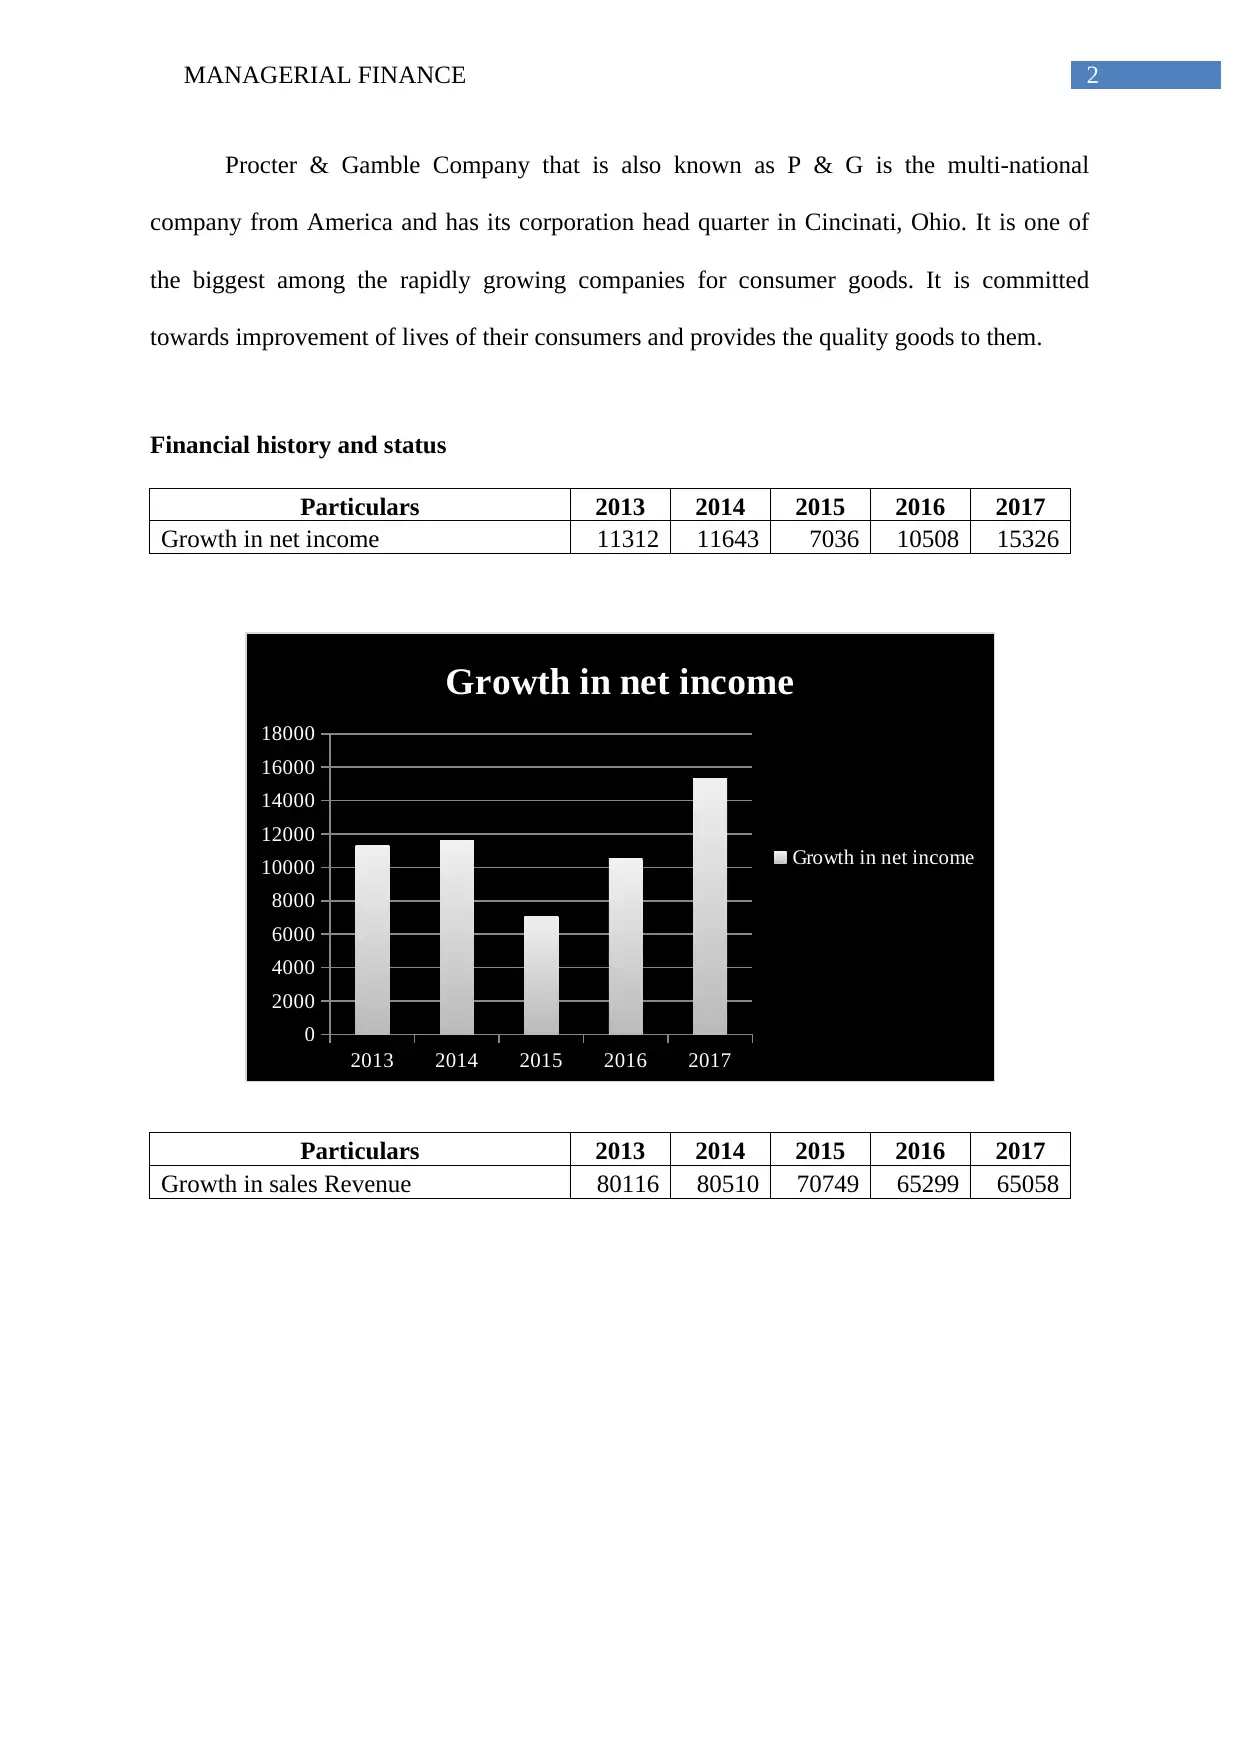
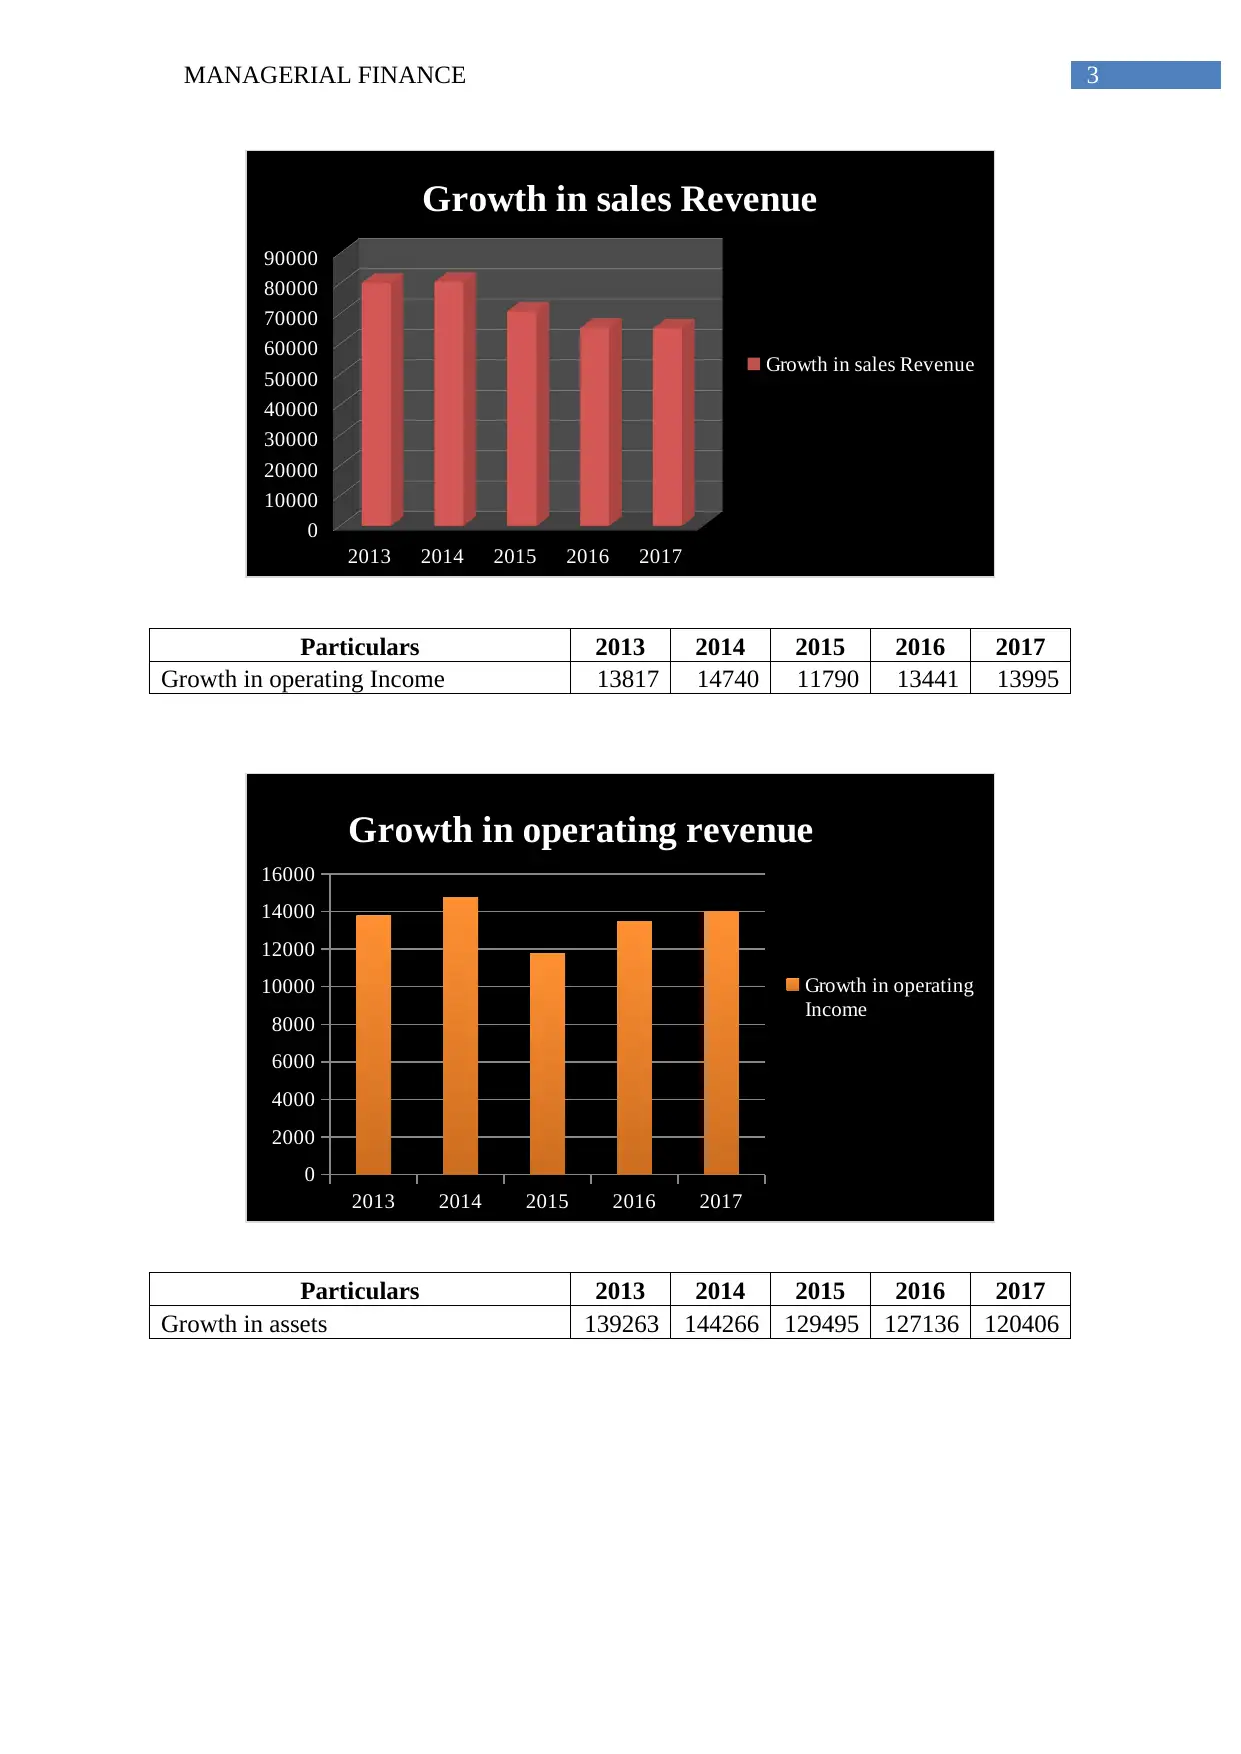
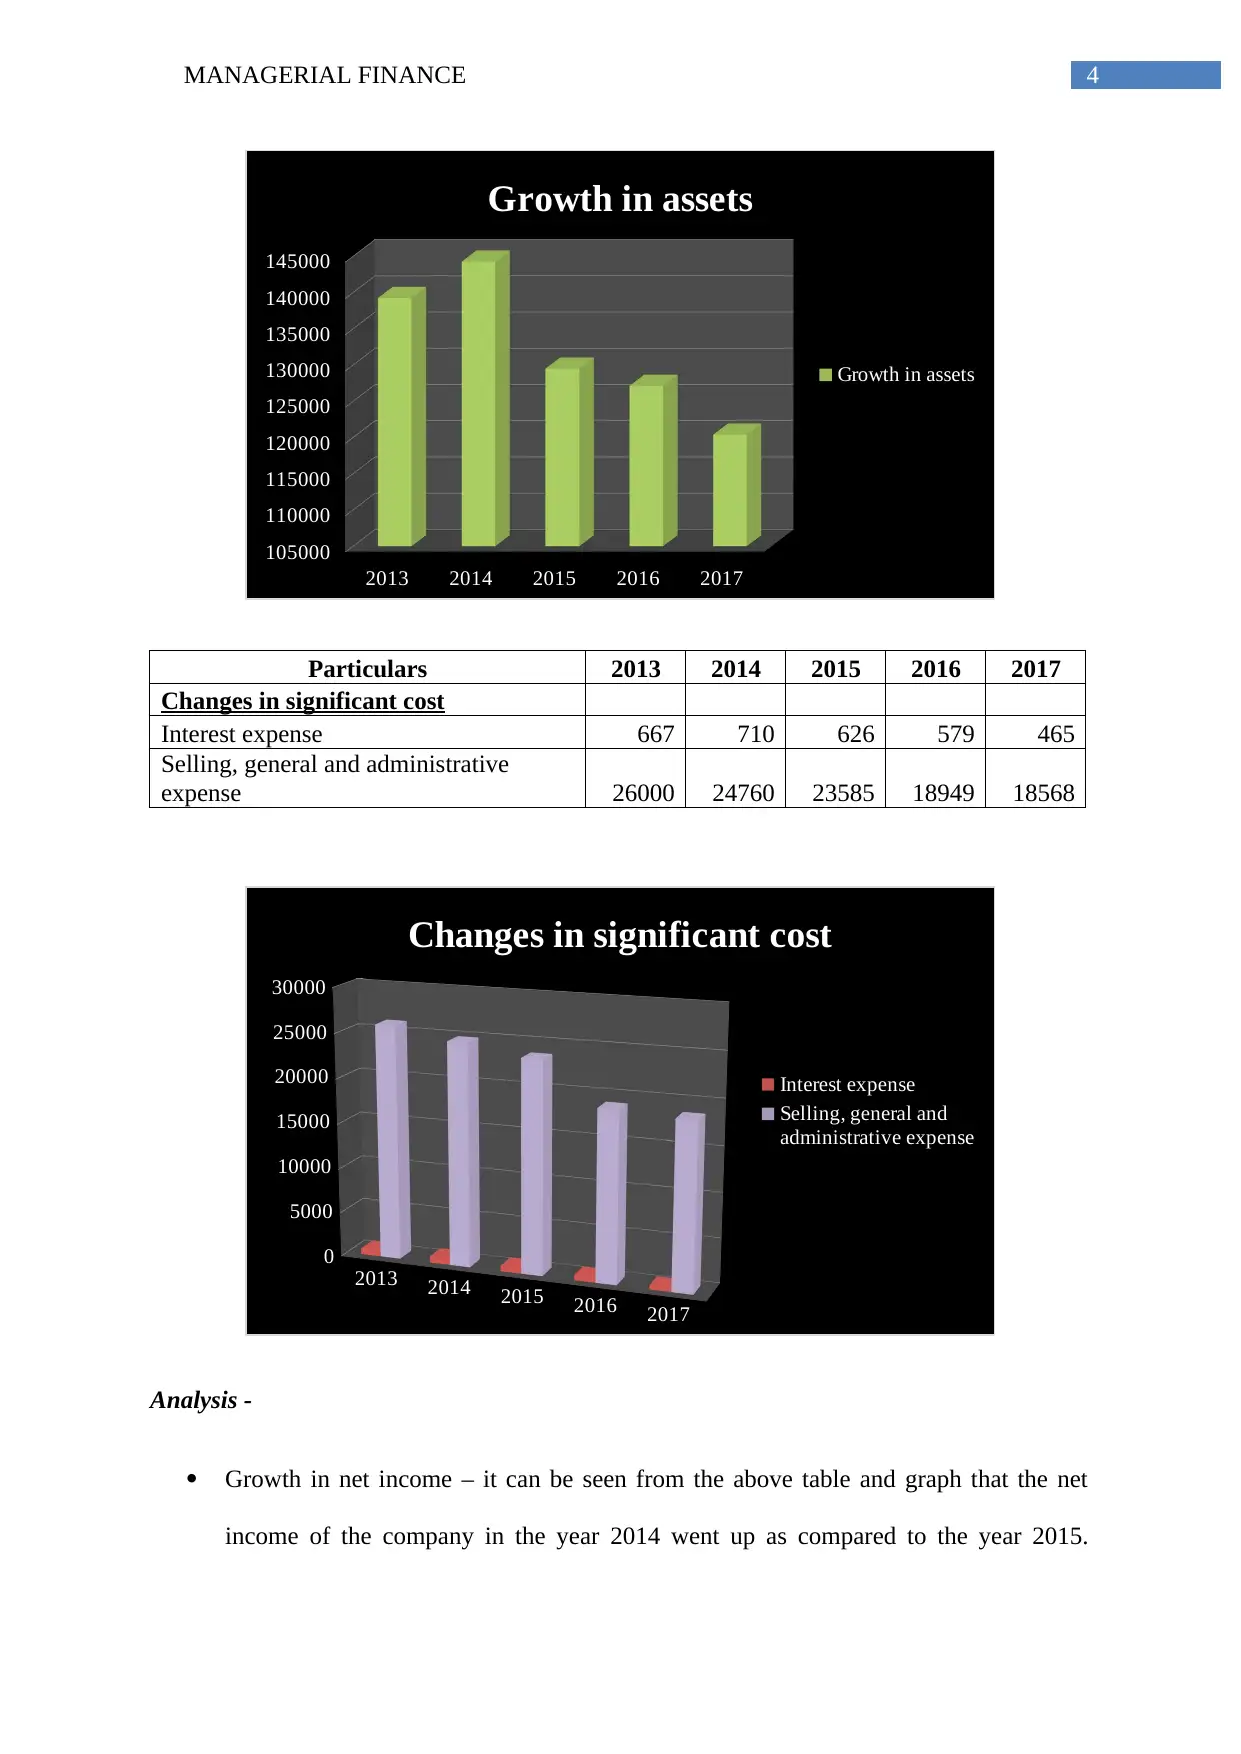
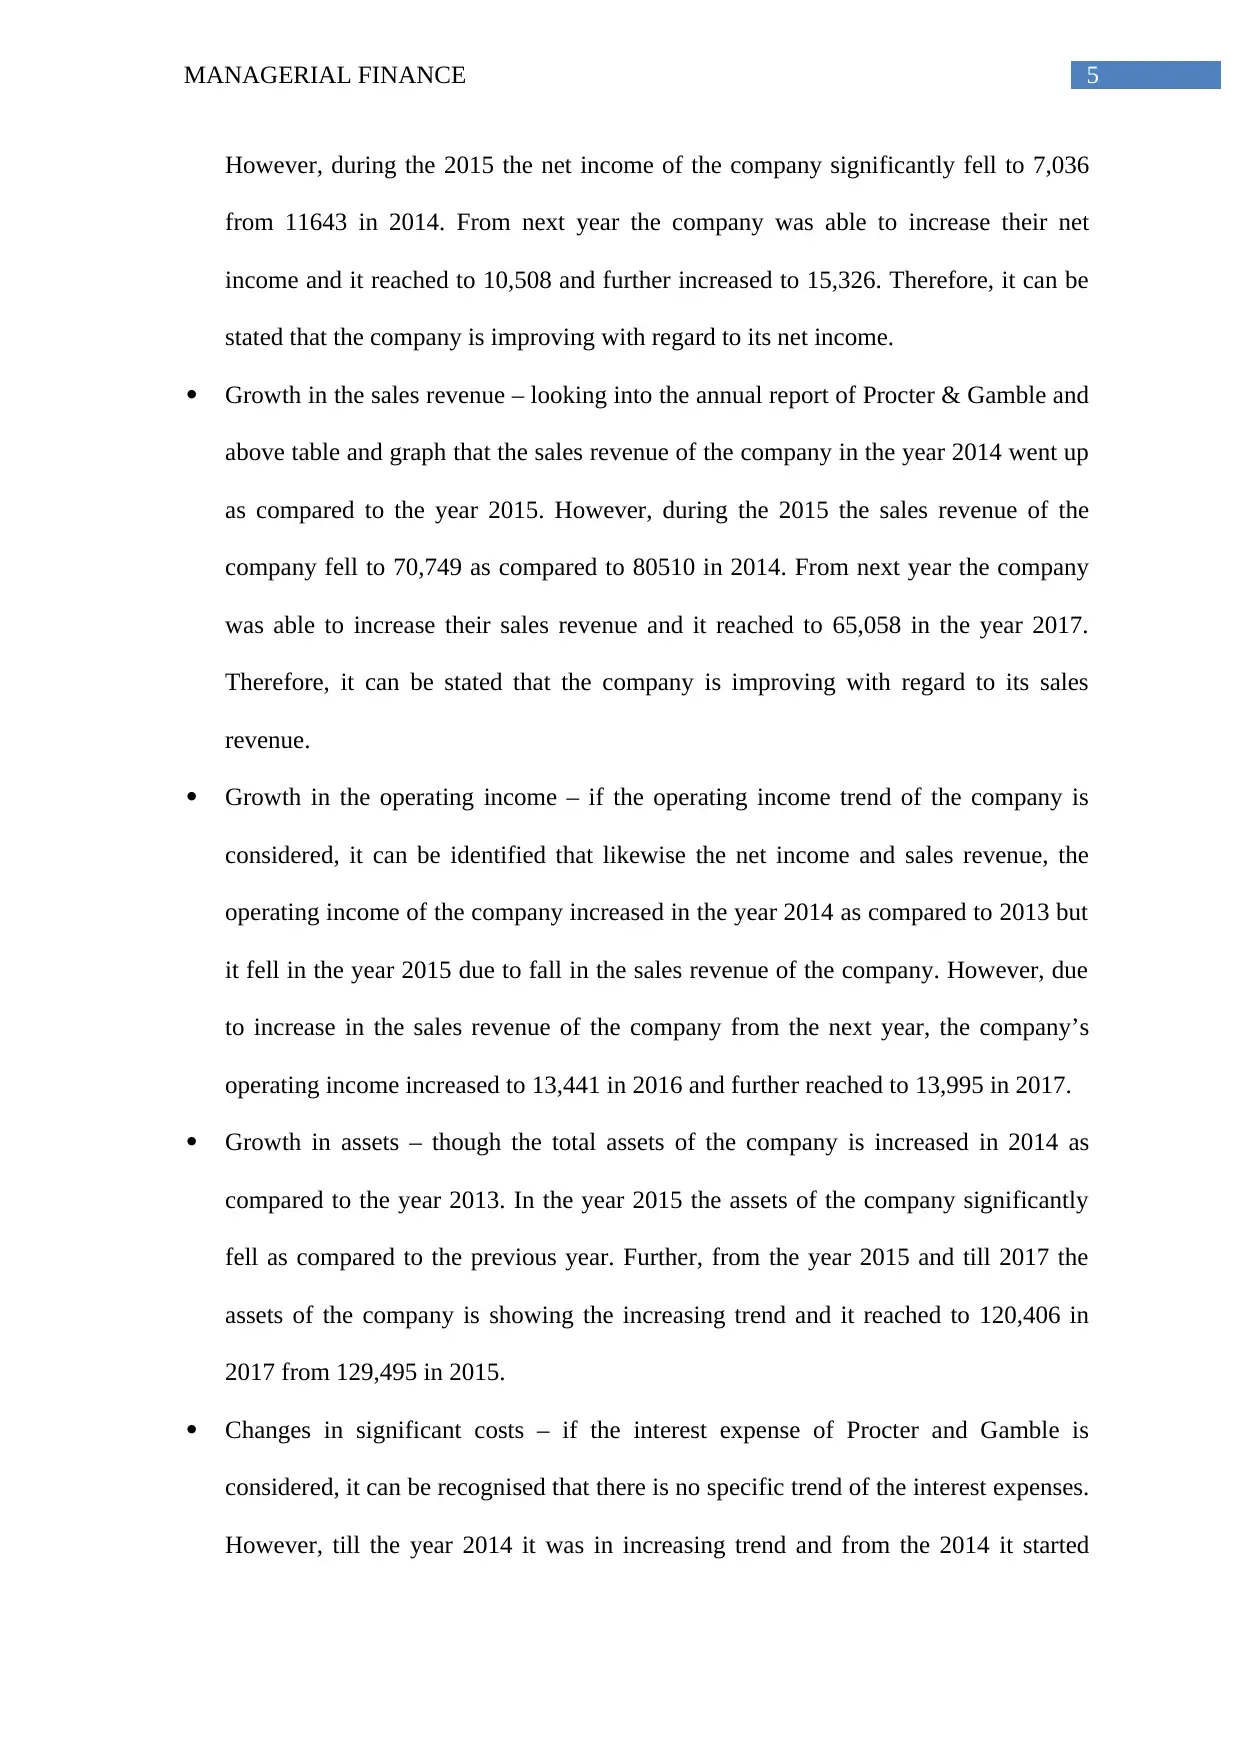
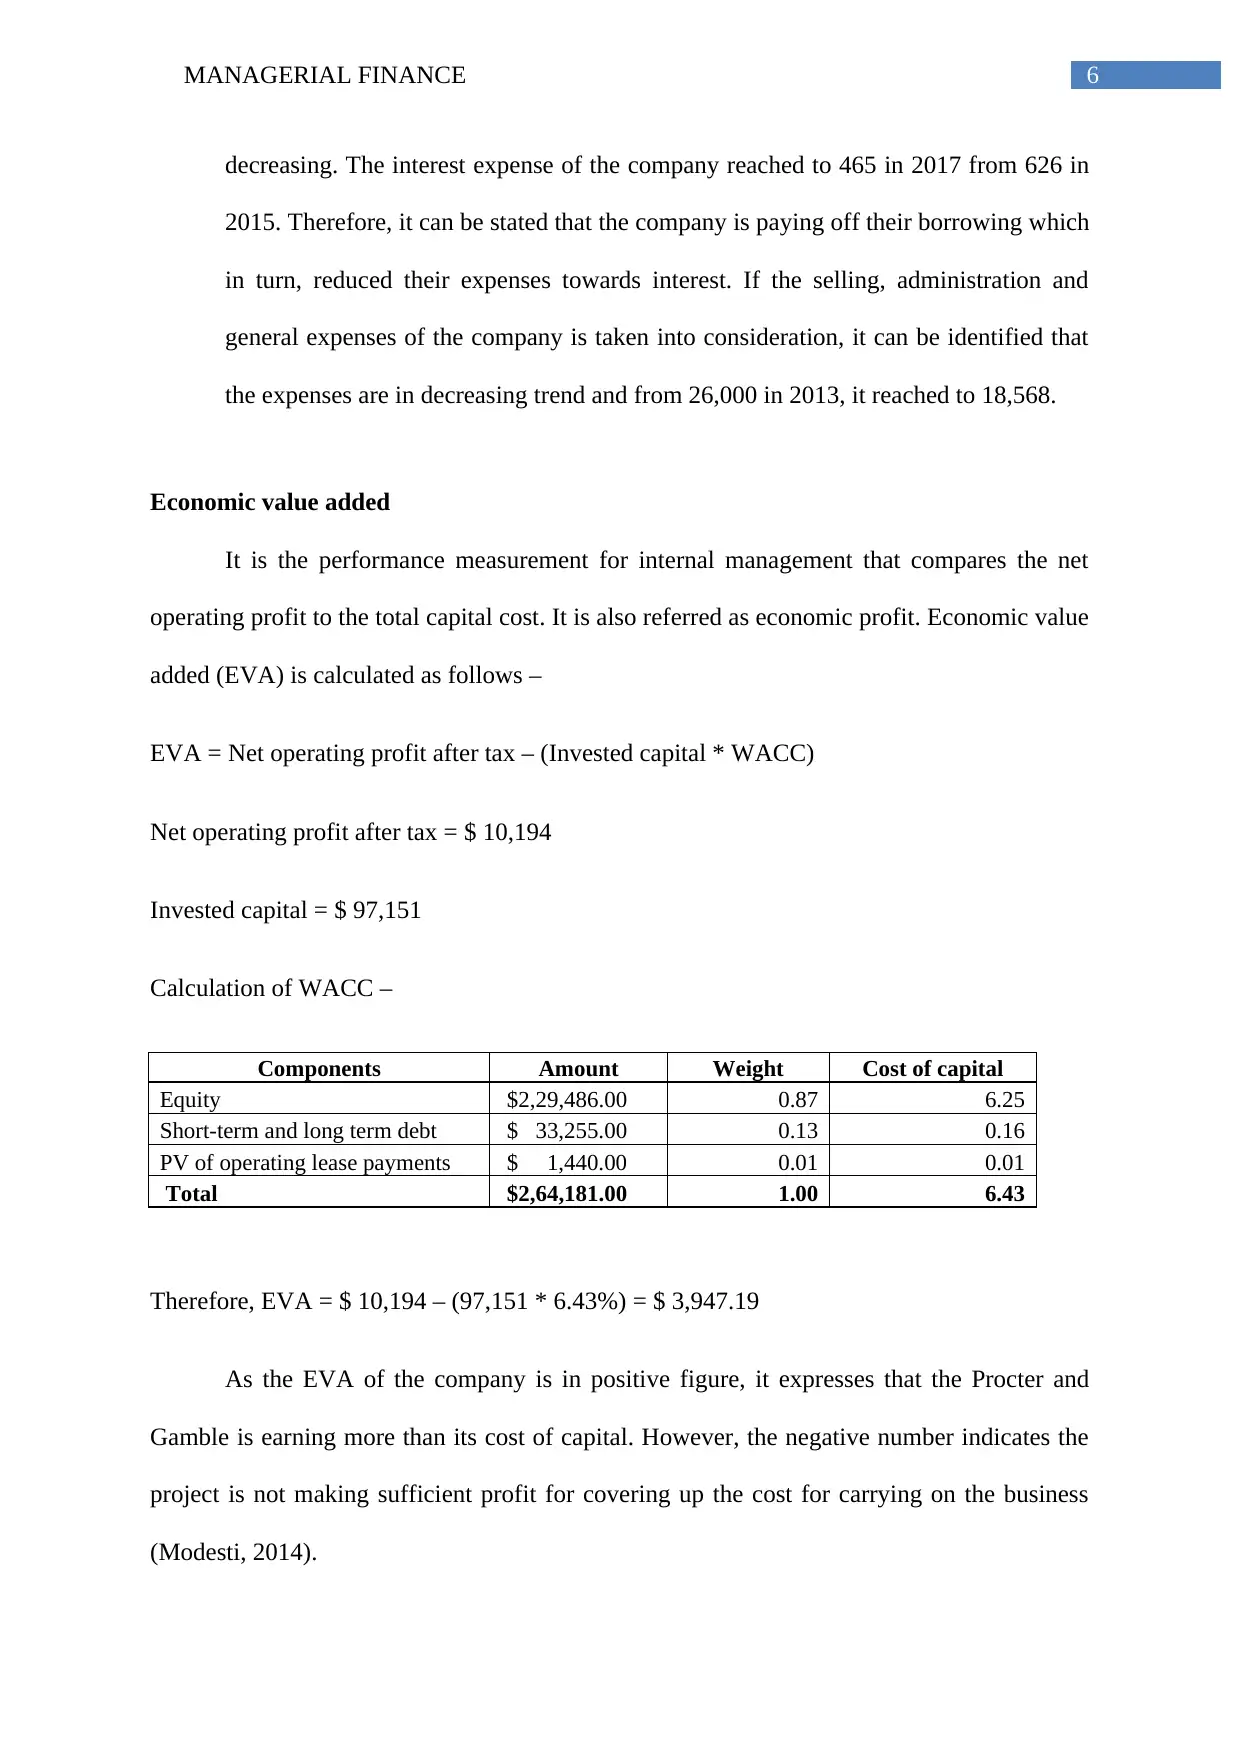
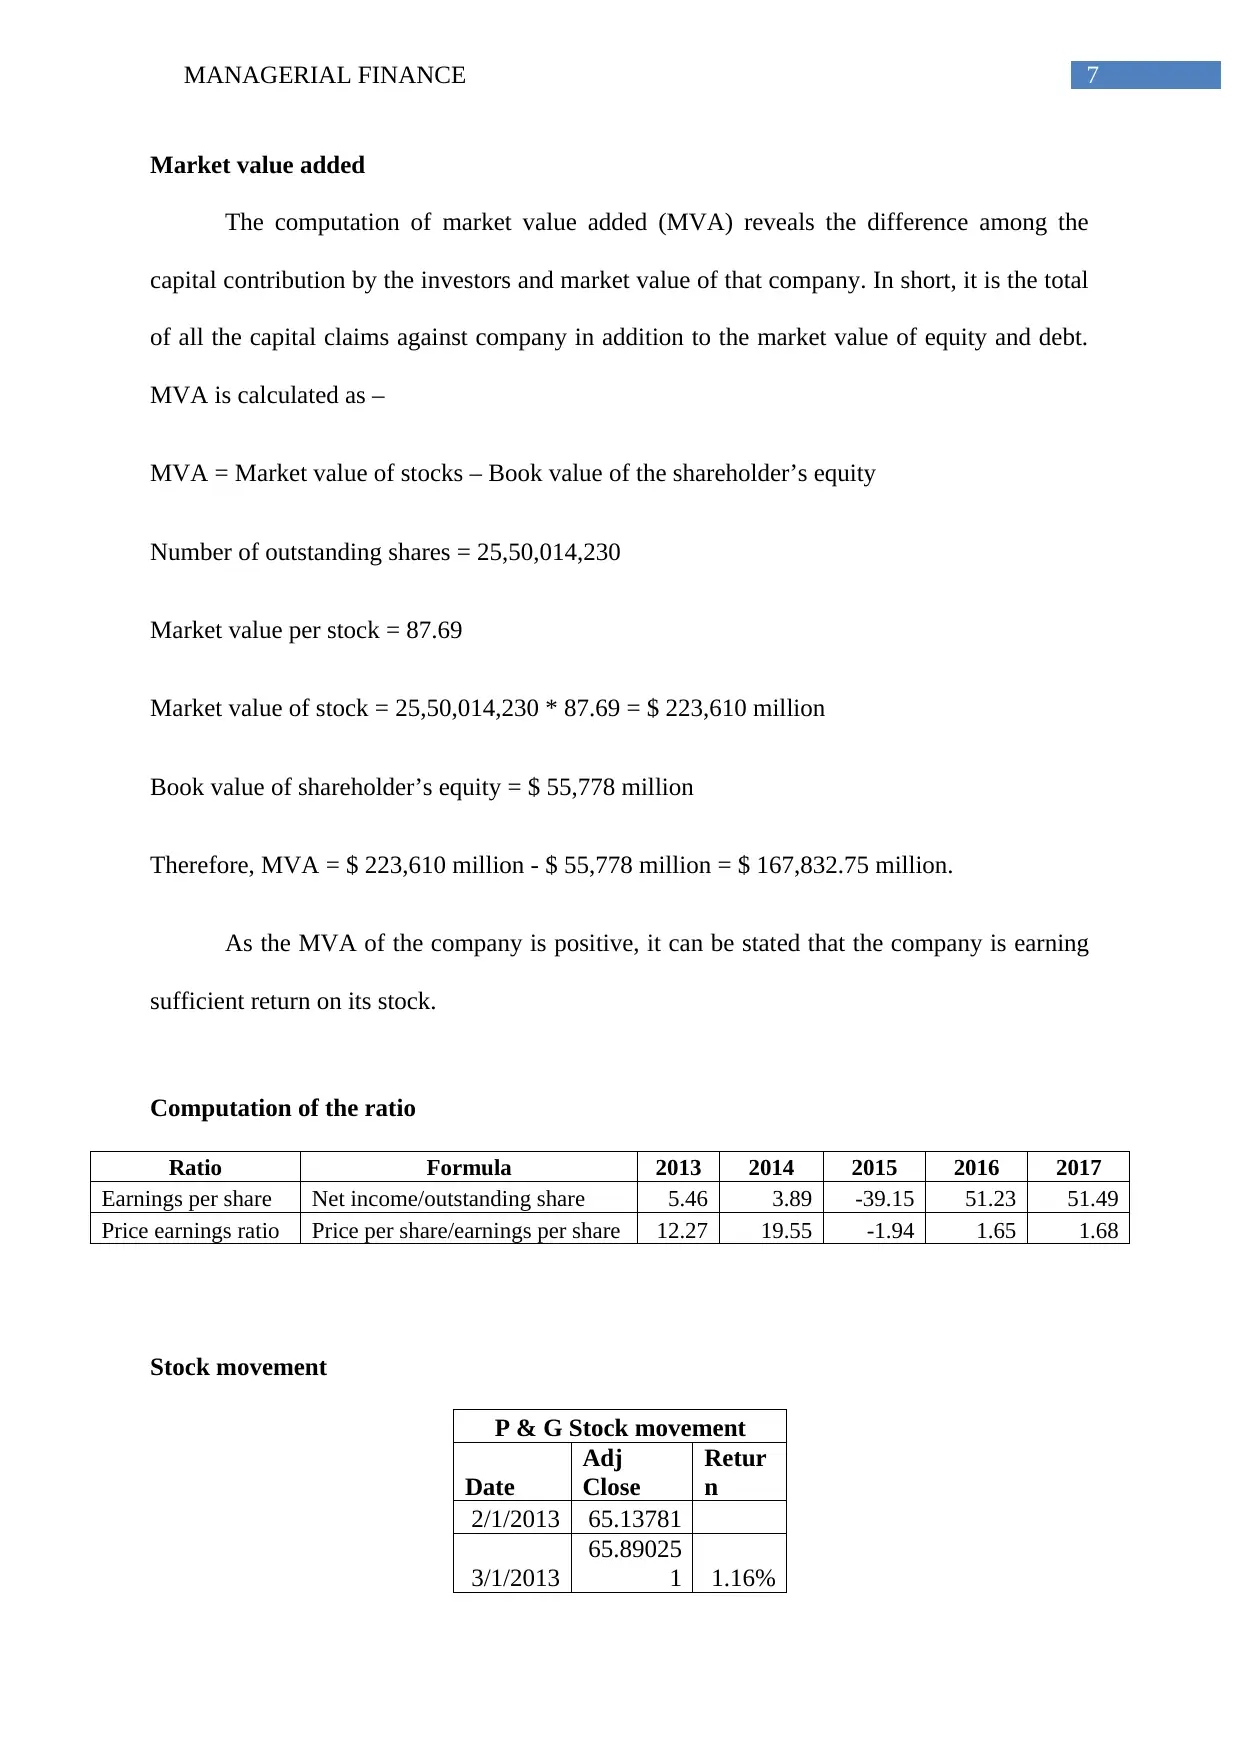
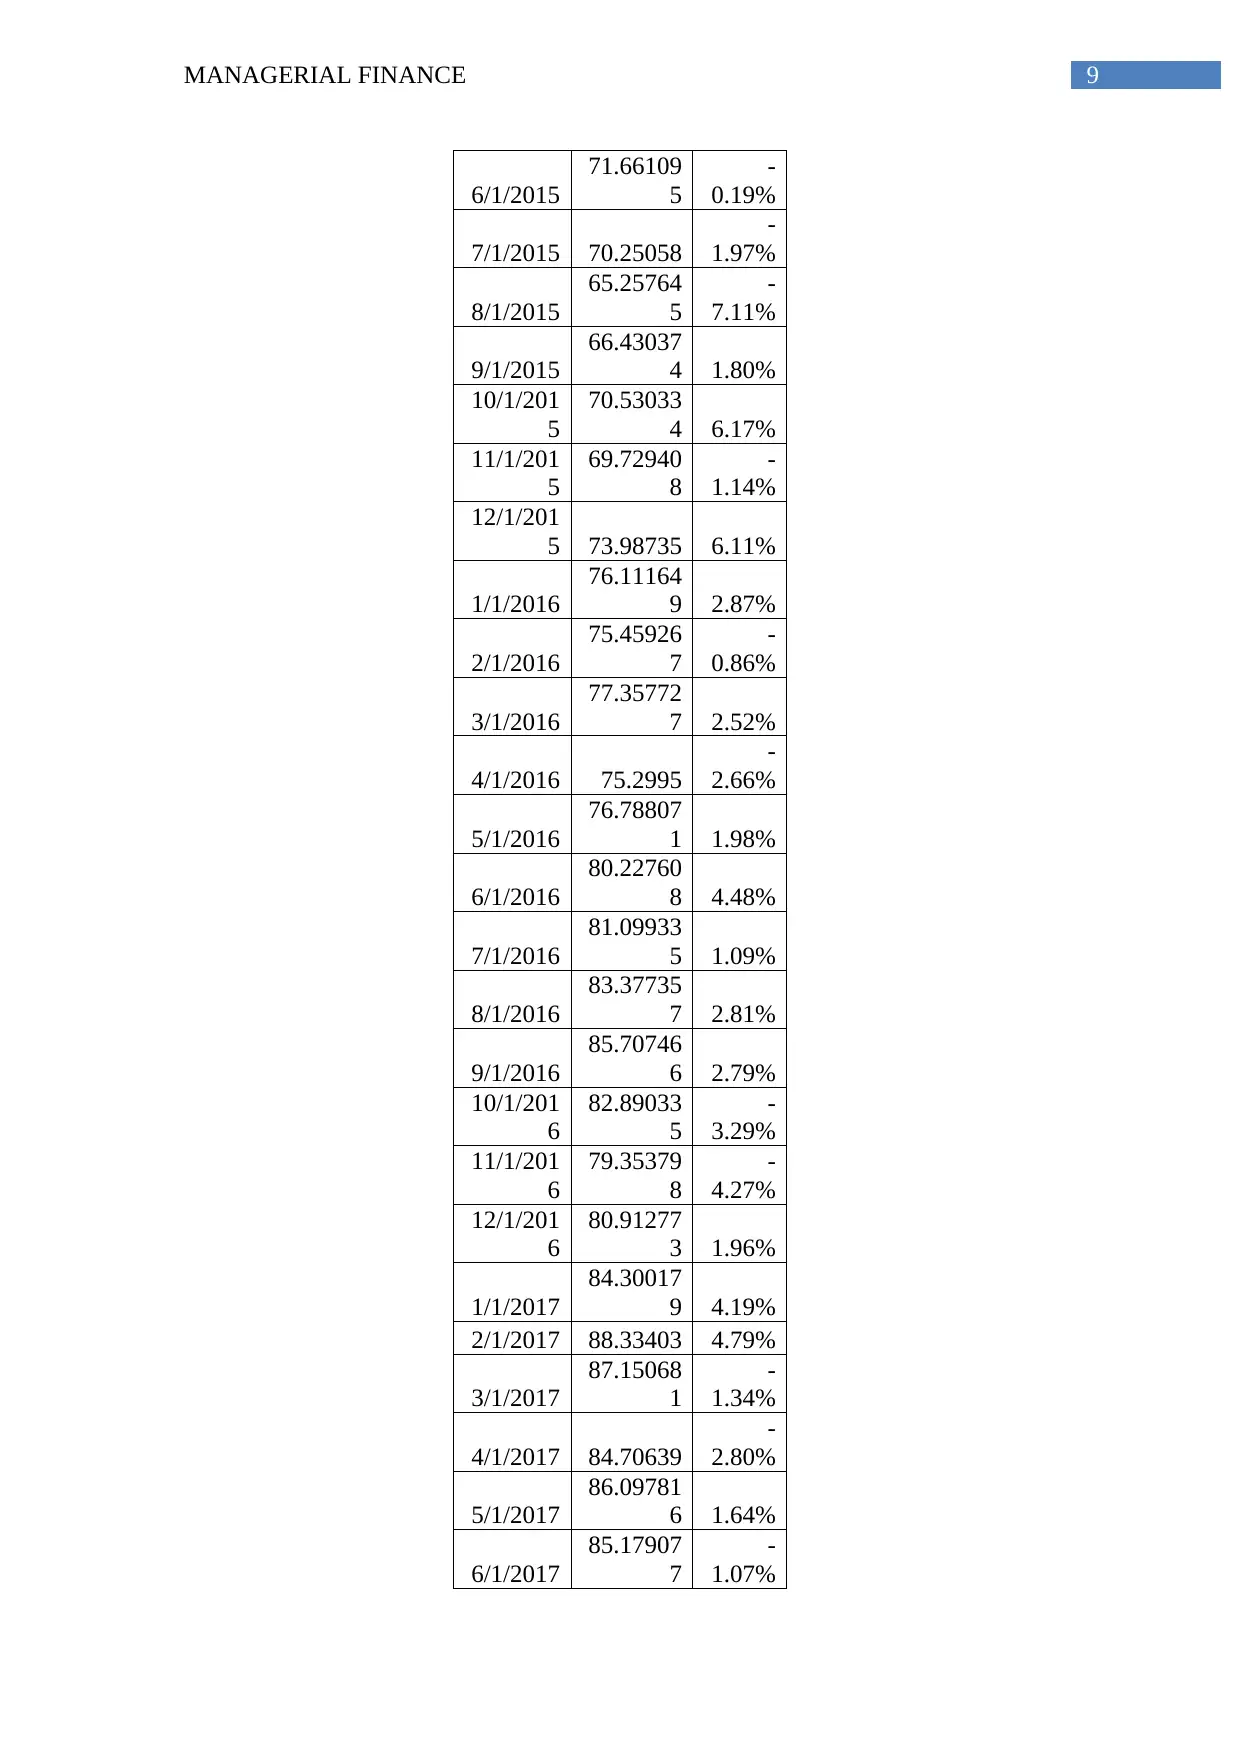
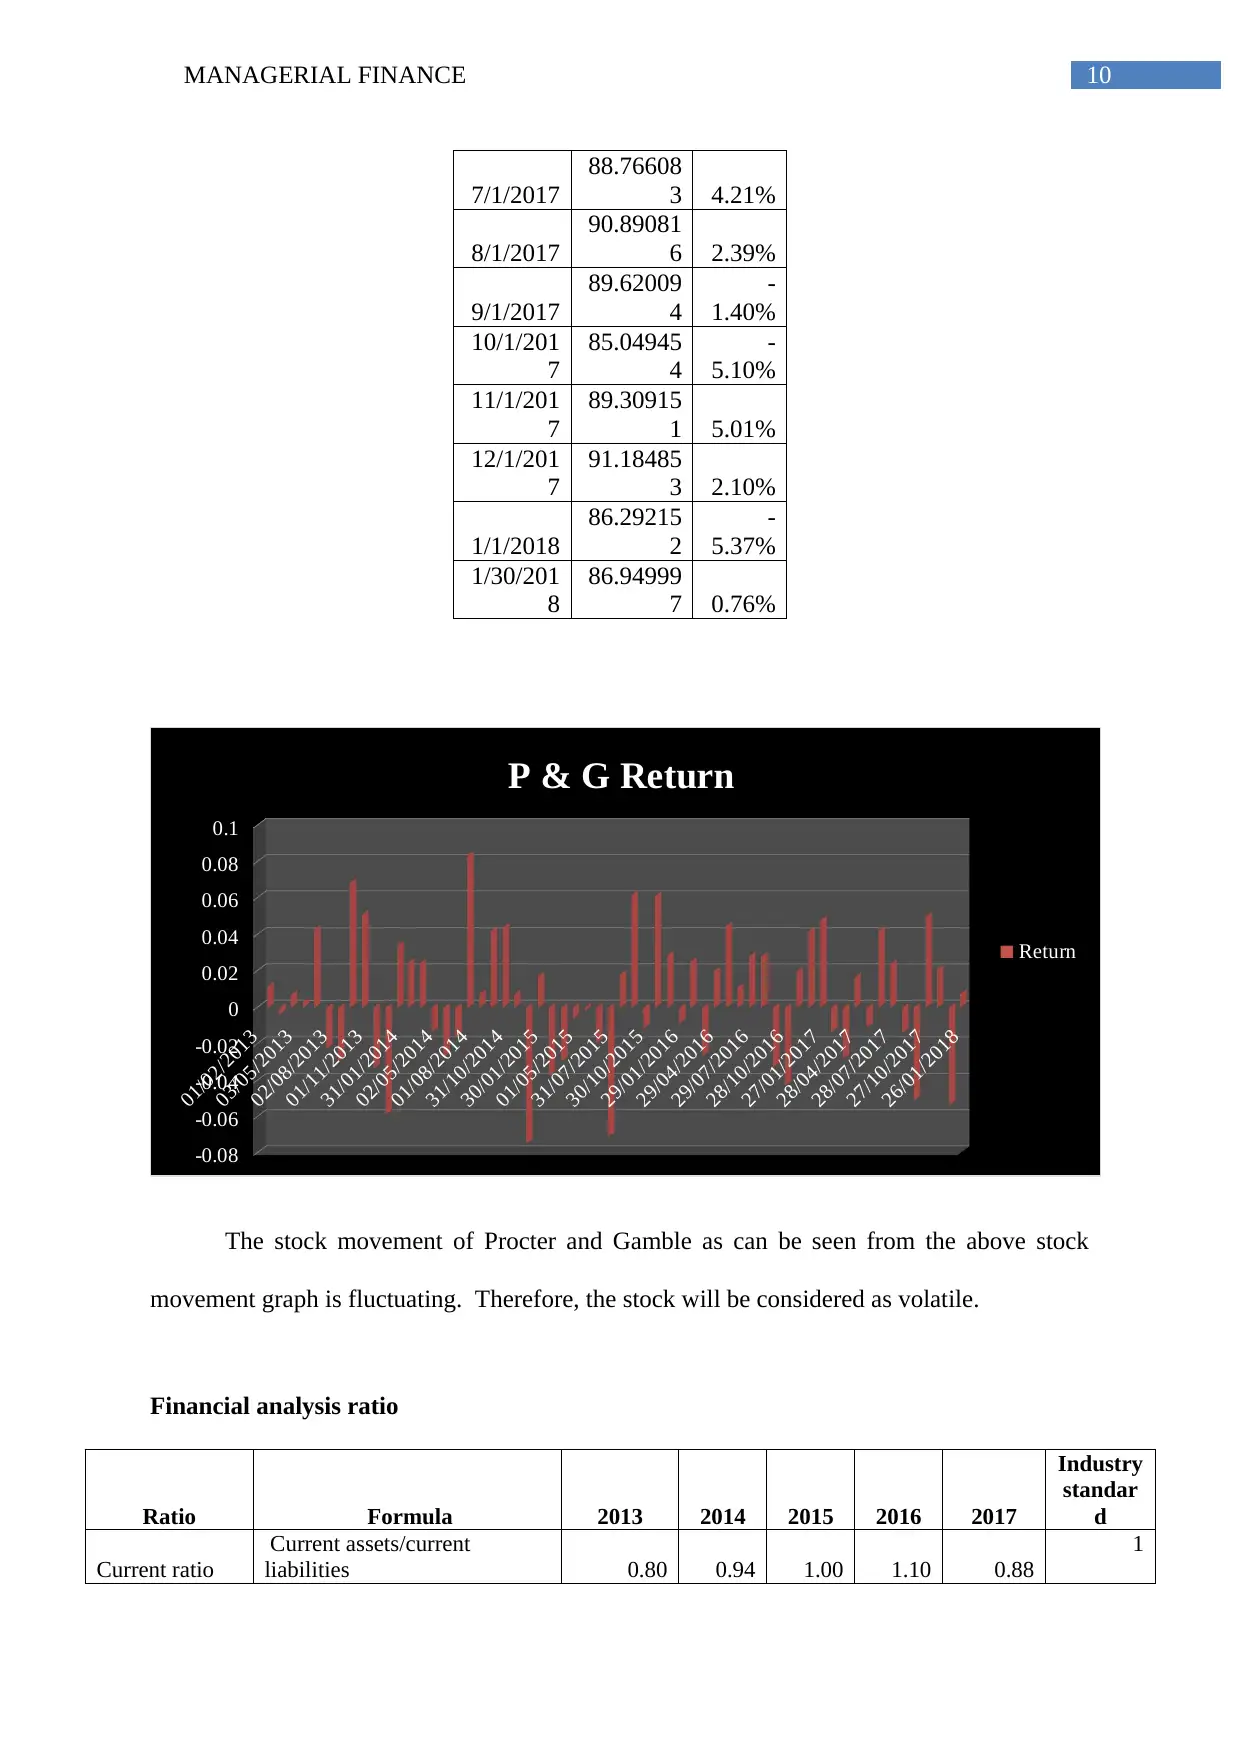
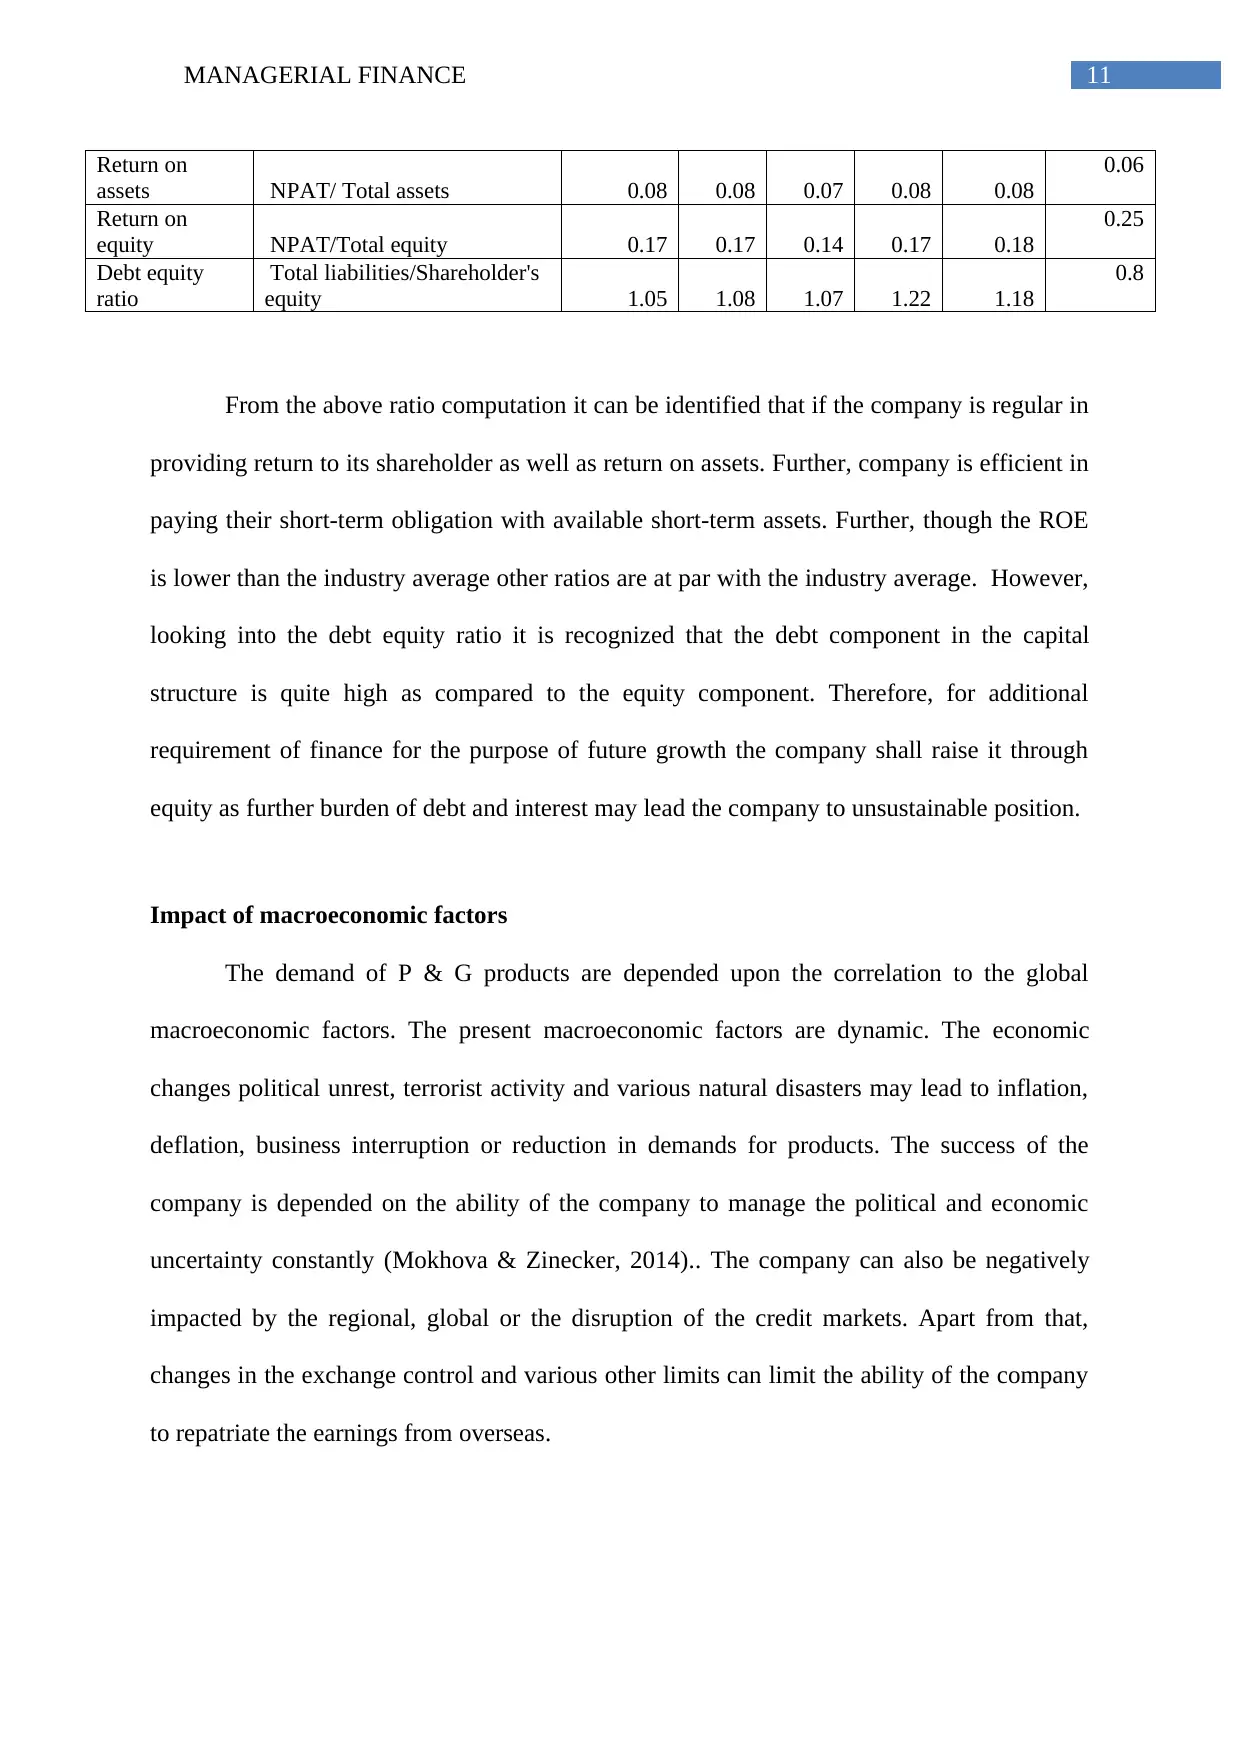
This report provides a detailed financial analysis of Procter & Gamble (P&G). It examines P&G's financial history and status, including growth in net income, sales revenue, operating income, and assets from 2013 to 2017. The report calculates Economic Value Added (EVA) and Market Value Added (MVA), providing insights into P&G's profitability and shareholder value creation. It also includes a computation of various financial ratios, such as earnings per share, price-earnings ratio, current ratio, return on assets, return on equity, and debt-equity ratio, along with an analysis of P&G's stock movement. The report concludes with a discussion on the impact of macroeconomic factors on P&G's performance, highlighting the importance of managing political and economic uncertainties. The analysis is supported by relevant data and calculations, offering a comprehensive overview of P&G's financial health and strategic position.

Running head: MANAGERIAL FINANCE
Managerial finance
Name of the student
Name of the university
Author note
Managerial finance
Name of the student
Name of the university
Author note
Secure Best Marks with AI Grader
Need help grading? Try our AI Grader for instant feedback on your assignments.

1MANAGERIAL FINANCE
Table of Contents
Financial history and status........................................................................................................2
Economic value added...............................................................................................................6
Market value added....................................................................................................................7
Computation of the ratio............................................................................................................7
Stock movement.........................................................................................................................7
Financial analysis ratio...............................................................................................................9
Impact of macroeconomic factors............................................................................................10
Reference..................................................................................................................................11

2MANAGERIAL FINANCE
Procter & Gamble Company that is also known as P & G is the multi-national
company from America and has its corporation head quarter in Cincinati, Ohio. It is one of
the biggest among the rapidly growing companies for consumer goods. It is committed
towards improvement of lives of their consumers and provides the quality goods to them.
Financial history and status
Particulars 2013 2014 2015 2016 2017
Growth in net income 11312 11643 7036 10508 15326
2013 2014 2015 2016 2017
0
2000
4000
6000
8000
10000
12000
14000
16000
18000
Growth in net income
Particulars 2013 2014 2015 2016 2017
Growth in sales Revenue 80116 80510 70749 65299 65058

3MANAGERIAL FINANCE
2013 2014 2015 2016 2017
0
10000
20000
30000
40000
50000
60000
70000
80000
90000
Growth in sales Revenue
Particulars 2013 2014 2015 2016 2017
Growth in operating Income 13817 14740 11790 13441 13995
2013 2014 2015 2016 2017
0
2000
4000
6000
8000
10000
12000
14000
16000
Growth in operating revenue
Growth in operating
Income
Particulars 2013 2014 2015 2016 2017
Growth in assets 139263 144266 129495 127136 120406
2013 2014 2015 2016 2017
0
10000
20000
30000
40000
50000
60000
70000
80000
90000
Growth in sales Revenue
Particulars 2013 2014 2015 2016 2017
Growth in operating Income 13817 14740 11790 13441 13995
2013 2014 2015 2016 2017
0
2000
4000
6000
8000
10000
12000
14000
16000
Growth in operating revenue
Growth in operating
Income
Particulars 2013 2014 2015 2016 2017
Growth in assets 139263 144266 129495 127136 120406
Secure Best Marks with AI Grader
Need help grading? Try our AI Grader for instant feedback on your assignments.

4MANAGERIAL FINANCE
2013 2014 2015 2016 2017
105000
110000
115000
120000
125000
130000
135000
140000
145000
Growth in assets
Growth in assets
Particulars 2013 2014 2015 2016 2017
Changes in significant cost
Interest expense 667 710 626 579 465
Selling, general and administrative
expense 26000 24760 23585 18949 18568
2013 2014 2015 2016 2017
0
5000
10000
15000
20000
25000
30000
Changes in significant cost
Interest expense
Selling, general and
administrative expense
Analysis -
 Growth in net income – it can be seen from the above table and graph that the net
income of the company in the year 2014 went up as compared to the year 2015.
2013 2014 2015 2016 2017
105000
110000
115000
120000
125000
130000
135000
140000
145000
Growth in assets
Growth in assets
Particulars 2013 2014 2015 2016 2017
Changes in significant cost
Interest expense 667 710 626 579 465
Selling, general and administrative
expense 26000 24760 23585 18949 18568
2013 2014 2015 2016 2017
0
5000
10000
15000
20000
25000
30000
Changes in significant cost
Interest expense
Selling, general and
administrative expense
Analysis -
 Growth in net income – it can be seen from the above table and graph that the net
income of the company in the year 2014 went up as compared to the year 2015.

5MANAGERIAL FINANCE
However, during the 2015 the net income of the company significantly fell to 7,036
from 11643 in 2014. From next year the company was able to increase their net
income and it reached to 10,508 and further increased to 15,326. Therefore, it can be
stated that the company is improving with regard to its net income.
 Growth in the sales revenue – looking into the annual report of Procter & Gamble and
above table and graph that the sales revenue of the company in the year 2014 went up
as compared to the year 2015. However, during the 2015 the sales revenue of the
company fell to 70,749 as compared to 80510 in 2014. From next year the company
was able to increase their sales revenue and it reached to 65,058 in the year 2017.
Therefore, it can be stated that the company is improving with regard to its sales
revenue.
 Growth in the operating income – if the operating income trend of the company is
considered, it can be identified that likewise the net income and sales revenue, the
operating income of the company increased in the year 2014 as compared to 2013 but
it fell in the year 2015 due to fall in the sales revenue of the company. However, due
to increase in the sales revenue of the company from the next year, the company’s
operating income increased to 13,441 in 2016 and further reached to 13,995 in 2017.
 Growth in assets – though the total assets of the company is increased in 2014 as
compared to the year 2013. In the year 2015 the assets of the company significantly
fell as compared to the previous year. Further, from the year 2015 and till 2017 the
assets of the company is showing the increasing trend and it reached to 120,406 in
2017 from 129,495 in 2015.
 Changes in significant costs – if the interest expense of Procter and Gamble is
considered, it can be recognised that there is no specific trend of the interest expenses.
However, till the year 2014 it was in increasing trend and from the 2014 it started

6MANAGERIAL FINANCE
decreasing. The interest expense of the company reached to 465 in 2017 from 626 in
2015. Therefore, it can be stated that the company is paying off their borrowing which
in turn, reduced their expenses towards interest. If the selling, administration and
general expenses of the company is taken into consideration, it can be identified that
the expenses are in decreasing trend and from 26,000 in 2013, it reached to 18,568.
Economic value added
It is the performance measurement for internal management that compares the net
operating profit to the total capital cost. It is also referred as economic profit. Economic value
added (EVA) is calculated as follows –
EVA = Net operating profit after tax – (Invested capital * WACC)
Net operating profit after tax = $ 10,194
Invested capital = $ 97,151
Calculation of WACC –
Components Amount Weight Cost of capital
Equity $2,29,486.00 0.87 6.25
Short-term and long term debt $ 33,255.00 0.13 0.16
PV of operating lease payments $ 1,440.00 0.01 0.01
Total $2,64,181.00 1.00 6.43
Therefore, EVA = $ 10,194 – (97,151 * 6.43%) = $ 3,947.19
As the EVA of the company is in positive figure, it expresses that the Procter and
Gamble is earning more than its cost of capital. However, the negative number indicates the
project is not making sufficient profit for covering up the cost for carrying on the business
(Modesti, 2014).
Paraphrase This Document
Need a fresh take? Get an instant paraphrase of this document with our AI Paraphraser

7MANAGERIAL FINANCE
Market value added
The computation of market value added (MVA) reveals the difference among the
capital contribution by the investors and market value of that company. In short, it is the total
of all the capital claims against company in addition to the market value of equity and debt.
MVA is calculated as –
MVA = Market value of stocks – Book value of the shareholder’s equity
Number of outstanding shares = 25,50,014,230
Market value per stock = 87.69
Market value of stock = 25,50,014,230 * 87.69 = $ 223,610 million
Book value of shareholder’s equity = $ 55,778 million
Therefore, MVA = $ 223,610 million - $ 55,778 million = $ 167,832.75 million.
As the MVA of the company is positive, it can be stated that the company is earning
sufficient return on its stock.
Computation of the ratio
Ratio Formula 2013 2014 2015 2016 2017
Earnings per share Net income/outstanding share 5.46 3.89 -39.15 51.23 51.49
Price earnings ratio Price per share/earnings per share 12.27 19.55 -1.94 1.65 1.68
Stock movement
P & G Stock movement
Date
Adj
Close
Retur
n
2/1/2013 65.13781
3/1/2013
65.89025
1 1.16%

8MANAGERIAL FINANCE
4/1/2013
65.64227
3
-
0.38%
5/1/2013
66.11595
9 0.72%
6/1/2013
66.31405
6 0.30%
7/1/2013 69.1651 4.30%
8/1/2013
67.59179
7
-
2.27%
9/1/2013
65.59590
1
-
2.95%
10/1/201
3
70.07366
9 6.83%
11/1/201
3
73.65628
1 5.11%
12/1/201
3
71.19874
6
-
3.34%
1/1/2014
67.00952
9
-
5.88%
2/1/2014
69.31409
5 3.44%
3/1/2014 71.02359 2.47%
4/1/2014 72.74192 2.42%
5/1/2014
71.75978
9
-
1.35%
6/1/2014
69.80569
5
-
2.72%
7/1/2014
68.67765
8
-
1.62%
8/1/2014
74.41019
4 8.35%
9/1/2014
74.97424
3 0.76%
10/1/201
4
78.13472
7 4.22%
11/1/201
4
81.58492
3 4.42%
12/1/201
4
82.18035
9 0.73%
1/1/2015
76.04548
6
-
7.47%
2/1/2015
77.34957
1 1.71%
3/1/2015
74.45113
4
-
3.75%
4/1/2015
72.24321
7
-
2.97%
5/1/2015 71.79847
-
0.62%

9MANAGERIAL FINANCE
6/1/2015
71.66109
5
-
0.19%
7/1/2015 70.25058
-
1.97%
8/1/2015
65.25764
5
-
7.11%
9/1/2015
66.43037
4 1.80%
10/1/201
5
70.53033
4 6.17%
11/1/201
5
69.72940
8
-
1.14%
12/1/201
5 73.98735 6.11%
1/1/2016
76.11164
9 2.87%
2/1/2016
75.45926
7
-
0.86%
3/1/2016
77.35772
7 2.52%
4/1/2016 75.2995
-
2.66%
5/1/2016
76.78807
1 1.98%
6/1/2016
80.22760
8 4.48%
7/1/2016
81.09933
5 1.09%
8/1/2016
83.37735
7 2.81%
9/1/2016
85.70746
6 2.79%
10/1/201
6
82.89033
5
-
3.29%
11/1/201
6
79.35379
8
-
4.27%
12/1/201
6
80.91277
3 1.96%
1/1/2017
84.30017
9 4.19%
2/1/2017 88.33403 4.79%
3/1/2017
87.15068
1
-
1.34%
4/1/2017 84.70639
-
2.80%
5/1/2017
86.09781
6 1.64%
6/1/2017
85.17907
7
-
1.07%
Secure Best Marks with AI Grader
Need help grading? Try our AI Grader for instant feedback on your assignments.

10MANAGERIAL FINANCE
7/1/2017
88.76608
3 4.21%
8/1/2017
90.89081
6 2.39%
9/1/2017
89.62009
4
-
1.40%
10/1/201
7
85.04945
4
-
5.10%
11/1/201
7
89.30915
1 5.01%
12/1/201
7
91.18485
3 2.10%
1/1/2018
86.29215
2
-
5.37%
1/30/201
8
86.94999
7 0.76%
01/02/2013
03/05/2013
02/08/2013
01/11/2013
31/01/2014
02/05/2014
01/08/2014
31/10/2014
30/01/2015
01/05/2015
31/07/2015
30/10/2015
29/01/2016
29/04/2016
29/07/2016
28/10/2016
27/01/2017
28/04/2017
28/07/2017
27/10/2017
26/01/2018
-0.08
-0.06
-0.04
-0.02
0
0.02
0.04
0.06
0.08
0.1
P & G Return
Return
The stock movement of Procter and Gamble as can be seen from the above stock
movement graph is fluctuating. Therefore, the stock will be considered as volatile.
Financial analysis ratio
Ratio Formula 2013 2014 2015 2016 2017
Industry
standar
d
Current ratio
Current assets/current
liabilities 0.80 0.94 1.00 1.10 0.88
1

11MANAGERIAL FINANCE
Return on
assets NPAT/ Total assets 0.08 0.08 0.07 0.08 0.08
0.06
Return on
equity NPAT/Total equity 0.17 0.17 0.14 0.17 0.18
0.25
Debt equity
ratio
Total liabilities/Shareholder's
equity 1.05 1.08 1.07 1.22 1.18
0.8
From the above ratio computation it can be identified that if the company is regular in
providing return to its shareholder as well as return on assets. Further, company is efficient in
paying their short-term obligation with available short-term assets. Further, though the ROE
is lower than the industry average other ratios are at par with the industry average. However,
looking into the debt equity ratio it is recognized that the debt component in the capital
structure is quite high as compared to the equity component. Therefore, for additional
requirement of finance for the purpose of future growth the company shall raise it through
equity as further burden of debt and interest may lead the company to unsustainable position.
Impact of macroeconomic factors
The demand of P & G products are depended upon the correlation to the global
macroeconomic factors. The present macroeconomic factors are dynamic. The economic
changes political unrest, terrorist activity and various natural disasters may lead to inflation,
deflation, business interruption or reduction in demands for products. The success of the
company is depended on the ability of the company to manage the political and economic
uncertainty constantly (Mokhova & Zinecker, 2014).. The company can also be negatively
impacted by the regional, global or the disruption of the credit markets. Apart from that,
changes in the exchange control and various other limits can limit the ability of the company
to repatriate the earnings from overseas.
Return on
assets NPAT/ Total assets 0.08 0.08 0.07 0.08 0.08
0.06
Return on
equity NPAT/Total equity 0.17 0.17 0.14 0.17 0.18
0.25
Debt equity
ratio
Total liabilities/Shareholder's
equity 1.05 1.08 1.07 1.22 1.18
0.8
From the above ratio computation it can be identified that if the company is regular in
providing return to its shareholder as well as return on assets. Further, company is efficient in
paying their short-term obligation with available short-term assets. Further, though the ROE
is lower than the industry average other ratios are at par with the industry average. However,
looking into the debt equity ratio it is recognized that the debt component in the capital
structure is quite high as compared to the equity component. Therefore, for additional
requirement of finance for the purpose of future growth the company shall raise it through
equity as further burden of debt and interest may lead the company to unsustainable position.
Impact of macroeconomic factors
The demand of P & G products are depended upon the correlation to the global
macroeconomic factors. The present macroeconomic factors are dynamic. The economic
changes political unrest, terrorist activity and various natural disasters may lead to inflation,
deflation, business interruption or reduction in demands for products. The success of the
company is depended on the ability of the company to manage the political and economic
uncertainty constantly (Mokhova & Zinecker, 2014).. The company can also be negatively
impacted by the regional, global or the disruption of the credit markets. Apart from that,
changes in the exchange control and various other limits can limit the ability of the company
to repatriate the earnings from overseas.

12MANAGERIAL FINANCE
Reference
Modesti, P. (2014). Economic Value Added. In Encyclopedia of Business Analytics and
Optimization (pp. 773-778). IGI Global.
Mokhova, N., & Zinecker, M. (2014). Macroeconomic factors and corporate capital
structure. Procedia-Social and Behavioral Sciences, 110, 530-540.
Reference
Modesti, P. (2014). Economic Value Added. In Encyclopedia of Business Analytics and
Optimization (pp. 773-778). IGI Global.
Mokhova, N., & Zinecker, M. (2014). Macroeconomic factors and corporate capital
structure. Procedia-Social and Behavioral Sciences, 110, 530-540.
1 out of 13
Related Documents

Your All-in-One AI-Powered Toolkit for Academic Success.
 +13062052269
info@desklib.com
Available 24*7 on WhatsApp / Email
Unlock your academic potential
© 2024  |  Zucol Services PVT LTD  |  All rights reserved.