Economics Project Report: Financial Performance Analysis of P&G
VerifiedAdded on 2023/06/13
|27
|7111
|335
Report
AI Summary
This research paper presents a detailed financial analysis of Procter & Gamble (P&G) over the past five years. It examines the company's financial position and performance, considering both micro and macro economic factors influencing the business and industry. The analysis includes an evaluation of P&G's balance sheet, income statement, and cash flow statement, along with ratio analysis to assess profitability, liquidity, debt management, asset efficiency, and market value. The report highlights key trends, such as changes in asset growth, sales turnover, and cash flow, to provide insights into the company's financial strategies and overall performance. The research employs a quantitative approach, utilizing data from annual reports and financial websites to forecast the future financial health of the company. Desklib offers various study tools, including past papers and solved assignments.
Running Head: Economics
1
Project Report: Economics
1
Project Report: Economics
Paraphrase This Document
Need a fresh take? Get an instant paraphrase of this document with our AI Paraphraser
Economics
2
Executive summary
The research paper briefs about the financial position and performance of the
company, Proctor and Gamble. The research paper includes the financial position and
performance of company of last 5 years. The report brief about the various micro and macro
economical factors of the company and the industry and explains that how the financial
performance of the company has been affected. It evaluates that whether the current position
of the company is good or not and how many changes have taken place into the financial
position of the company in last 5 years. The financial performance of the company of last 5
years have been evaluated and at the same time, the growth of the company’s financial
position and financial performance have been calculated to measure the performance and
forecast the future of the company.
Economics
3
Contents
Introduction.......................................................................................................................4
Company overview...........................................................................................................4
Purpose and scope.............................................................................................................4
Balance sheet....................................................................................................................5
Income statement..............................................................................................................6
Cash flow statement..........................................................................................................7
Ratio analysis....................................................................................................................8
Other values....................................................................................................................10
Conclusion and recommendation...................................................................................11
References.......................................................................................................................12
Appendix.........................................................................................................................14
⊘ This is a preview!⊘
Do you want full access?
Subscribe today to unlock all pages.
Trusted by 1+ million students worldwide
Economics
4
Introduction:
Financial analysis is an examination on the financial information which is done by the
analyst or other related parties of an organization to make a decision about the business or for
the business. Basically, the financial analysis grades in the reallocation of the resources to
create specific information in context with the business. Financial analysis is the main key
tool which is required by the managers of a company to evaluate the performance of an
organization (Entwistle, 2015). Financial analysis process evaluates the financial data of the
company and assists the stakeholders and the management of the company to make a decision
about the performance of the company.
In the report, financial performance of the company of last 5 years have been
evaluated and at the same time, the growth of the company’s financial position and financial
performance have been calculated to measure the performance and forecast the future of the
company. The report brief about the various micro and macro economical factors of the
company and the industry and explains that how the financial performance of the company
has been affected.
Company overview:
Procter and Gamble co is an American company which is running its business at
international level. Headquarter of the company is at downtown Cincinnati in Ohio. The
company has been founded by British American William Procter and James gamble, an Irish
American. The main products of the company are cleaning agents, hygiene products, personal
care, beauty care; diagnostics’ products etc. the company has made various changes into its
operations to maintain the performance and the profitability level of the company (Home,
2018). Company has dropped the sales of 100 brands so that it could focus on the 65 brands
which generate 95% revenue of the company (Reuters, 2018). According to annual report
(2017), 95000 people are working with the company and the company is serving its product
worldwide except North Korea and Cuba.
Purpose and scope:
Objective of research:
The research paper has been prepared to evaluate the financial performance and the
position of P&G as well as forecast the future performance of the company on the basis of
Paraphrase This Document
Need a fresh take? Get an instant paraphrase of this document with our AI Paraphraser
Economics
5
last 5 year’s data. The main objectives of the research paper is to understand about the
financial concepts, financial analysis methods, the use of financial methods, interpretation
etc. It briefs that whether the financial performance of the company is good or not as well as
how the company in performing in context with the investor’s perception.
Data sources:
For the report and analysis on Procter and Gambles, data has been collected from the
annual reports, yahoo finance, Morningstar etc. Various financial websites have been used to
evaluate and analyze the performance of the company. The data sources are reliable and the
data has been collected in an honest way.
Research methodology:
For the research, quantitative approach has been used. The data of the company has
been collected from the reliable sources and have been evaluated on the basis of various
techniques of financial analysis. For the study, 5 year data of the company has been taken
into the concern. The data has been evaluated on the basis of various statistical methods and
in a descriptive way. Confidentiality has also been maintained while conducting the research.
Thus, it could be said that the research has been done in a reliable way and the honesty and
ethical values have been concerned.
Balance sheet:
Firstly, balance sheet of the company has been evaluated for the research part.
Balance sheet is one of the crucial financial statements of a business which states about the
financial performance of the company. It includes the total assets, total liabilities and
stockholder’s equity of the company. The balance sheet of P&G briefs about numerous
changes in last 5 years.
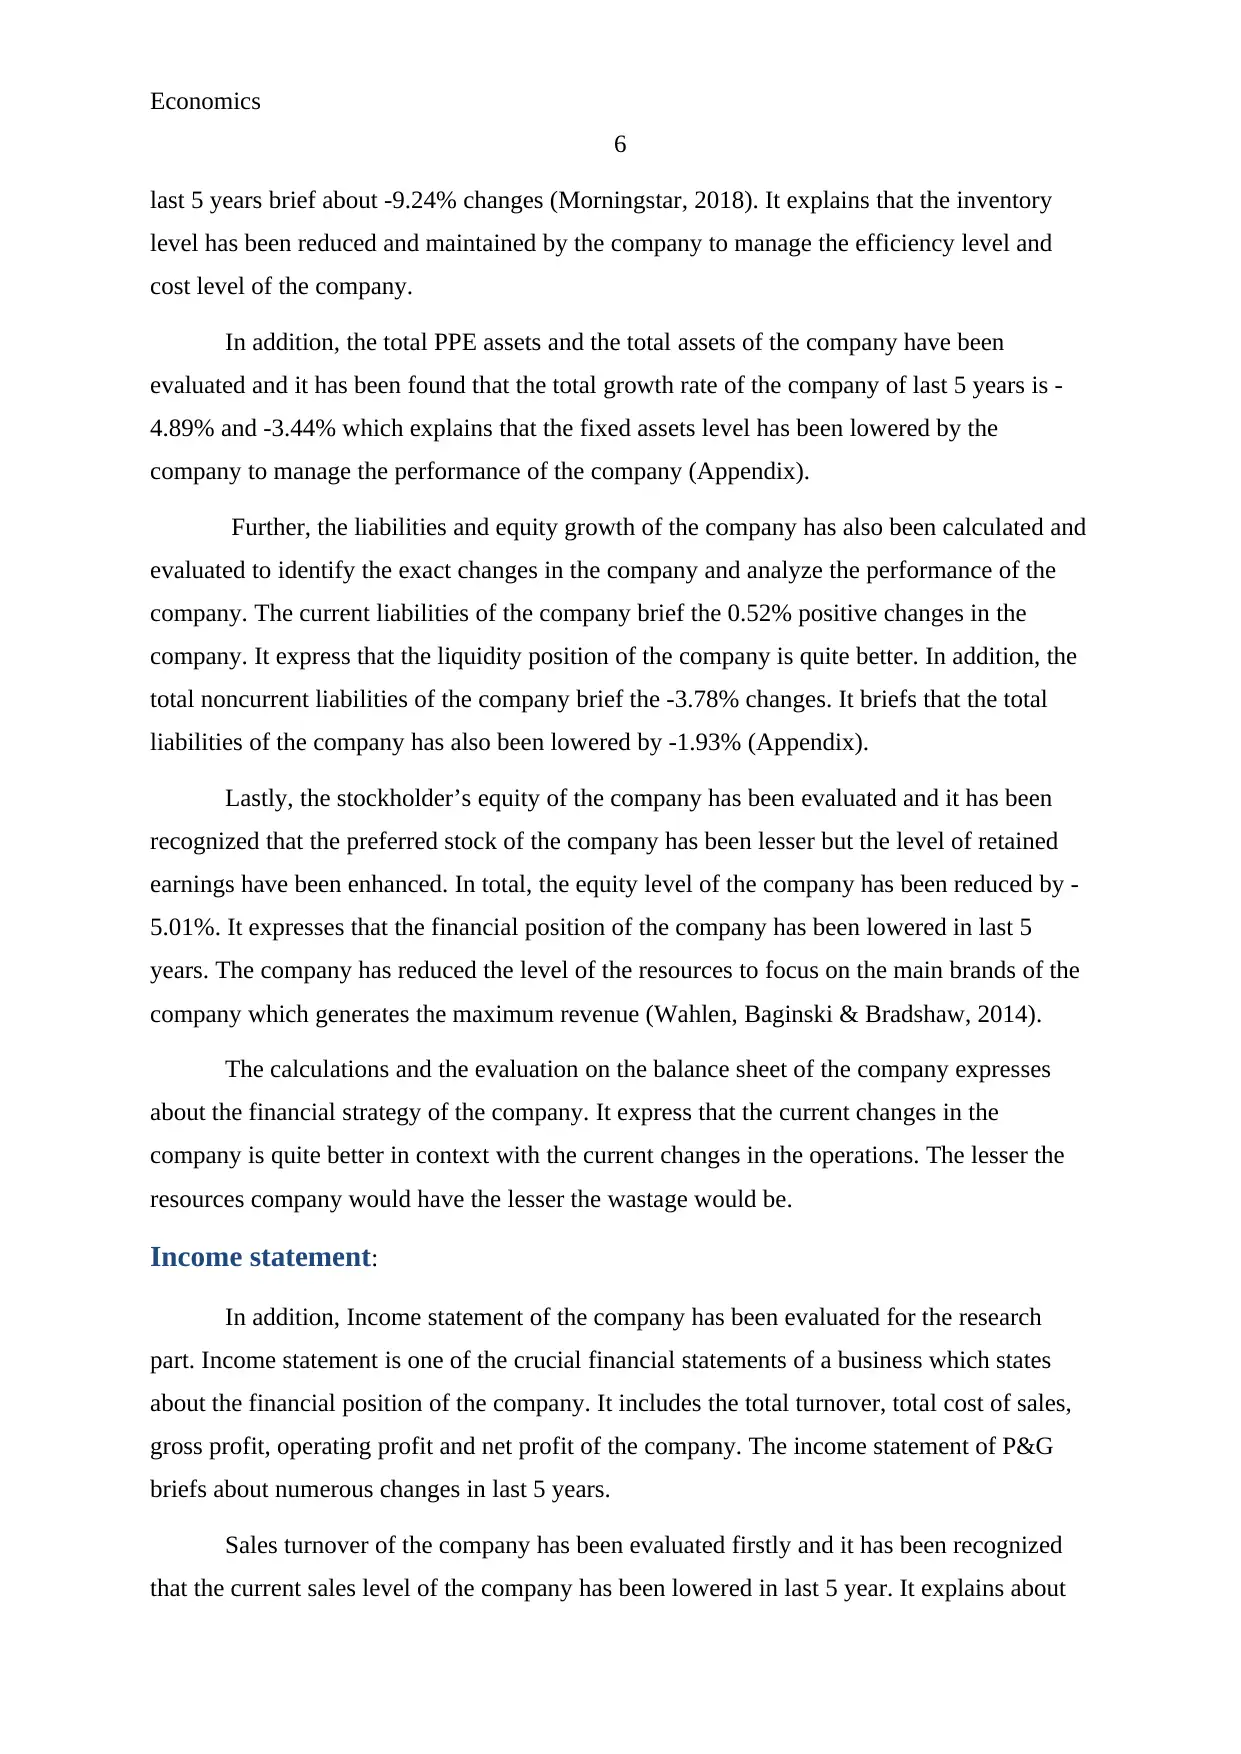
Asset growth of the company has been evaluated firstly and it has been recognized
that the current assets level of the company has been enhanced in 2016 but the 2017 report
explains about the decrement in the current assets level. In last 5 years, the growth rate of the
current assets of the company is 4.48% which briefs about positive financial performance of
the company and better liquidity position of the company (Annual Report, 2017).
The main assets of the company are inventory, receivables and PPE. The receivables
figure of last 5 years brief about -7.69% changes in the company and the inventory figures of
5
last 5 year’s data. The main objectives of the research paper is to understand about the
financial concepts, financial analysis methods, the use of financial methods, interpretation
etc. It briefs that whether the financial performance of the company is good or not as well as
how the company in performing in context with the investor’s perception.
Data sources:
For the report and analysis on Procter and Gambles, data has been collected from the
annual reports, yahoo finance, Morningstar etc. Various financial websites have been used to
evaluate and analyze the performance of the company. The data sources are reliable and the
data has been collected in an honest way.
Research methodology:
For the research, quantitative approach has been used. The data of the company has
been collected from the reliable sources and have been evaluated on the basis of various
techniques of financial analysis. For the study, 5 year data of the company has been taken
into the concern. The data has been evaluated on the basis of various statistical methods and
in a descriptive way. Confidentiality has also been maintained while conducting the research.
Thus, it could be said that the research has been done in a reliable way and the honesty and
ethical values have been concerned.
Balance sheet:
Firstly, balance sheet of the company has been evaluated for the research part.
Balance sheet is one of the crucial financial statements of a business which states about the
financial performance of the company. It includes the total assets, total liabilities and
stockholder’s equity of the company. The balance sheet of P&G briefs about numerous
changes in last 5 years.
Asset growth of the company has been evaluated firstly and it has been recognized
that the current assets level of the company has been enhanced in 2016 but the 2017 report
explains about the decrement in the current assets level. In last 5 years, the growth rate of the
current assets of the company is 4.48% which briefs about positive financial performance of
the company and better liquidity position of the company (Annual Report, 2017).
The main assets of the company are inventory, receivables and PPE. The receivables
figure of last 5 years brief about -7.69% changes in the company and the inventory figures of
Economics
6
last 5 years brief about -9.24% changes (Morningstar, 2018). It explains that the inventory
level has been reduced and maintained by the company to manage the efficiency level and
cost level of the company.
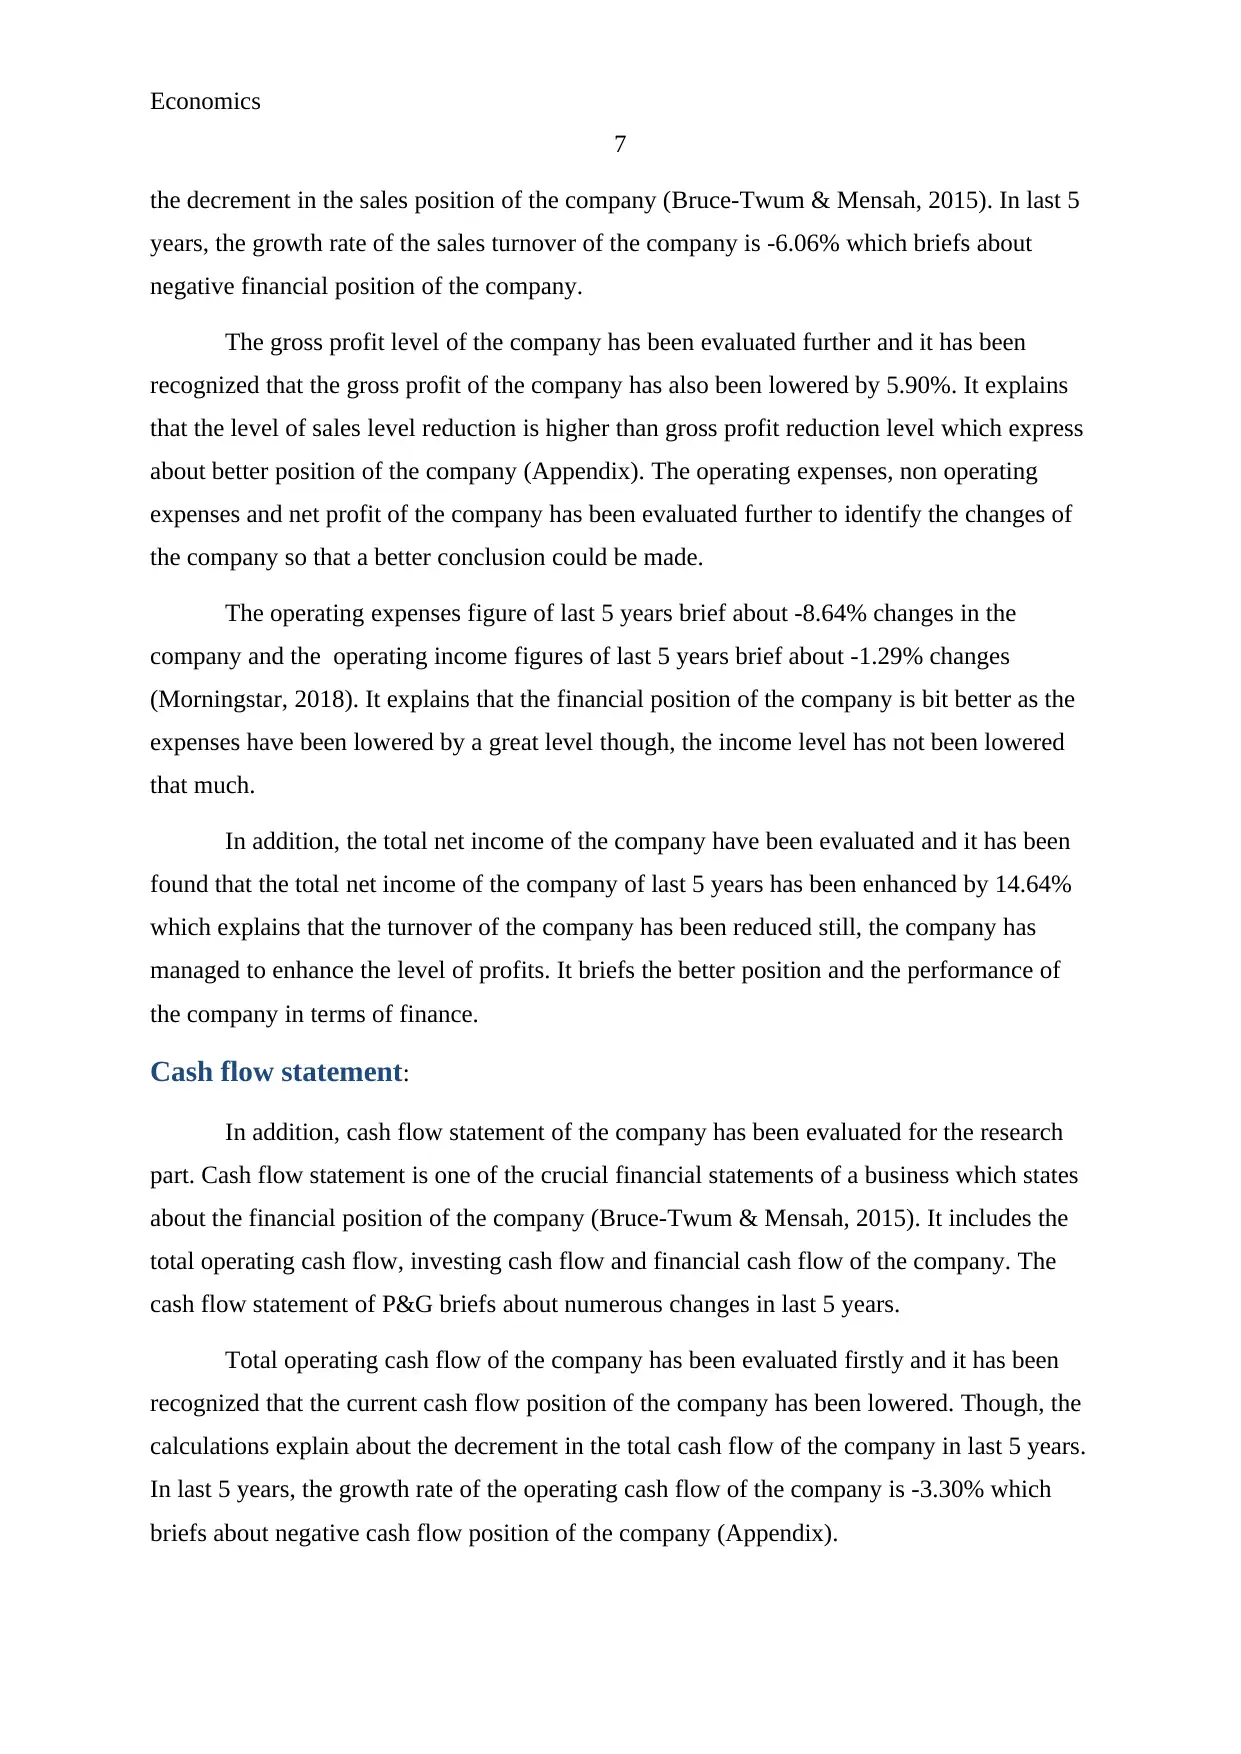
In addition, the total PPE assets and the total assets of the company have been
evaluated and it has been found that the total growth rate of the company of last 5 years is -
4.89% and -3.44% which explains that the fixed assets level has been lowered by the
company to manage the performance of the company (Appendix).
Further, the liabilities and equity growth of the company has also been calculated and
evaluated to identify the exact changes in the company and analyze the performance of the
company. The current liabilities of the company brief the 0.52% positive changes in the
company. It express that the liquidity position of the company is quite better. In addition, the
total noncurrent liabilities of the company brief the -3.78% changes. It briefs that the total
liabilities of the company has also been lowered by -1.93% (Appendix).
Lastly, the stockholder’s equity of the company has been evaluated and it has been
recognized that the preferred stock of the company has been lesser but the level of retained
earnings have been enhanced. In total, the equity level of the company has been reduced by -
5.01%. It expresses that the financial position of the company has been lowered in last 5
years. The company has reduced the level of the resources to focus on the main brands of the
company which generates the maximum revenue (Wahlen, Baginski & Bradshaw, 2014).
The calculations and the evaluation on the balance sheet of the company expresses
about the financial strategy of the company. It express that the current changes in the
company is quite better in context with the current changes in the operations. The lesser the
resources company would have the lesser the wastage would be.
Income statement:
In addition, Income statement of the company has been evaluated for the research
part. Income statement is one of the crucial financial statements of a business which states
about the financial position of the company. It includes the total turnover, total cost of sales,
gross profit, operating profit and net profit of the company. The income statement of P&G
briefs about numerous changes in last 5 years.
Sales turnover of the company has been evaluated firstly and it has been recognized
that the current sales level of the company has been lowered in last 5 year. It explains about
6
last 5 years brief about -9.24% changes (Morningstar, 2018). It explains that the inventory
level has been reduced and maintained by the company to manage the efficiency level and
cost level of the company.
In addition, the total PPE assets and the total assets of the company have been
evaluated and it has been found that the total growth rate of the company of last 5 years is -
4.89% and -3.44% which explains that the fixed assets level has been lowered by the
company to manage the performance of the company (Appendix).
Further, the liabilities and equity growth of the company has also been calculated and
evaluated to identify the exact changes in the company and analyze the performance of the
company. The current liabilities of the company brief the 0.52% positive changes in the
company. It express that the liquidity position of the company is quite better. In addition, the
total noncurrent liabilities of the company brief the -3.78% changes. It briefs that the total
liabilities of the company has also been lowered by -1.93% (Appendix).
Lastly, the stockholder’s equity of the company has been evaluated and it has been
recognized that the preferred stock of the company has been lesser but the level of retained
earnings have been enhanced. In total, the equity level of the company has been reduced by -
5.01%. It expresses that the financial position of the company has been lowered in last 5
years. The company has reduced the level of the resources to focus on the main brands of the
company which generates the maximum revenue (Wahlen, Baginski & Bradshaw, 2014).
The calculations and the evaluation on the balance sheet of the company expresses
about the financial strategy of the company. It express that the current changes in the
company is quite better in context with the current changes in the operations. The lesser the
resources company would have the lesser the wastage would be.
Income statement:
In addition, Income statement of the company has been evaluated for the research
part. Income statement is one of the crucial financial statements of a business which states
about the financial position of the company. It includes the total turnover, total cost of sales,
gross profit, operating profit and net profit of the company. The income statement of P&G
briefs about numerous changes in last 5 years.
Sales turnover of the company has been evaluated firstly and it has been recognized
that the current sales level of the company has been lowered in last 5 year. It explains about
⊘ This is a preview!⊘
Do you want full access?
Subscribe today to unlock all pages.
Trusted by 1+ million students worldwide
Economics
7
the decrement in the sales position of the company (Bruce-Twum & Mensah, 2015). In last 5
years, the growth rate of the sales turnover of the company is -6.06% which briefs about
negative financial position of the company.
The gross profit level of the company has been evaluated further and it has been
recognized that the gross profit of the company has also been lowered by 5.90%. It explains
that the level of sales level reduction is higher than gross profit reduction level which express
about better position of the company (Appendix). The operating expenses, non operating
expenses and net profit of the company has been evaluated further to identify the changes of
the company so that a better conclusion could be made.
The operating expenses figure of last 5 years brief about -8.64% changes in the
company and the operating income figures of last 5 years brief about -1.29% changes
(Morningstar, 2018). It explains that the financial position of the company is bit better as the
expenses have been lowered by a great level though, the income level has not been lowered
that much.
In addition, the total net income of the company have been evaluated and it has been
found that the total net income of the company of last 5 years has been enhanced by 14.64%
which explains that the turnover of the company has been reduced still, the company has
managed to enhance the level of profits. It briefs the better position and the performance of
the company in terms of finance.
Cash flow statement:
In addition, cash flow statement of the company has been evaluated for the research
part. Cash flow statement is one of the crucial financial statements of a business which states
about the financial position of the company (Bruce-Twum & Mensah, 2015). It includes the
total operating cash flow, investing cash flow and financial cash flow of the company. The
cash flow statement of P&G briefs about numerous changes in last 5 years.
Total operating cash flow of the company has been evaluated firstly and it has been
recognized that the current cash flow position of the company has been lowered. Though, the
calculations explain about the decrement in the total cash flow of the company in last 5 years.
In last 5 years, the growth rate of the operating cash flow of the company is -3.30% which
briefs about negative cash flow position of the company (Appendix).
Paraphrase This Document
Need a fresh take? Get an instant paraphrase of this document with our AI Paraphraser
Economics
8
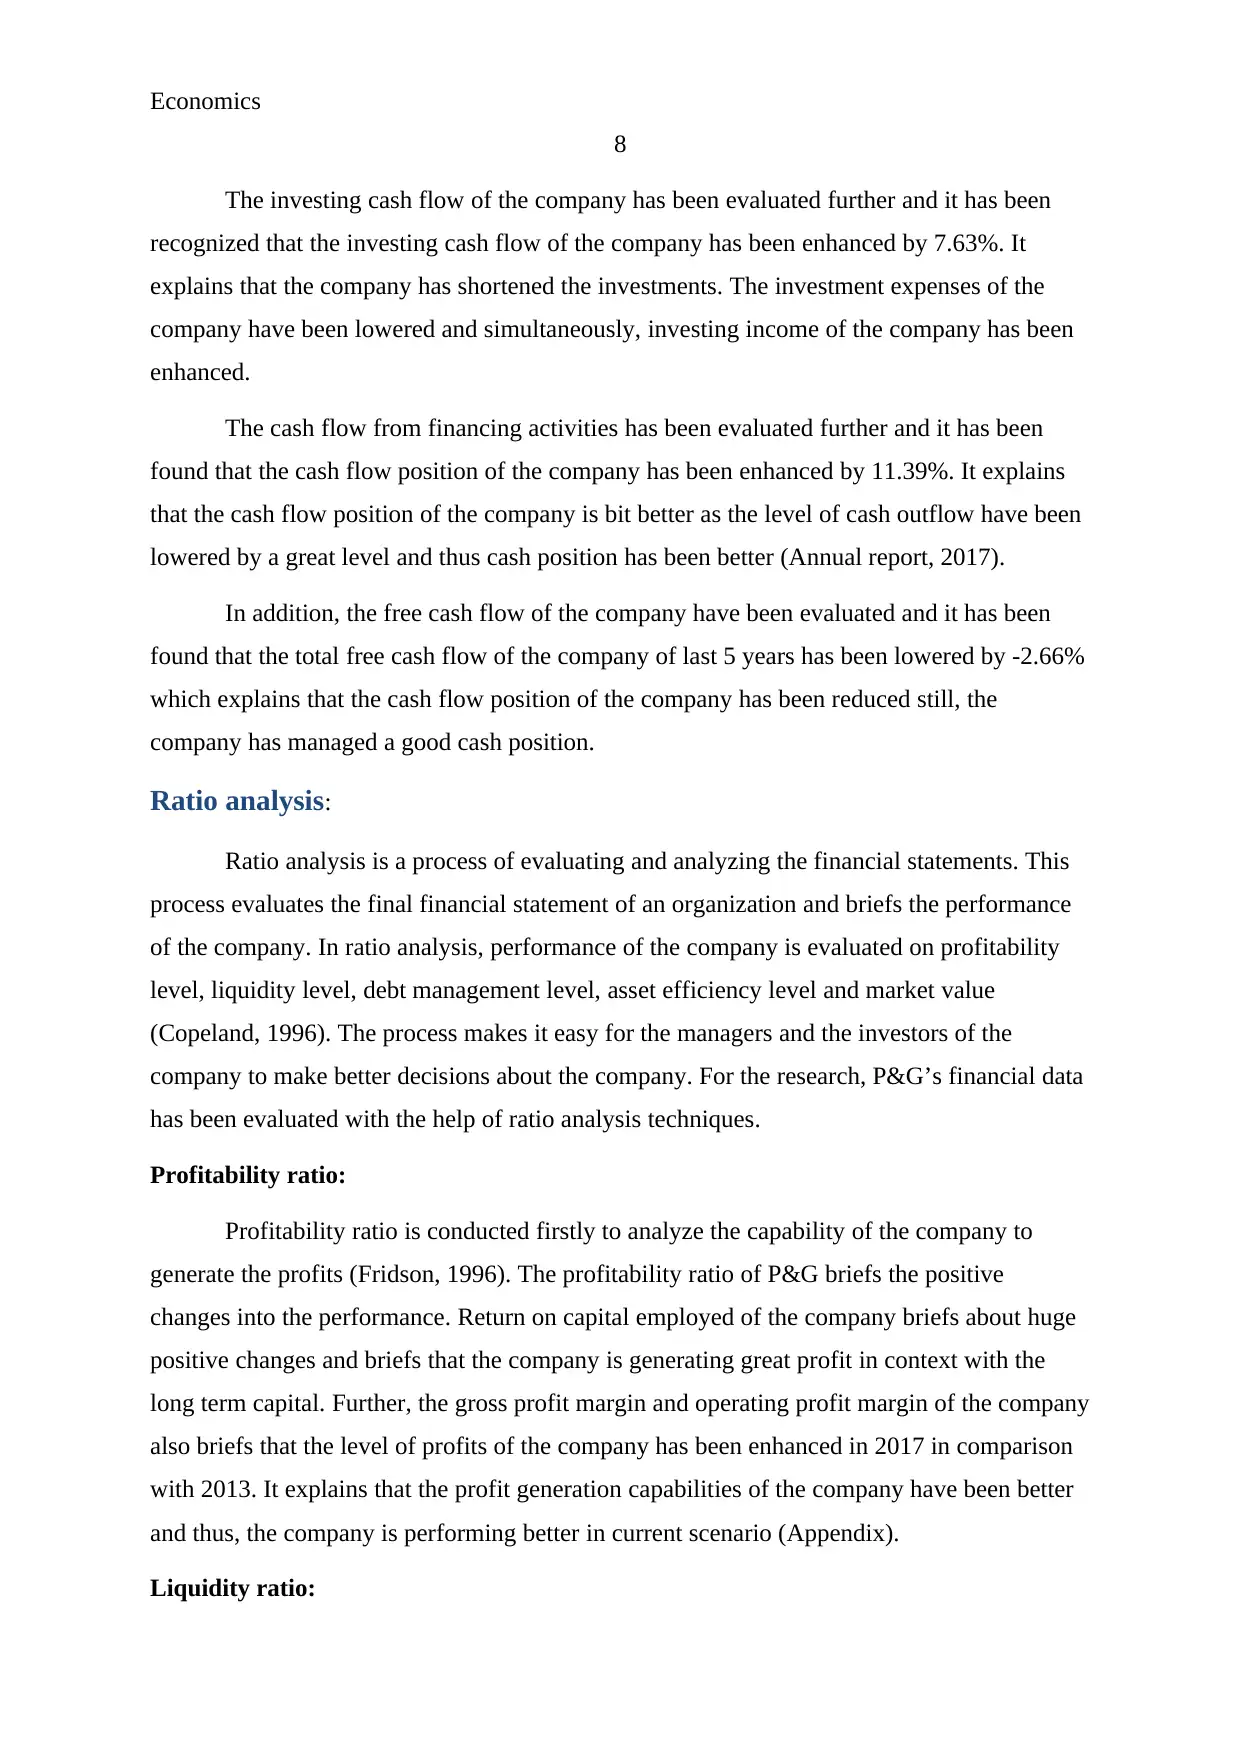
The investing cash flow of the company has been evaluated further and it has been
recognized that the investing cash flow of the company has been enhanced by 7.63%. It
explains that the company has shortened the investments. The investment expenses of the
company have been lowered and simultaneously, investing income of the company has been
enhanced.
The cash flow from financing activities has been evaluated further and it has been
found that the cash flow position of the company has been enhanced by 11.39%. It explains
that the cash flow position of the company is bit better as the level of cash outflow have been
lowered by a great level and thus cash position has been better (Annual report, 2017).
In addition, the free cash flow of the company have been evaluated and it has been
found that the total free cash flow of the company of last 5 years has been lowered by -2.66%
which explains that the cash flow position of the company has been reduced still, the
company has managed a good cash position.
Ratio analysis:
Ratio analysis is a process of evaluating and analyzing the financial statements. This
process evaluates the final financial statement of an organization and briefs the performance
of the company. In ratio analysis, performance of the company is evaluated on profitability
level, liquidity level, debt management level, asset efficiency level and market value
(Copeland, 1996). The process makes it easy for the managers and the investors of the
company to make better decisions about the company. For the research, P&G’s financial data
has been evaluated with the help of ratio analysis techniques.
Profitability ratio:
Profitability ratio is conducted firstly to analyze the capability of the company to
generate the profits (Fridson, 1996). The profitability ratio of P&G briefs the positive
changes into the performance. Return on capital employed of the company briefs about huge
positive changes and briefs that the company is generating great profit in context with the
long term capital. Further, the gross profit margin and operating profit margin of the company
also briefs that the level of profits of the company has been enhanced in 2017 in comparison
with 2013. It explains that the profit generation capabilities of the company have been better
and thus, the company is performing better in current scenario (Appendix).
Liquidity ratio:
8
The investing cash flow of the company has been evaluated further and it has been
recognized that the investing cash flow of the company has been enhanced by 7.63%. It
explains that the company has shortened the investments. The investment expenses of the
company have been lowered and simultaneously, investing income of the company has been
enhanced.
The cash flow from financing activities has been evaluated further and it has been
found that the cash flow position of the company has been enhanced by 11.39%. It explains
that the cash flow position of the company is bit better as the level of cash outflow have been
lowered by a great level and thus cash position has been better (Annual report, 2017).
In addition, the free cash flow of the company have been evaluated and it has been
found that the total free cash flow of the company of last 5 years has been lowered by -2.66%
which explains that the cash flow position of the company has been reduced still, the
company has managed a good cash position.
Ratio analysis:
Ratio analysis is a process of evaluating and analyzing the financial statements. This
process evaluates the final financial statement of an organization and briefs the performance
of the company. In ratio analysis, performance of the company is evaluated on profitability
level, liquidity level, debt management level, asset efficiency level and market value
(Copeland, 1996). The process makes it easy for the managers and the investors of the
company to make better decisions about the company. For the research, P&G’s financial data
has been evaluated with the help of ratio analysis techniques.
Profitability ratio:
Profitability ratio is conducted firstly to analyze the capability of the company to
generate the profits (Fridson, 1996). The profitability ratio of P&G briefs the positive
changes into the performance. Return on capital employed of the company briefs about huge
positive changes and briefs that the company is generating great profit in context with the
long term capital. Further, the gross profit margin and operating profit margin of the company
also briefs that the level of profits of the company has been enhanced in 2017 in comparison
with 2013. It explains that the profit generation capabilities of the company have been better
and thus, the company is performing better in current scenario (Appendix).
Liquidity ratio:
Economics
9
Liquidity ratio is conducted further to analyze the capability of the company to pay
off its short term debt obligations. The liquidity ratio of P&G briefs the slight negative
changes into the position of the company. Current ratio of the company briefs about huge
lower level of current assets in context with the current liabilities of the company. Further,
the quick ratio of the company also briefs that the level of liquidity position of the company
has been lowered in 2017 in comparison with 2013 (Appendix). It explains that the liquidity
position and short term debt payment capabilities of the company have been lowered and
thus, the company is required to enhance the level of current assets.
Asset management ratio:
Assets management ratio is conducted in addition to analyze the capability of the
company to manage the assets, working capital and profits of the company. The asset
management ratio of P&G briefs the slight changes into the performance. Creditor’s turnover
ratio of the company briefs about high turnover days which means the company would be
able to manage the work in lesser working capital. Further, the inventory turnover days and
receivable turnover days of the company also briefs that the turnover days have been lowered
which means the cash would be received by the company quickly and less working capital
would be required (Appendix). It explains that the asset management and efficiency
capabilities of the company have been better and thus, the company is performing better in
current scenario.
Debt management ratio:
Additionally, debt management ratio is conducted to analyze the capital structure
position of the company. The debt management ratio of P&G briefs the slight changes into
the performance. Debt to equity ratio of the company briefs about lower changes and briefs
that the level of equity of the company is quite higher than the debt of the company. Further,
the debt ratio of the company also briefs that the debt level of the company in context with
the total assets of the company is better (Appendix). It explains that the company is required
to maintain the optimal capital structure so that the risk and cost of the company could be
managed.
Market value ratios:
Market value ratio is conducted lastly to analyze the performance of the company in
the industry. The market value ratios ratio of P&G briefs the positive changes into the
⊘ This is a preview!⊘
Do you want full access?
Subscribe today to unlock all pages.
Trusted by 1+ million students worldwide
Economics
10
performance. Earnings per share of the company briefs huge positive changes and briefs that
the company is managing a good position in market (Appendix). Further, the dividend
coverage ratio of the company also briefs that the company has paid a great amount of
dividend to the shareholders. It explains that the market position of the company has been
better.
Other values:
After evaluating the financial statement of the company, various other financial and
non financial figures of the company has been evaluated. The tax rates of the company is
quite similar in last 5 years as no government regulations have been changed in context with
the taxation system of the country. Though, the total taxation amount of the company has
been lowered due to less sales turnover and lesser cash inflow of the company. Further,
WACC of the company has been evaluated and it has been found that the current WACC of
the company is 3.51%. The cost of debt of the company is 5.60% and the total weight of the
debt is 24.60%. On the other hand, the cost of equity is 2.83% and the weight is 75.40%. It
briefs that the cost of capital of the company is quite lower (Bloomberg, 2018).
In addition, the economic value added and market value added of the company has
been evaluated and it has been found that the economic and market position of the company
has been better. MVA analysis briefs about great position of the company. These calculations
brief that the company is a good option for the purpose of investment (Financial times, 2018).
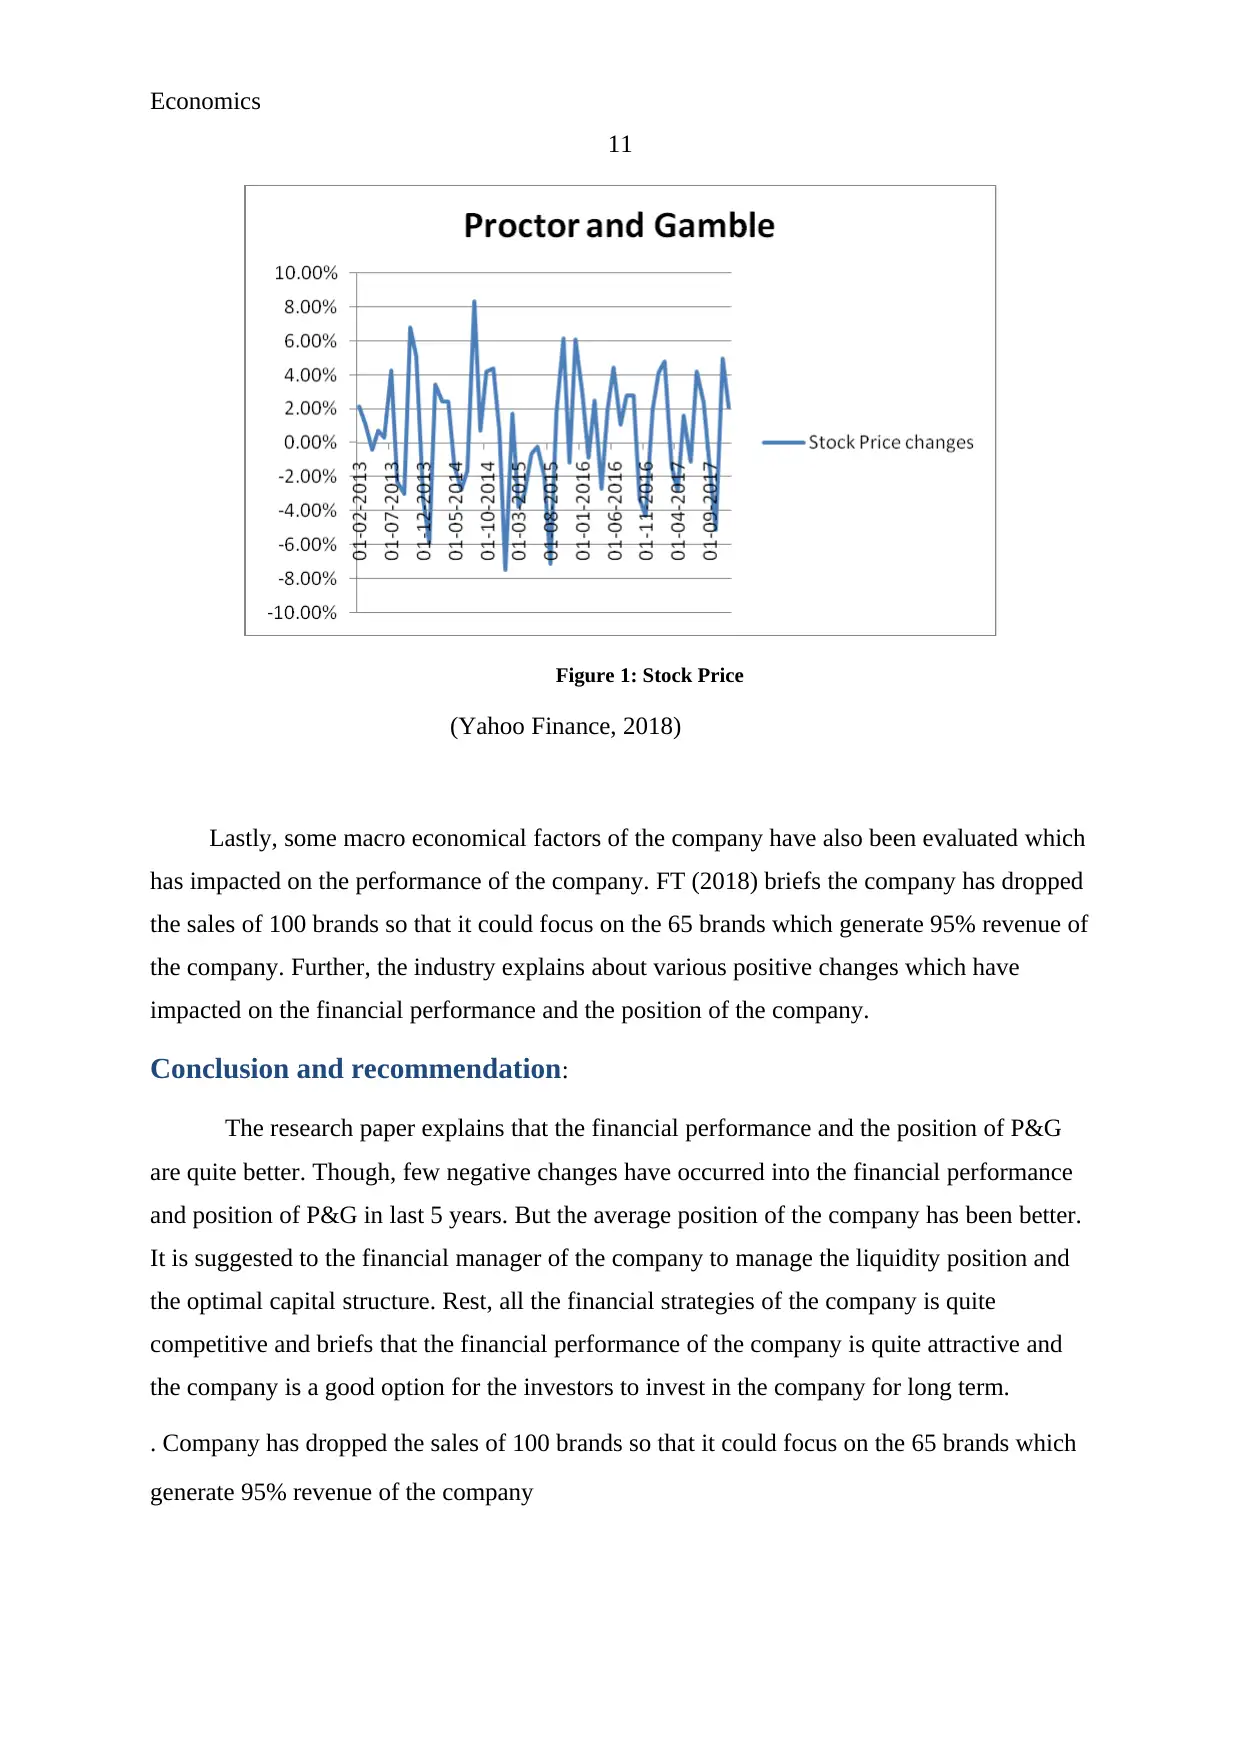
Stock price of the company has been analyzed further to identify the changes into the
company. The stock price of the company has been fluctuated a lot in last 5 years. The
average changes in the stock price of the company in last 5 years are 0.67% which explains
that the stock price of the company has been enhanced.
10
performance. Earnings per share of the company briefs huge positive changes and briefs that
the company is managing a good position in market (Appendix). Further, the dividend
coverage ratio of the company also briefs that the company has paid a great amount of
dividend to the shareholders. It explains that the market position of the company has been
better.
Other values:
After evaluating the financial statement of the company, various other financial and
non financial figures of the company has been evaluated. The tax rates of the company is
quite similar in last 5 years as no government regulations have been changed in context with
the taxation system of the country. Though, the total taxation amount of the company has
been lowered due to less sales turnover and lesser cash inflow of the company. Further,
WACC of the company has been evaluated and it has been found that the current WACC of
the company is 3.51%. The cost of debt of the company is 5.60% and the total weight of the
debt is 24.60%. On the other hand, the cost of equity is 2.83% and the weight is 75.40%. It
briefs that the cost of capital of the company is quite lower (Bloomberg, 2018).
In addition, the economic value added and market value added of the company has
been evaluated and it has been found that the economic and market position of the company
has been better. MVA analysis briefs about great position of the company. These calculations
brief that the company is a good option for the purpose of investment (Financial times, 2018).
Stock price of the company has been analyzed further to identify the changes into the
company. The stock price of the company has been fluctuated a lot in last 5 years. The
average changes in the stock price of the company in last 5 years are 0.67% which explains
that the stock price of the company has been enhanced.
Paraphrase This Document
Need a fresh take? Get an instant paraphrase of this document with our AI Paraphraser
Economics
11
Figure 1: Stock Price
(Yahoo Finance, 2018)
Lastly, some macro economical factors of the company have also been evaluated which
has impacted on the performance of the company. FT (2018) briefs the company has dropped
the sales of 100 brands so that it could focus on the 65 brands which generate 95% revenue of
the company. Further, the industry explains about various positive changes which have
impacted on the financial performance and the position of the company.
Conclusion and recommendation:
The research paper explains that the financial performance and the position of P&G
are quite better. Though, few negative changes have occurred into the financial performance
and position of P&G in last 5 years. But the average position of the company has been better.
It is suggested to the financial manager of the company to manage the liquidity position and
the optimal capital structure. Rest, all the financial strategies of the company is quite
competitive and briefs that the financial performance of the company is quite attractive and
the company is a good option for the investors to invest in the company for long term.
. Company has dropped the sales of 100 brands so that it could focus on the 65 brands which
generate 95% revenue of the company
Economics
12
References:
Annual report. (2018). Procter and Gamble. [Online]. Retrieved as on 13th April 2018 from
https://us.pg.com/annualreport2017/annual-report.html#/
Bloomberg. (2018). Rates and Bonds. [Online]. Retrieved as on 13th April 2018 from:
https://www.bloomberg.com/markets/rates-bonds/government-bonds/us
Bruce-Twum, E., & Mensah, C. C. (2015). Financial Statement Analysis. John Wiley &
Sons, Inc, New York.
Copeland, T. (1996). Valuation: Measurement and managing the value of companies: Second
edition. John Wiley & Sons, Inc, New York.
Entwistle, G. (2015). Reflections on teaching financial statement analysis. Accounting
Education, 24(6), 555-558.
Financial Times. (2018). Procter and Gamble. [Online]. Retrieved as on 13th April 2018 from
https://www.ft.com/content/1b802fa2-0797-11e8-9650-9c0ad2d7c5b5
Financial times. (2018). Procter and Gamble. [Online]. Retrieved as on 13th April 2018 from
https://www.ft.com/content/dff37c2c-1970-11e4-9745-00144feabdc0
Fridson, M. S. (1996). Financial statement analysis: Second edition. John Wiley & Sons, Inc,
New York.
Home. (2018). Procter and Gamble. [Online]. Retrieved as on 13th April 2018 from
https://us.pg.com/
Morningstar. (2018). Procter and Gamble. [Online]. Retrieved as on 13th April 2018 from
http://www.morningstar.com/stocks/xnys/pg/quote.html
Morningstar. (2018). Procter and Gamble. [Online]. Retrieved as on 13th April 2018 from
http://financials.morningstar.com/income-statement/is.html?t=0P000004GV&culture=en-
US&platform=sal
Reuters. (2014). P&G to sell up to 100 brands to revive sales, cut costs. [Online]. Retrieved
as on 13th April 2018 from https://www.reuters.com/article/us-procter-gamble-results/pg-to-
sell-up-to-100-brands-to-revive-sales-cut-costs-idUSKBN0G13WX20140804
Wahlen, J., Baginski, S., & Bradshaw, M. (2014). Financial reporting, financial statement
analysis and valuation. Nelson Education.
⊘ This is a preview!⊘
Do you want full access?
Subscribe today to unlock all pages.
Trusted by 1+ million students worldwide
1 out of 27
Related Documents


Your All-in-One AI-Powered Toolkit for Academic Success.
+13062052269
info@desklib.com
Available 24*7 on WhatsApp / Email
![[object Object]](/_next/static/media/star-bottom.7253800d.svg)
Unlock your academic potential
Copyright © 2020–2026 A2Z Services. All Rights Reserved. Developed and managed by ZUCOL.