An Investigation on Production Cost and Ford's Profitability: Report
VerifiedAdded on 2020/03/23
|19
|4946
|172
Report
AI Summary
This report investigates the impact of production costs on the profitability of Ford Motor Company. The study examines the background of Ford, identifies the research problem of declining profitability due to high production costs, and outlines the rationale for the research. It sets the aim to assess this impact and includes objectives to understand production cost and profitability concepts, evaluate factors affecting automotive industry profitability, and analyze the impact on Ford. The literature review covers production cost definitions, factors influencing profitability (including supply chain, demand uncertainty, corporate social responsibility, and product recovery), and the impact of production costs on profitability. The research methodology includes a quantitative approach using a deductive approach and positivism philosophy. The research design is descriptive, with data collection from secondary sources and data analysis using statistical methods. The findings, presented in tables and figures, reveal correlations and regression outputs between production costs, sales, and profitability. The report concludes with a discussion of findings, recommendations for cost reduction, future research scope, limitations, and references.

Professional Project
Paraphrase This Document
Need a fresh take? Get an instant paraphrase of this document with our AI Paraphraser
Table of Contents
Introduction................................................................................................................................1
Project Title................................................................................................................................1
Background and Research problem...........................................................................................1
Background.............................................................................................................................1
Research problem...................................................................................................................1
Rationale of the study.............................................................................................................2
Project Aim and Objectives.......................................................................................................2
Literature Review.......................................................................................................................2
Understanding the concept of production cost and profitability............................................2
Evaluating the factors affect the profitability of automotive industry...................................3
Analyzing the impact of production cost and profitability of Ford........................................4
Research Methodology...............................................................................................................4
Type of investigation..............................................................................................................4
Research approach..................................................................................................................5
Research philosophy...............................................................................................................5
Research design......................................................................................................................5
Data collection........................................................................................................................6
Data analysis...........................................................................................................................6
Findings from the secondary data analysis................................................................................6
Discussion................................................................................................................................12
Discussion of findings..........................................................................................................12
Recommendation..................................................................................................................12
Future scope of the research.................................................................................................12
Limitations............................................................................................................................12
Conclusion................................................................................................................................13
References................................................................................................................................14
List of tables
Table 1: Cost and profit..............................................................................................................7
Table 2: Descriptive of profitability and cost of production......................................................7
Table 3: Correlation between cost of production and profitability............................................8
Table 4: Regression output.........................................................................................................8
Table 5: Anova...........................................................................................................................8
Table 6: Cost and sales...............................................................................................................9
Table 8: Descriptive of cost of production and sales...............................................................10
Table 9: Correlation between cost of production and sales.....................................................10
Table 10: Regression between cost of production and sales....................................................11
List of figures
Figure 1: Cost and profitability..................................................................................................7
Figure 2: Cost and sales...........................................................................................................10
⊘ This is a preview!⊘
Do you want full access?
Subscribe today to unlock all pages.
Trusted by 1+ million students worldwide
INTRODUCTION
The automotive industry covers a wide range of organizations and companies which
involve designing, development, manufacturing, marketing and selling of motor vehicles. It is
considered as one of the world’s most important sector of the economy by revenue (Friedrich
& Schumann, 2001). However, it does not include automobile repair, filling stations and
delivery of products to end-users. It basically deals with the designing and development
phase of the motor vehicles.
PROJECT TITLE
An investigation on assessing the impact of the production cost on the profitability of car
manufacturing companies-A case study of Ford.
BACKGROUND AND RESEARCH PROBLEM
Background
The present study is based on the Ford Motor Company which is an American
multinational automaker which offers several kinds of commercial vehicles and automobiles.
The organization is operating across the world with joint venture strategies and serving
millions of customers. Ford is listed on New York Stock Exchange. Jaguar and Land Rover
were the UK subsidiaries of the Ford which were sold in 2008 to Tata Motor. In the current
financial year's company adopted a strategy to cut its global workforce for the purpose of
addressing the issue related to declining share price. However, the higher production cost is
the major issue which affects the overall rate of return of the business and other related
activities (Sturgeon, Van Biesebroeck & Gereffi, 2008). The profitability of business relies
on the cost associated with the production procedure. This indicates the lower profitability is
the major issue which is being faced in the Ford.
Research problem
The major problem associated with the research project is the lower profitability of
the business which has a direct impact on the growth and development. Every business
generally suffers from lower profitability due to the increased cost of production. This tends
to threaten the competitive edge of the business and accordingly, all related stakeholders
cannot get the benefit out of the same (Cavalieri, Maccarrone and Pinto, 2004). For this
purpose, present research aims to assess the impact of production cost on the profitability of
the business. This would be effective to carry out the in-depth analysis and work upon the
1
Paraphrase This Document
Need a fresh take? Get an instant paraphrase of this document with our AI Paraphraser
issues which are being faced by the Ford. It leads to create a competitive edge and retain
customers for longer time span.
Rationale of the study
The study under consideration is based on production cost and profitability of the
business. However, the profitability is the main purpose of all businesses and all activities are
dedicated to it. For an automotive sector, it is crucial to have proper control over direct and
indirect expenses otherwise operating cost will be increased and negative impact of the same
will be seen on entire performance (Hill & et. al., 2006). In case of business does not focus on
the cost aspect then continuous increase in the cost ruin the overall performance. For this
purpose, the current study is being conducted to assess the impact of the cost of production
on profitability so as to take corrective action in case of requirement. This facilitates to create
the competitive edge of the business in the marketplace because appropriate strategy will be
implemented to reduce the indirect cost and raise overall rate of return.
PROJECT AIM AND OBJECTIVES
Aim
To assess the impact of the production cost on profitability of the car manufacturing
companies-A case study of Ford
Objectives
The objectives of the current research project are stated as follows which are framed in
accordance with the research aim. In this regard, overall research aim has been broken down
into small portion to make the objectives-
To understand the concept of production cost and profitability
To evaluate factors affect the profitability of automotive industry
To analyse the impact of production cost and profitability of Ford
To suggest different ways for decreasing cost of production and increasing
profitability of the business
LITERATURE REVIEW
Understanding the concept of production cost and profitability
Shepherd (2015, p.3-12) stated that production cost consists of all direct cost such as
labour, material and other stuff actively contribute towards producing the product. Further, in
2
economic theory production function is considered as the mathematical statement which
indicates the technological relationship between the input and output process. At this
juncture, necessary inputs or aspects which are applied in the production procedure are
considered as the factor production. This shows that cost of production varies as per the
factor of the production and its volume. For example, if Ford plans to manufacture 100 cars
in the month and 200 cars in the second month then the cost in both cases will be different.
On the other hand, Salonen and Deleryd, (2011, p.63) carried out a study on Cost of
Poor Maintenance (CoPM) where he stated that manufacturing system must look over the
CoPM concept. It facilitates to identify the deficiency and performance of the corporation
over a given time span. It enables companies to plan their other production related activities
in the right manner. Apart from this, Ramcharran (2001) explained that profitability plays a
crucial role and serves as the motivating factor in the entire automotive sector. The rate of
return of reduced with the continuous increase in the cost of production. Owing to this, it is
important for the business to reduce the cost of the production by applying suitable strategies.
Evaluating the factors affect the profitability of automotive industry
Ramcharran (2001, p.11) asserted that profitability and auto parts suppliers have
positive or significant linkage. This is because in case the firm is applying suitable and
effective supply chain management strategy leads to growth and development of the business.
However, Ceschin and Vezzoli (2010) argued that uncertainty related to the demand is the
crucial threat for the auto parts suppliers which reduce the income of automotive industry.
For this purpose, effective management of information facilitates to apply the profit-
maximizing strategy. This proves to be effective in creating the competitive edge of the
business.
Heath & Norman (2004) delineated that profitability of the business is affected from
the corporate social responsibility also as it provides long-term benefits. This influences
corporation to incur the cost for the short term but the long-term benefits are provided to the
firm. At the same time, effective corporate governance is important to which appropriate
accounting policies comply for the purpose of increasing overall benefits and serving all
related stakeholders in an effectual manner. In the similar fashion, Seitz (2007) reflected that
product recovery operations such as remanufacturing affect the profitability of the business to
a great extent. At this juncture, closed-loop supply chain management facilitates to cater the
requirement of the business whereby recycling and re-use are made possible.
3
⊘ This is a preview!⊘
Do you want full access?
Subscribe today to unlock all pages.
Trusted by 1+ million students worldwide
Analyzing the impact of production cost and profitability of Ford
Blocher, Chen and Lin (2002) explained that cost of production has a direct impact on
the profitability of the business because as the proportion of expense increases the volume of
profitability goes down. For this purpose, management of the business ensures to promote
employees so they can put their extensive efforts for maintaining better performance in the
marketplace. This enables the corporation to ensure that employees are retained and they
better contribute towards the growth and success of the business (Blocher, Chen & Lin,
2002).
Hill and et. al., (2006) explained that profitability of the business goes down with the
low volume of production. It is because generally fixed cost decreases the rate of return.
Owing to this, companies or automotive industry should focus on increasing volume of
production to gain the advantage of huge fixed cost. Yet, the variable cost will significantly
increase the volume of production. Therefore, the automotive sector should carry out the
research to assess the demand for products and services in the marketplace and in the same
way production can be planned. This proves to be effective in utilizing limited resources in an
effectual manner. In addition to this, Cavalieri, Maccarrone & Pinto (2004) strategic cost
management is beneficial for the return of the company. This is because management decides
in advance that how the cost will be reduced and long-term advantages will be derived. For
example, manpower is replaced with the technological innovation at many places that give
rise to short-term cost but leads to the long-term profitability of the business (Seitz, 2007).
RESEARCH METHODOLOGY
The research methodology is the most important aspect of the research which assists
the researcher to conduct the in-depth analysis and helps scholar to reach the solution of the
study (Neuman, 2002). It consists of type of investigation, research approach, data collection
methods and data analysis approach which are explained as follows-
Type of investigation
There are two types of research investigation such as qualitative and quantitative. The
first aspect is qualitative one which assists scholar in conducting the in-depth analysis out of
the collected information (Creswell, 2002). This derives the deep insight about the topic
under consideration. On the other hand, quantitative research is useful where scholar seeks to
assess the impact of one variable on another. The current study is based on assessing the
impact of production cost on the profitability of the Ford. Owing to this, application of
4
Paraphrase This Document
Need a fresh take? Get an instant paraphrase of this document with our AI Paraphraser
quantitative approach is more suitable to accomplish the aim. This would be effective to
apply the statistical method in the analysis of the collected information.
Research approach
There are two types of research approaches deductive and inductive where the
application of the suitable method is based on the nature or requirement of the study. The
deductive approach starts by observing the general information and reaching to the specific
outcome. On the other hand, inductive approach begins with the specific information and
accordingly researcher moves to general information (Creswell, 2013). Owing to this, present
study applies deductive research approach in which normal causes behind the reduced
profitability are assessed and in the same manner, the impact of the cost of production can be
assessed on the profitability of the Ford (Creswell & Clark, 2007). It would be effective to
reach the specific research issue. Therefore, selection of deductive research approach is
justifiable.
Research philosophy
There are two types of research philosophies positivism and interpretivism. The
interpretivism research philosophy allows the scholar to apply own knowledge and insight in
completing entire study. Generally, interpretivism research philosophy is applied under the
qualitative type of investigation whereas positivism research philosophy is useful for the
quantitative type of investigation (Bernard, 2011). Owing to this, positivism research
philosophy has been applied in the current research whereby scholar can analyse the collected
information on the basis of derived outcome. However, interpretivism philosophy cannot be
applied as it allows the scholar to perceive or interpret the information from the socially
constructed environment (Mertens, 2014). Therefore, selection of positivism research
philosophy can be justified in the right manner.
Research design
There are different research designs such as exploratory, explanatory and descriptive.
The descriptive research design is applied where the researcher considers the population
selected for the study (Cavana, Delahaye & Sekaran, 2001). For this purpose, characteristic
of a population which is being studied is explained. On the other hand, exploratory research
is used to explore something new whereas explanatory research provides the cause and effect
relationship by defining the problem in a more precise manner. However, the study under
consideration is based secondary data only. Therefore, application of explanatory research
5
philosophy is suitable as the impact of the cost of production is being assessed on the
profitability of the business. Therefore, selected research design can be justified.
Data collection
Data collection is the procedure of collecting the primary and secondary for the
purpose of meeting the specific research purpose. The present study is based on the
secondary data only, owing to this primary data have not been collected (De Vaus & de Vaus,
2001). However, there are different methods used for the collection of both primary and
secondary data. For example, questionnaire, interview and observation methods are applied
for the collection of primary data. On the other hand, secondary data are collected from the
sources such as journals, books and online articles (Ritchie, 2003). Therefore, journals, books
and online articles such as the annual report of Ford are used for the collection of secondary
data which would be effective in assessing the impact of production cost on the profitability
of the business.
Data analysis
There are two methods used for the data analysis procedure such as qualitative and
quantitative. The qualitative method consists of thematic analysis in which themes are
constructed and that is supported with the help of detailed analysis. On the other hand, the
quantitative technique is based on the statistical measures such as regression, correlation and
descriptive analysis (Pausas & Lavorel, 2003). It assists the researcher in understanding the
impact of one variable on another so as to accomplish the research aim and objectives. In this
regard, the current study applied such kind of aspects correlation and descriptive to carry out
in-depth analysis from the collected information. It helps in meeting aim and objectives of the
research in the right manner (Holsapple & Joshi, 2002). Thus, the qualitative method cannot
be applied as it will not help in assessing the impact of production cost on the profitability of
Ford.
FINDINGS FROM THE SECONDARY DATA ANALYSIS
In order to carry out detail analysis, financials of Ford are referred to collect
information about the profitability, cost of production and sales revenue generated in the last
10 financial years. At this juncture, cost of production and profitability for ten years are
analysed by using descriptive, regression and correlation method. The below-mentioned
graph is showing profitability and cost of production from the financial year 2007 to 2016.
6
⊘ This is a preview!⊘
Do you want full access?
Subscribe today to unlock all pages.
Trusted by 1+ million students worldwide
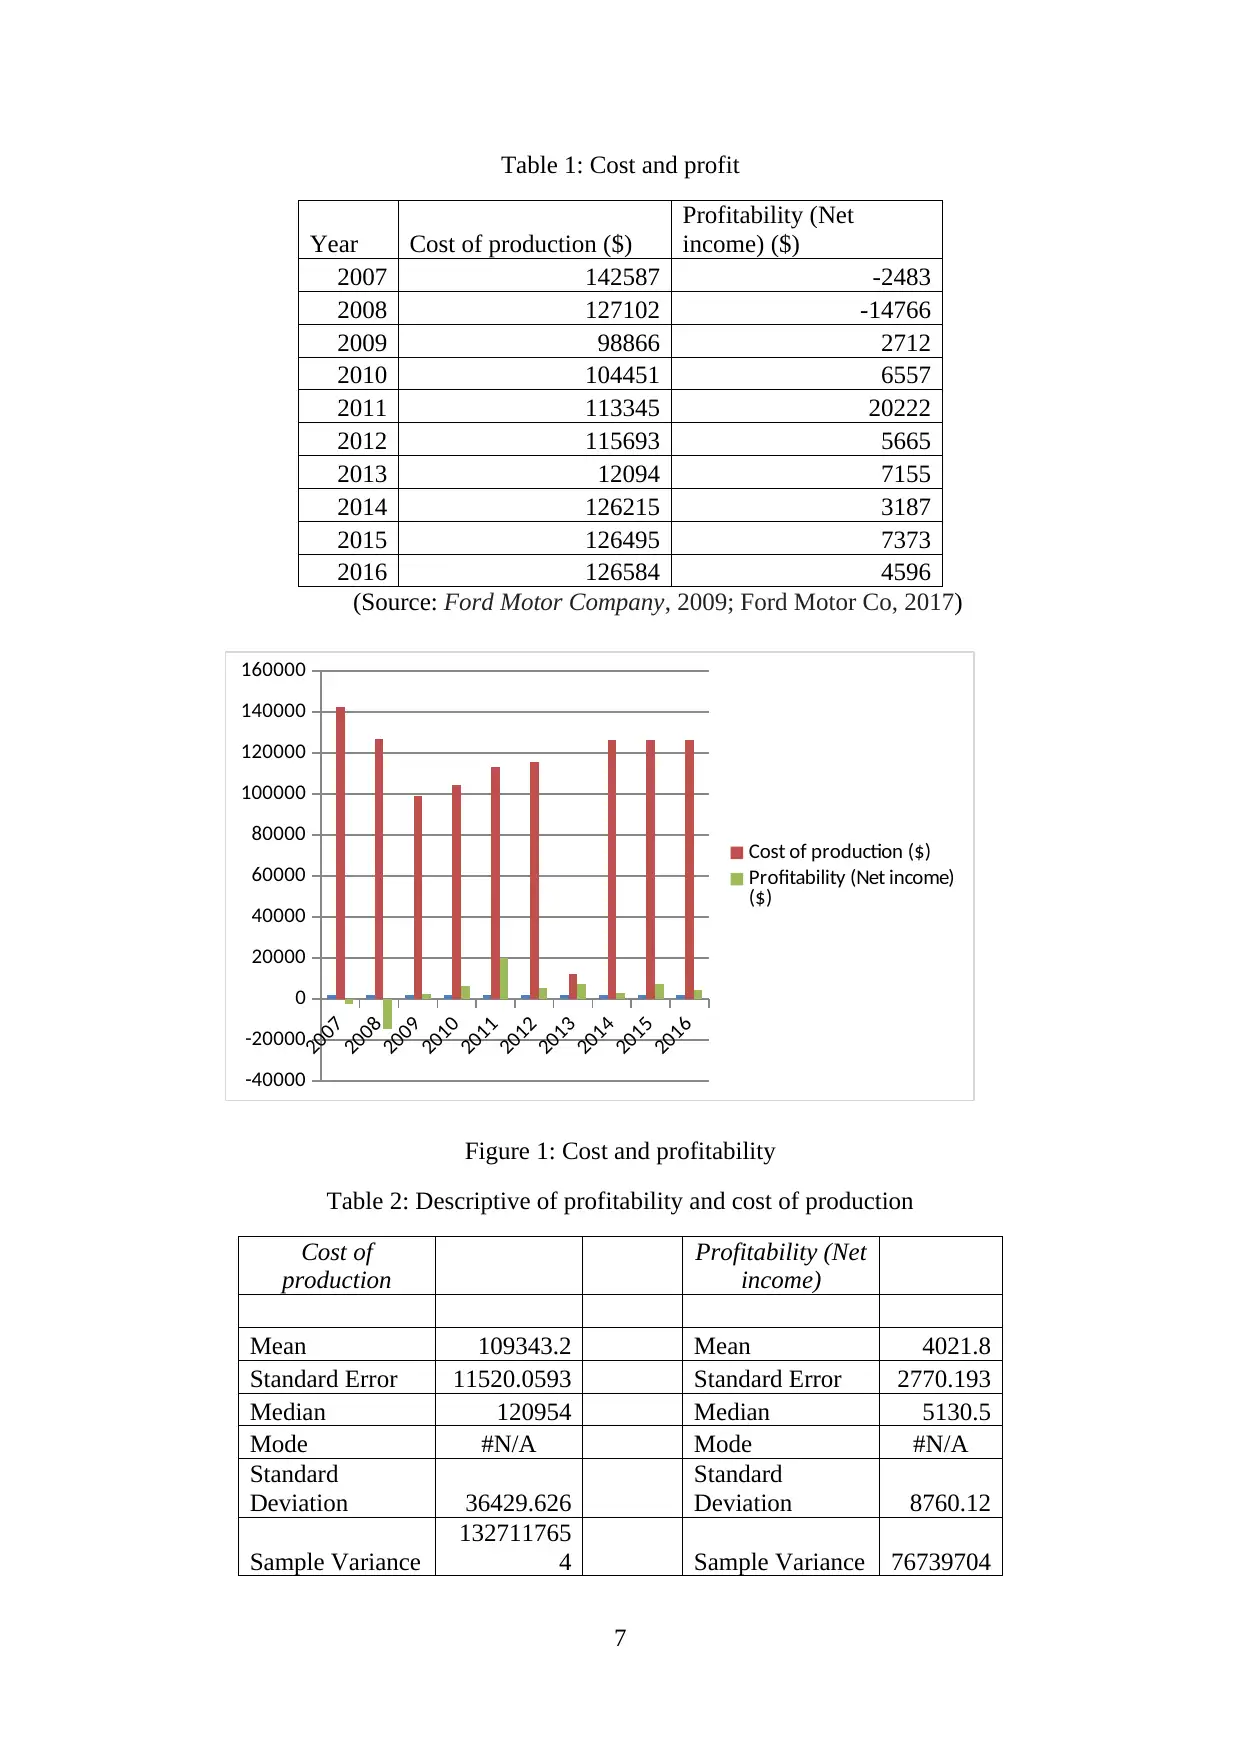
Table 1: Cost and profit
Year Cost of production ($)
Profitability (Net
income) ($)
2007 142587 -2483
2008 127102 -14766
2009 98866 2712
2010 104451 6557
2011 113345 20222
2012 115693 5665
2013 12094 7155
2014 126215 3187
2015 126495 7373
2016 126584 4596
(Source: Ford Motor Company, 2009; Ford Motor Co, 2017)
2007
2008
2009
2010
2011
2012
2013
2014
2015
2016
-40000
-20000
0
20000
40000
60000
80000
100000
120000
140000
160000
Cost of production ($)
Profitability (Net income)
($)
Figure 1: Cost and profitability
Table 2: Descriptive of profitability and cost of production
Cost of
production
Profitability (Net
income)
Mean 109343.2 Mean 4021.8
Standard Error 11520.0593 Standard Error 2770.193
Median 120954 Median 5130.5
Mode #N/A Mode #N/A
Standard
Deviation 36429.626
Standard
Deviation 8760.12
Sample Variance
132711765
4 Sample Variance 76739704
7
Paraphrase This Document
Need a fresh take? Get an instant paraphrase of this document with our AI Paraphraser
Kurtosis 6.94167161 Kurtosis 2.907666
Skewness -2.4802463 Skewness -0.53072
Range 130493 Range 34988
Minimum 12094 Minimum -14766
Maximum 142587 Maximum 20222
Sum 1093432 Sum 40218
Count 10 Count 10
The above-mentioned table shows that average cost of production for 10 years is
109343 whereas average profitability for the same time was 4021. Further, the standard
deviation for the cost of production is 36429 but for profitability, it is 8760. It indicates that
both variables have significant variation and they little less correlated to each other.
Table 3: Correlation between cost of production and profitability
Cost of
production
Profitability (Net
income)
Cost of production 1
Profitability (Net
income) -0.252325083 1
Table 4: Regression output
Regression
Statistics
Multiple R 0.184460137
R Square 0.034025542
Adjusted R
Square -0.103970809
Standard Error 9424.460653
Observations 9
Table 5: Anova
df SS MS F Significance F
Regressio
n 1 21900319.99 21900319.99 0.246568418 0.63471349
Residual 7 621743210.2 88820458.61
Total 8 643643530.2
Coeffici
ents
Standard
Error t Stat P-value
Lower
95%
Upper
95%
Lower
95.0%
Upper
95.0%
Inter
cept
9520.65
963
10118.47
348
0.94091
8573
0.37807
4237
-
14405.
33447.0
4741
-14406 33447
8
728
1425
87
-
0.04520
7091
0.091041
172
-
0.49655
6561
0.63471
3486
-
0.2604
853
0.17007
1072 -0.2605 0.17007
With the analysis of correlation table, it has been found that cost of production and
profitability of the business are negatively correlated. This shows that in case cost of
production is increased that profitability will go down. It reflects the consistency of collected
information. Furthermore, a value of R square 0.03402 variations of the cost of production is
explained by profitability. Moreover, regression analysis reflects that 0.63 or 63% variation is
brought into the profitability. In addition to this, .37 regression coefficient indicates that there
is only 37% chance that result occurred only in chance or outcome of the chance. Therefore,
it can be said that cost of production has the negative correlation with the profitability.
Table 6: Cost and sales
Year Cost of production ($)
Sales
($)
2007 142587 154379
2008 127102 129165
2009 98866 105893
2010 104451 119280
2011 113345 128168
2012 115693 134252
2013 12094 146917
2014 126215 144077
2015 126495 149558
2016 126584 151800
9
⊘ This is a preview!⊘
Do you want full access?
Subscribe today to unlock all pages.
Trusted by 1+ million students worldwide
1 out of 19
Related Documents


Your All-in-One AI-Powered Toolkit for Academic Success.
+13062052269
info@desklib.com
Available 24*7 on WhatsApp / Email
![[object Object]](/_next/static/media/star-bottom.7253800d.svg)
Unlock your academic potential
Copyright © 2020–2026 A2Z Services. All Rights Reserved. Developed and managed by ZUCOL.