Production Cost Reduction and Its Impact on Market Price Analysis
VerifiedAdded on 2023/03/30
|18
|3375
|440
Report
AI Summary
This report investigates the impact of reducing the production price of a product on its market price, focusing on bread and sweet potatoes as examples. Data is collected and analyzed to understand how changes in production costs affect demand, profits, and the market dynamics of both superior and inferior goods. The methodology involves both secondary and primary data collection, with statistical analysis including descriptive statistics, bivariate correlation, and regression analysis. Findings reveal the relationships between production costs, revenue, and profit, providing insights into the responsive nature of the market to price changes and the implications for production management strategies. The analysis aims to address research questions related to demand elasticity and the classification of goods based on consumer behavior.
Running Head: Professional Report
Professional Report
Name of Student
Name of Class
School
Date
Professional Report
Name of Student
Name of Class
School
Date
Paraphrase This Document
Need a fresh take? Get an instant paraphrase of this document with our AI Paraphraser
Professional
Table of Contents
Executive Summary.....................................................................................................................................3
Introduction.................................................................................................................................................3
Problem Statement.................................................................................................................................4
Research Aim and Research Questions...................................................................................................5
Literature Review........................................................................................................................................5
Methodology...............................................................................................................................................6
Data Collection........................................................................................................................................6
Data Analysis...........................................................................................................................................8
Findings.......................................................................................................................................................9
Descriptive Statistics................................................................................................................................9
Bivariate Correlation..............................................................................................................................10
Regression Analysis...............................................................................................................................12
Discussion..................................................................................................................................................14
Conclusion.................................................................................................................................................15
References.................................................................................................................................................16
Professional
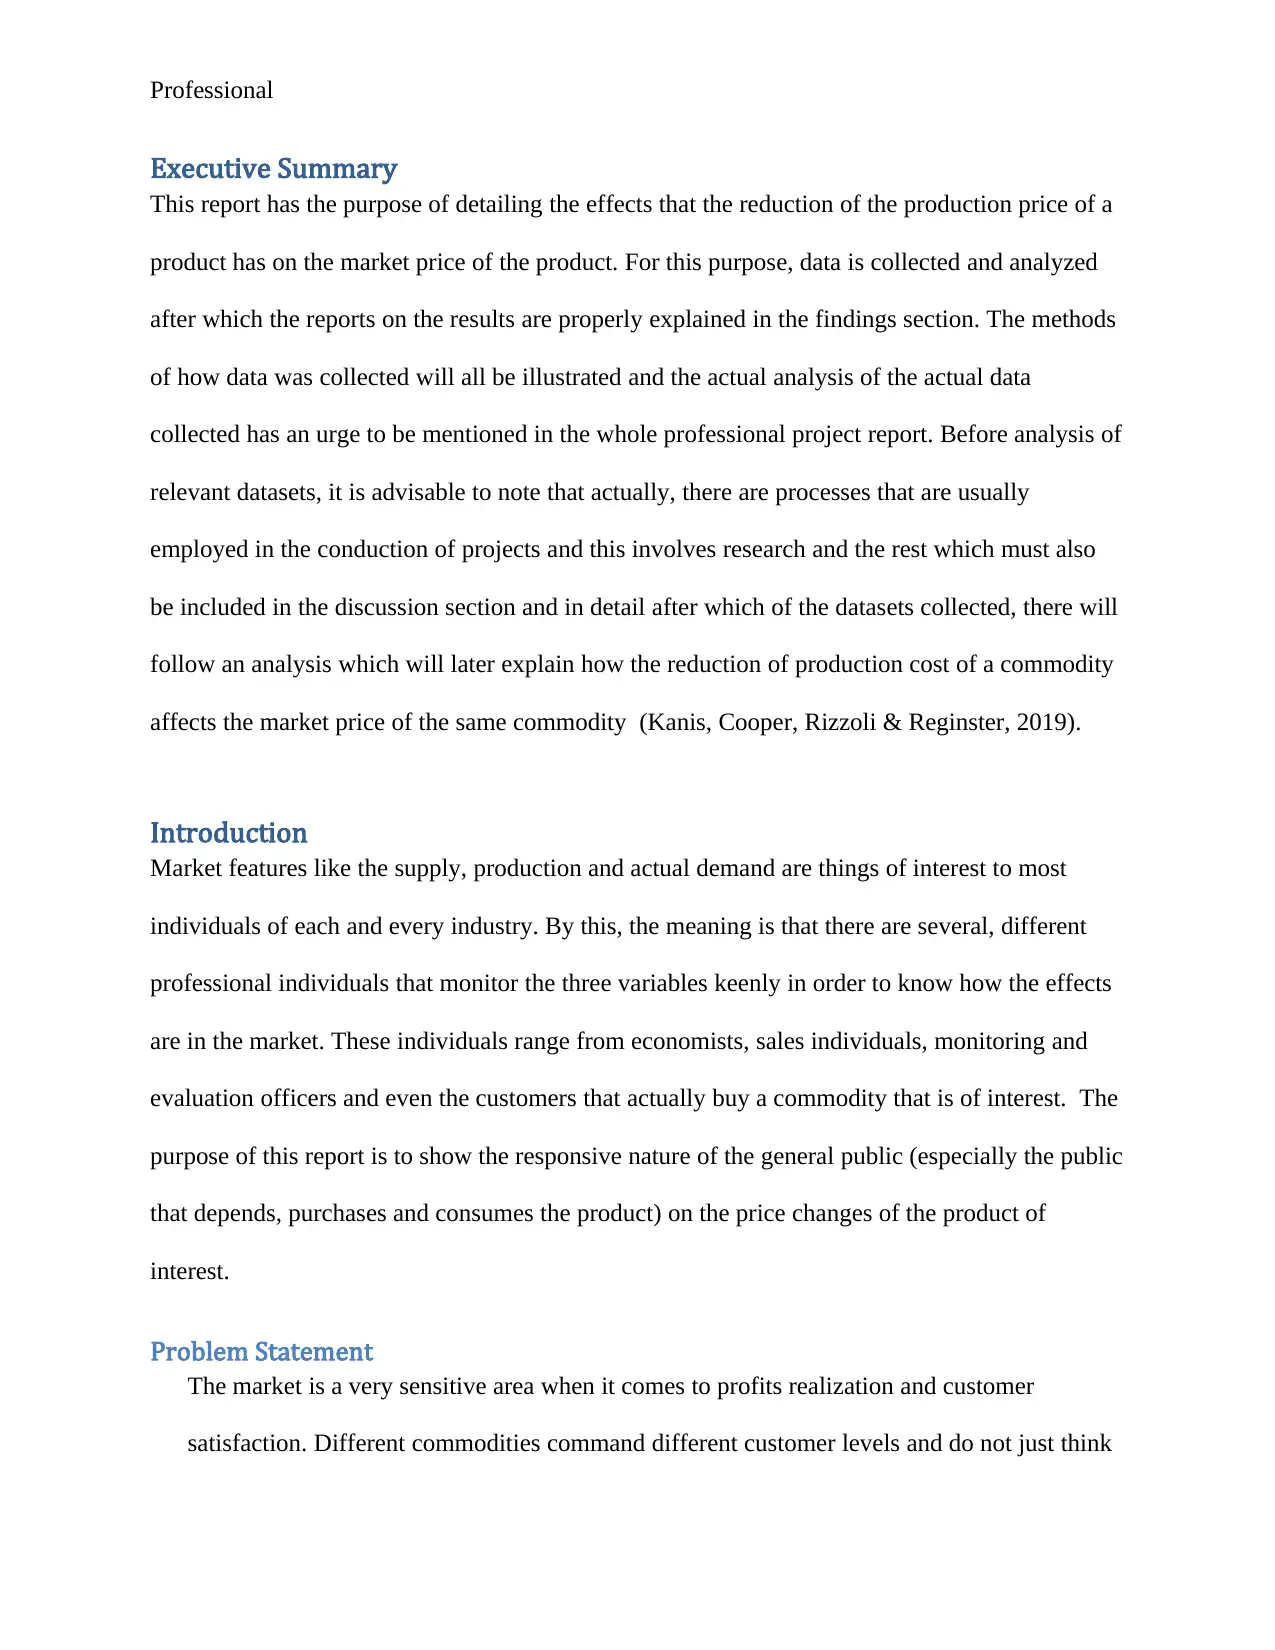
Executive Summary
This report has the purpose of detailing the effects that the reduction of the production price of a
product has on the market price of the product. For this purpose, data is collected and analyzed
after which the reports on the results are properly explained in the findings section. The methods
of how data was collected will all be illustrated and the actual analysis of the actual data
collected has an urge to be mentioned in the whole professional project report. Before analysis of
relevant datasets, it is advisable to note that actually, there are processes that are usually
employed in the conduction of projects and this involves research and the rest which must also
be included in the discussion section and in detail after which of the datasets collected, there will
follow an analysis which will later explain how the reduction of production cost of a commodity
affects the market price of the same commodity (Kanis, Cooper, Rizzoli & Reginster, 2019).
Introduction
Market features like the supply, production and actual demand are things of interest to most
individuals of each and every industry. By this, the meaning is that there are several, different
professional individuals that monitor the three variables keenly in order to know how the effects
are in the market. These individuals range from economists, sales individuals, monitoring and
evaluation officers and even the customers that actually buy a commodity that is of interest. The
purpose of this report is to show the responsive nature of the general public (especially the public
that depends, purchases and consumes the product) on the price changes of the product of
interest.
Problem Statement
The market is a very sensitive area when it comes to profits realization and customer
satisfaction. Different commodities command different customer levels and do not just think
⊘ This is a preview!⊘
Do you want full access?
Subscribe today to unlock all pages.
Trusted by 1+ million students worldwide
Professional
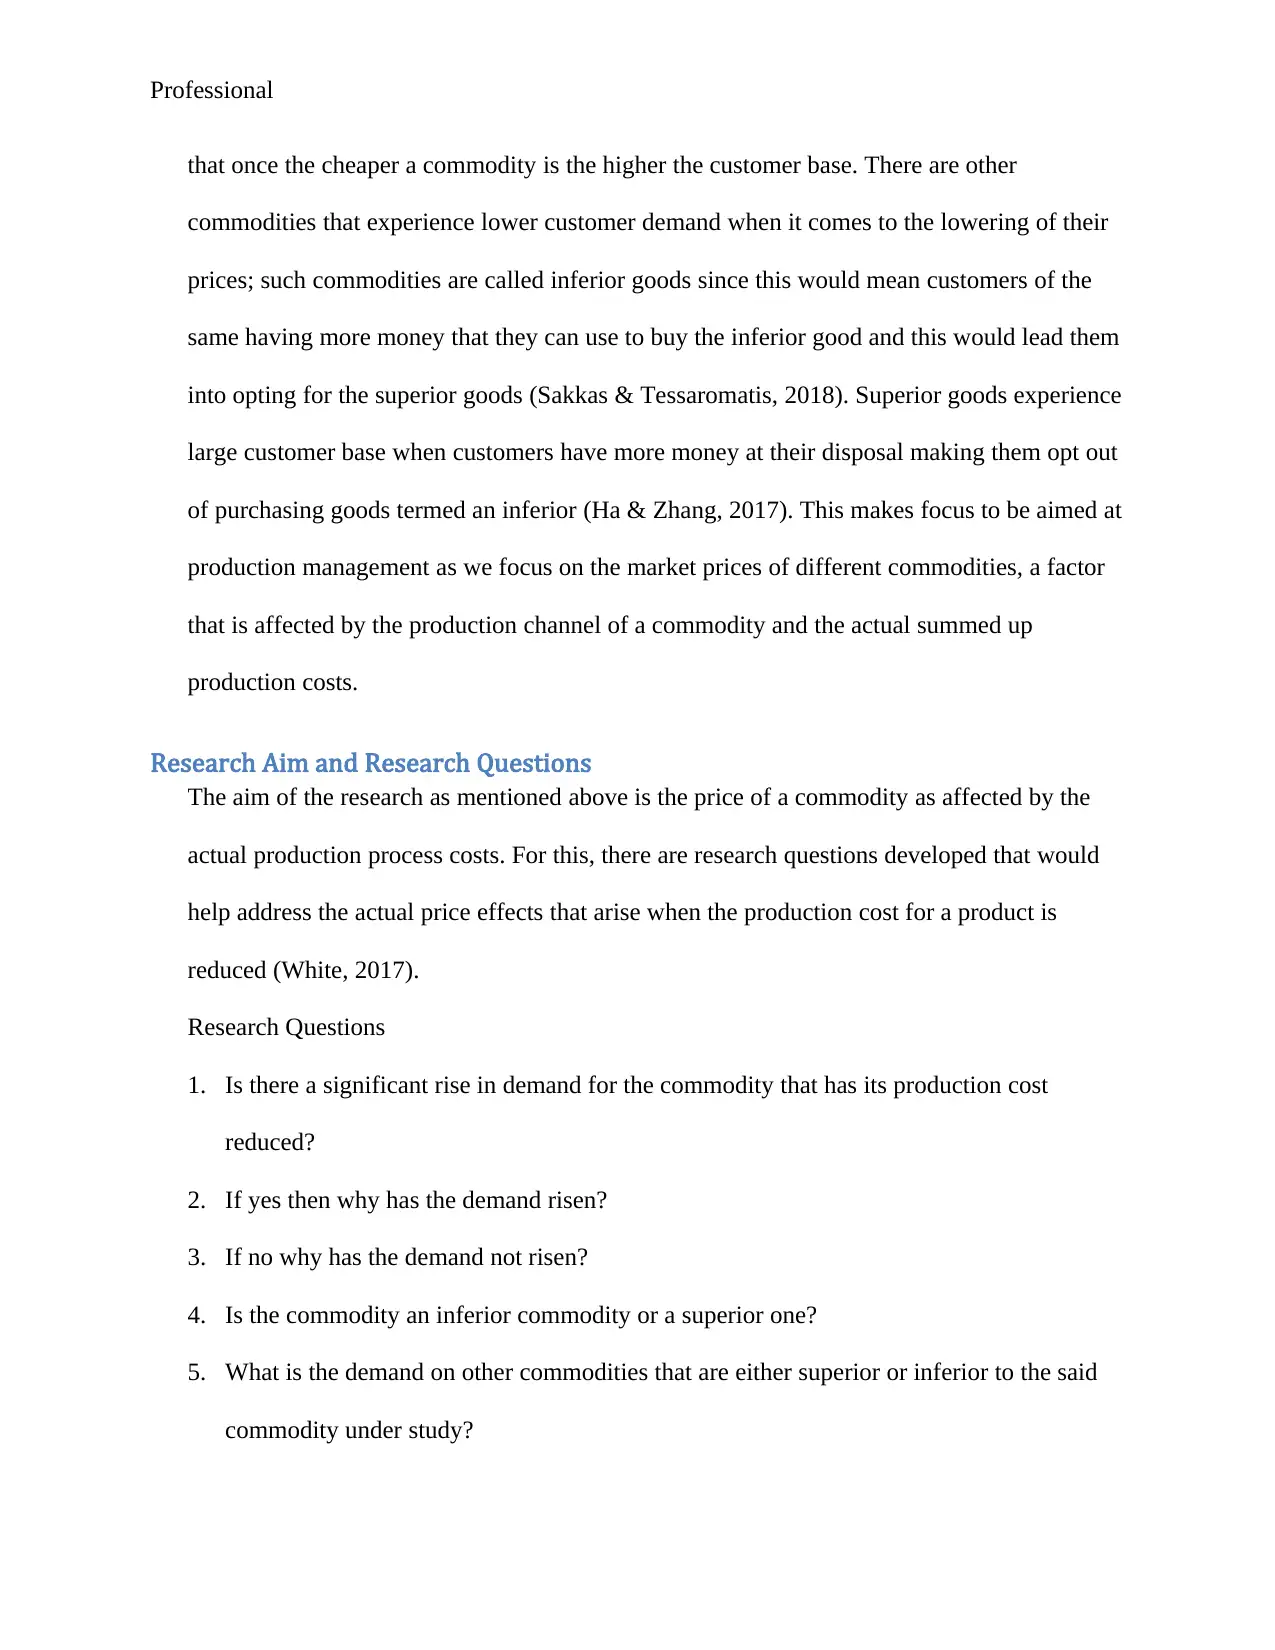
that once the cheaper a commodity is the higher the customer base. There are other
commodities that experience lower customer demand when it comes to the lowering of their
prices; such commodities are called inferior goods since this would mean customers of the
same having more money that they can use to buy the inferior good and this would lead them
into opting for the superior goods (Sakkas & Tessaromatis, 2018). Superior goods experience
large customer base when customers have more money at their disposal making them opt out
of purchasing goods termed an inferior (Ha & Zhang, 2017). This makes focus to be aimed at
production management as we focus on the market prices of different commodities, a factor
that is affected by the production channel of a commodity and the actual summed up
production costs.
Research Aim and Research Questions
The aim of the research as mentioned above is the price of a commodity as affected by the
actual production process costs. For this, there are research questions developed that would
help address the actual price effects that arise when the production cost for a product is
reduced (White, 2017).
Research Questions
1. Is there a significant rise in demand for the commodity that has its production cost
reduced?
2. If yes then why has the demand risen?
3. If no why has the demand not risen?
4. Is the commodity an inferior commodity or a superior one?
5. What is the demand on other commodities that are either superior or inferior to the said
commodity under study?
Paraphrase This Document
Need a fresh take? Get an instant paraphrase of this document with our AI Paraphraser
Professional
Literature Review
In the past times, lower costs of productions have always been a key determinant of lower costs
of products. Because there are several people who earn lower than those who earn higher and
that demand is measured in termed of a number of heads (suppose each head were to buy a single
unit of a product), when the price of a commodity is lowered, there would be high demand for
the same. This is always an advantage to the customers, as they will be able to spend lesser
amounts of money.
On the other hand the sole reason as to the operation management function of the production
process of a company, the reason for the reduction of the production cost is to help them
maximize on profits as they greatly minimize on costs and one such major cost is the production
process production costs (Higgins, 2017). Though in a bid to reduce costs that are involved in
production processes, lower quality products might be produced in the process and this alone
poses a threat on the sales volumes that the commodity producer should make. Therefore in,
whatever happens, there should be no reduction on a commodity’s quality, when reducing the
cost of producing the same commodity.
The commodity that we will be focusing on in our professional report is bread. This will be
looked at as a single commodity with a standard price for all the factories involved in the
business. The reason as to why the interest focus is on bread is because it is a basic commodity
and its demand is significantly identifiable among other commodities that are less basic ((Lusk &
Andre, 2017). The commodity that it will be analyzed or compared against is the sweet potato.
Both of them are basic commodities as they are both foods. But one is definitely superior to the
other and this is what makes it more interesting when doing a comparison of the two.
Professional
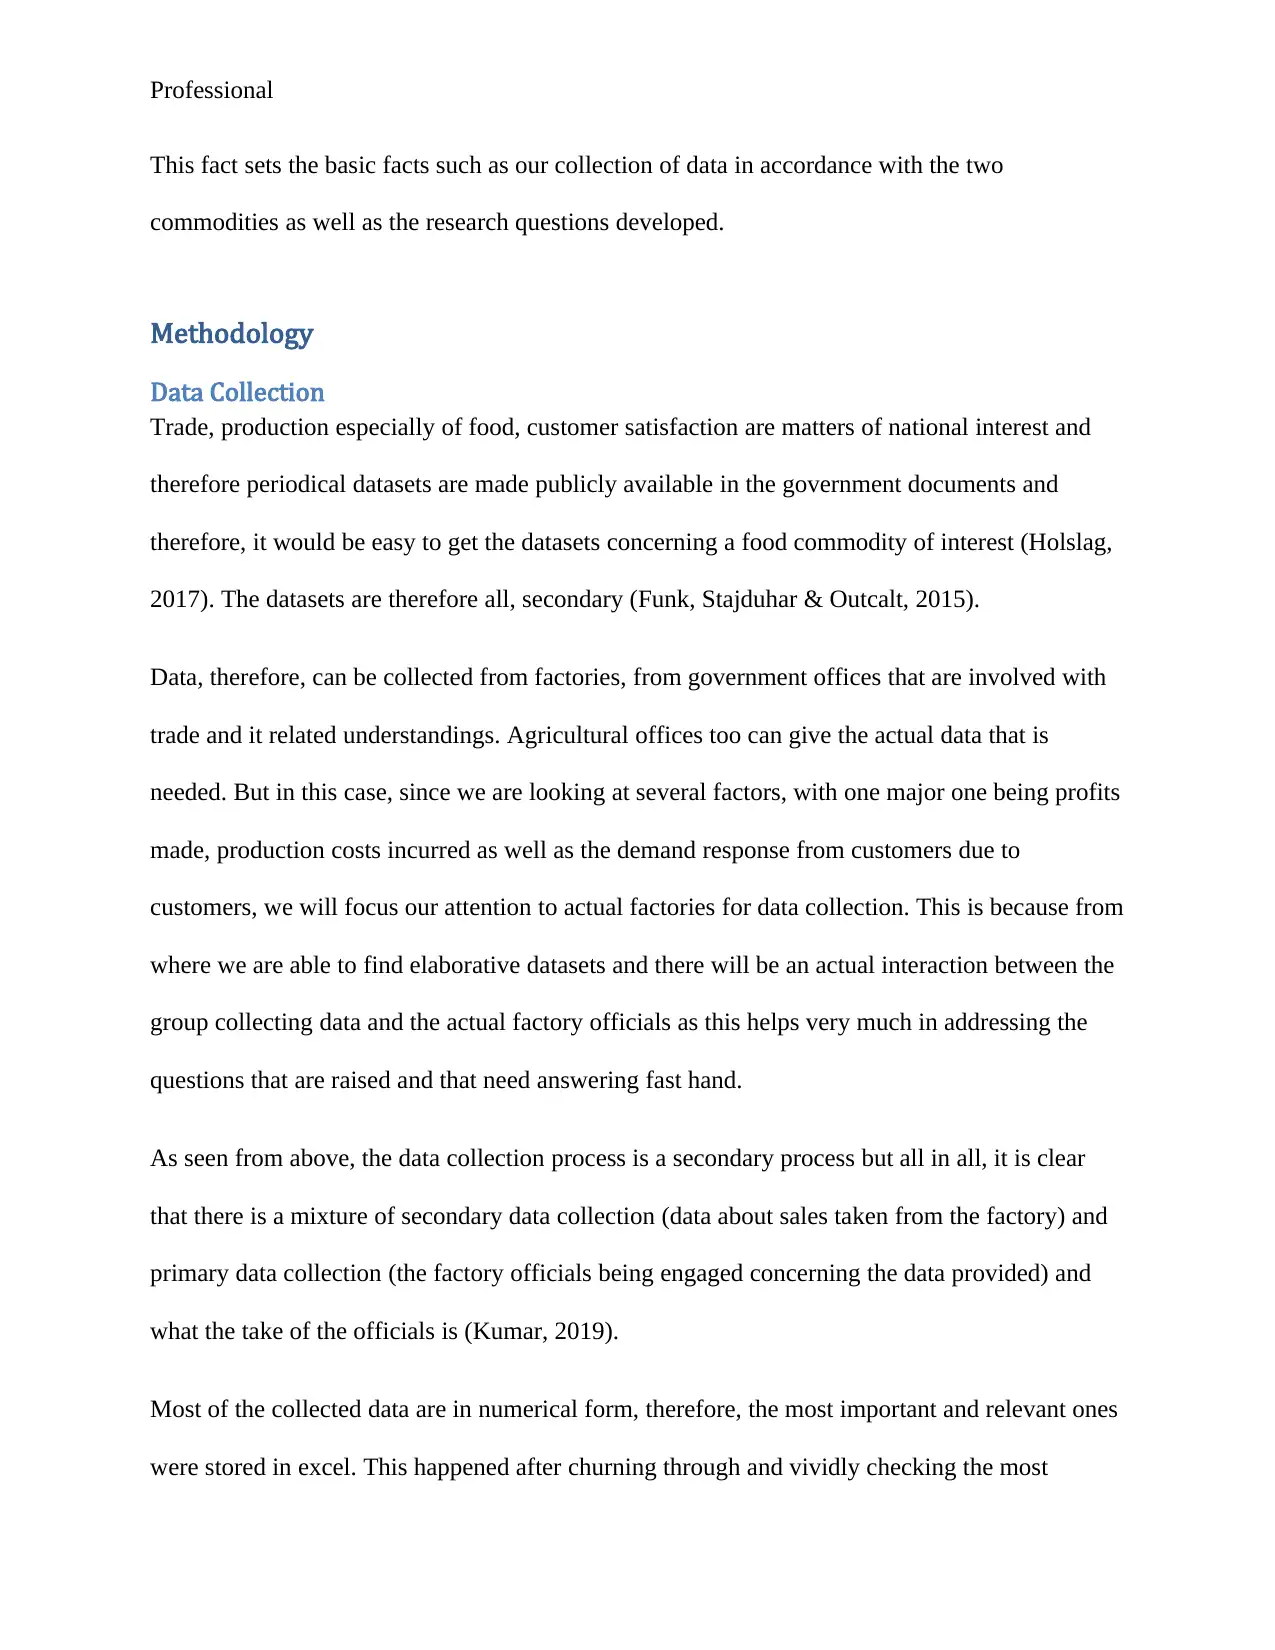
This fact sets the basic facts such as our collection of data in accordance with the two
commodities as well as the research questions developed.
Methodology
Data Collection
Trade, production especially of food, customer satisfaction are matters of national interest and
therefore periodical datasets are made publicly available in the government documents and
therefore, it would be easy to get the datasets concerning a food commodity of interest (Holslag,
2017). The datasets are therefore all, secondary (Funk, Stajduhar & Outcalt, 2015).
Data, therefore, can be collected from factories, from government offices that are involved with
trade and it related understandings. Agricultural offices too can give the actual data that is
needed. But in this case, since we are looking at several factors, with one major one being profits
made, production costs incurred as well as the demand response from customers due to
customers, we will focus our attention to actual factories for data collection. This is because from
where we are able to find elaborative datasets and there will be an actual interaction between the
group collecting data and the actual factory officials as this helps very much in addressing the
questions that are raised and that need answering fast hand.
As seen from above, the data collection process is a secondary process but all in all, it is clear
that there is a mixture of secondary data collection (data about sales taken from the factory) and
primary data collection (the factory officials being engaged concerning the data provided) and
what the take of the officials is (Kumar, 2019).
Most of the collected data are in numerical form, therefore, the most important and relevant ones
were stored in excel. This happened after churning through and vividly checking the most
⊘ This is a preview!⊘
Do you want full access?
Subscribe today to unlock all pages.
Trusted by 1+ million students worldwide
Professional
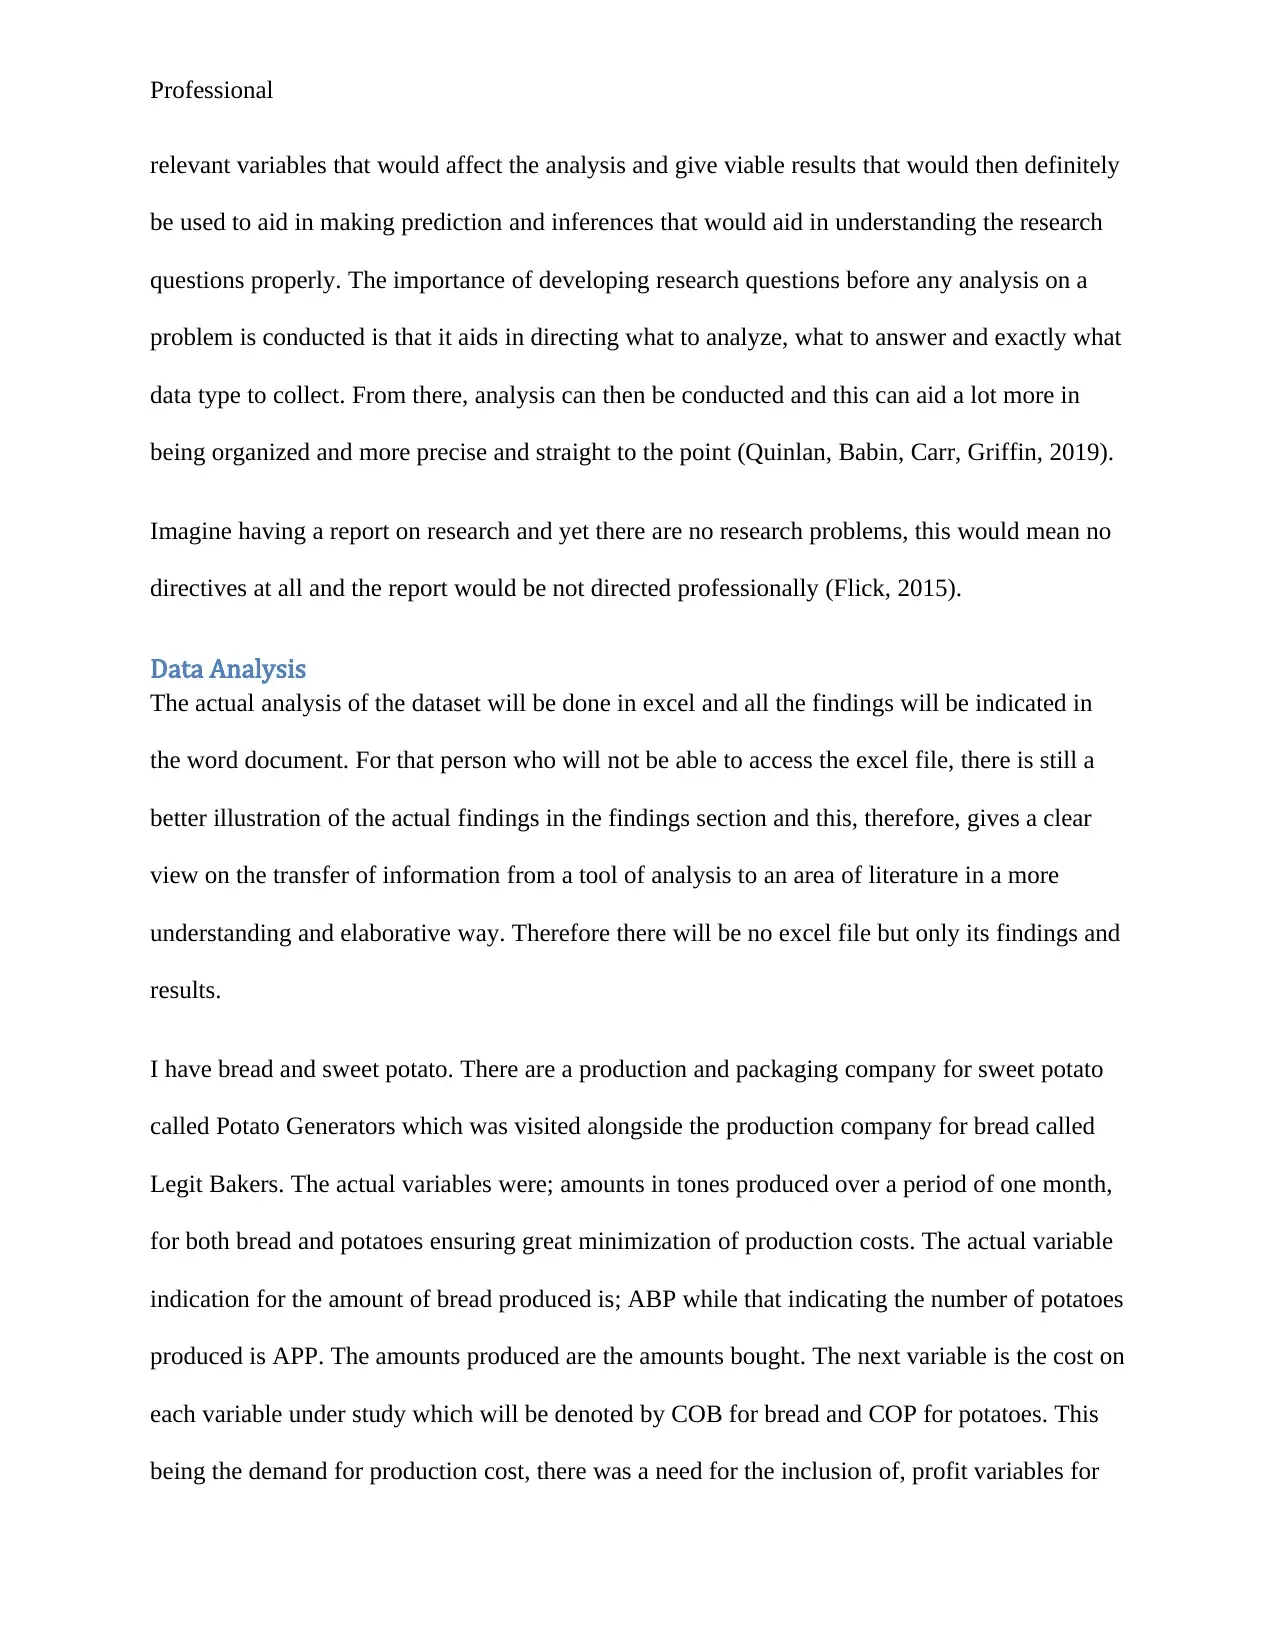
relevant variables that would affect the analysis and give viable results that would then definitely
be used to aid in making prediction and inferences that would aid in understanding the research
questions properly. The importance of developing research questions before any analysis on a
problem is conducted is that it aids in directing what to analyze, what to answer and exactly what
data type to collect. From there, analysis can then be conducted and this can aid a lot more in
being organized and more precise and straight to the point (Quinlan, Babin, Carr, Griffin, 2019).
Imagine having a report on research and yet there are no research problems, this would mean no
directives at all and the report would be not directed professionally (Flick, 2015).
Data Analysis
The actual analysis of the dataset will be done in excel and all the findings will be indicated in
the word document. For that person who will not be able to access the excel file, there is still a
better illustration of the actual findings in the findings section and this, therefore, gives a clear
view on the transfer of information from a tool of analysis to an area of literature in a more
understanding and elaborative way. Therefore there will be no excel file but only its findings and
results.
I have bread and sweet potato. There are a production and packaging company for sweet potato
called Potato Generators which was visited alongside the production company for bread called
Legit Bakers. The actual variables were; amounts in tones produced over a period of one month,
for both bread and potatoes ensuring great minimization of production costs. The actual variable
indication for the amount of bread produced is; ABP while that indicating the number of potatoes
produced is APP. The amounts produced are the amounts bought. The next variable is the cost on
each variable under study which will be denoted by COB for bread and COP for potatoes. This
being the demand for production cost, there was a need for the inclusion of, profit variables for
Paraphrase This Document
Need a fresh take? Get an instant paraphrase of this document with our AI Paraphraser
Professional
both. The amounts of profit realized after the demand of both the products has variable
representations of POB AND POP for profit on bread and profit on potatoes respectively (Marek,
Schaufeli & Maslach, 2017). Of the six variables, there will be independent analysis after which
comparisons will be done (Lucijanić, 2016). To potatoes, bread is superior quality and what is
actually looked for is, in case of a reduction in the production costs of bread; what will be the
price of bread? How will the demand for bread grow? How will this affect the inferior product?
Findings
On the findings section, there are three analytical results that will be displayed, these are the
descriptive statistics, the bivariate correlation and the regression analysis.
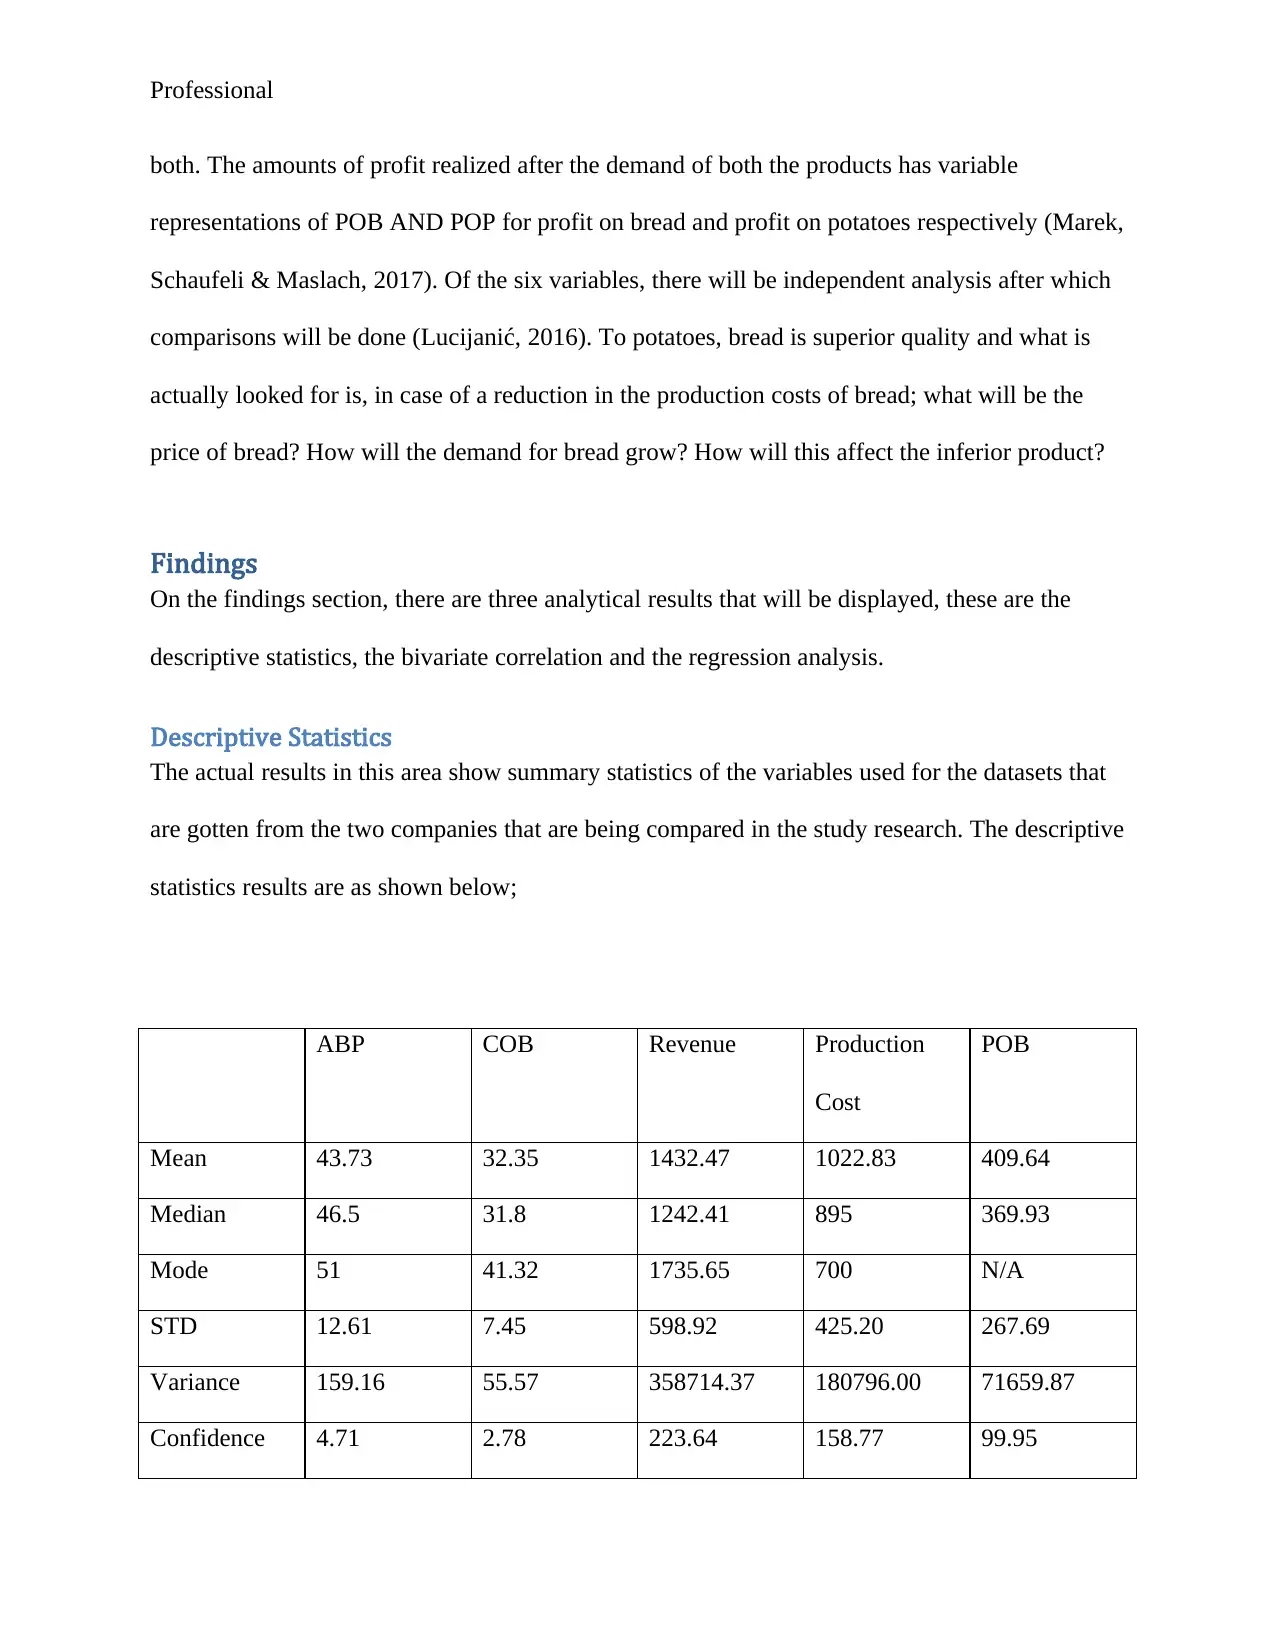
Descriptive Statistics
The actual results in this area show summary statistics of the variables used for the datasets that
are gotten from the two companies that are being compared in the study research. The descriptive
statistics results are as shown below;
ABP COB Revenue Production
Cost
POB
Mean 43.73 32.35 1432.47 1022.83 409.64
Median 46.5 31.8 1242.41 895 369.93
Mode 51 41.32 1735.65 700 N/A
STD 12.61 7.45 598.92 425.20 267.69
Variance 159.16 55.57 358714.37 180796.00 71659.87
Confidence 4.71 2.78 223.64 158.77 99.95
both. The amounts of profit realized after the demand of both the products has variable
representations of POB AND POP for profit on bread and profit on potatoes respectively (Marek,
Schaufeli & Maslach, 2017). Of the six variables, there will be independent analysis after which
comparisons will be done (Lucijanić, 2016). To potatoes, bread is superior quality and what is
actually looked for is, in case of a reduction in the production costs of bread; what will be the
price of bread? How will the demand for bread grow? How will this affect the inferior product?
Findings
On the findings section, there are three analytical results that will be displayed, these are the
descriptive statistics, the bivariate correlation and the regression analysis.
Descriptive Statistics
The actual results in this area show summary statistics of the variables used for the datasets that
are gotten from the two companies that are being compared in the study research. The descriptive
statistics results are as shown below;
ABP COB Revenue Production
Cost
POB
Mean 43.73 32.35 1432.47 1022.83 409.64
Median 46.5 31.8 1242.41 895 369.93
Mode 51 41.32 1735.65 700 N/A
STD 12.61 7.45 598.92 425.20 267.69
Variance 159.16 55.57 358714.37 180796.00 71659.87
Confidence 4.71 2.78 223.64 158.77 99.95
Professional
interval
(95.0%)
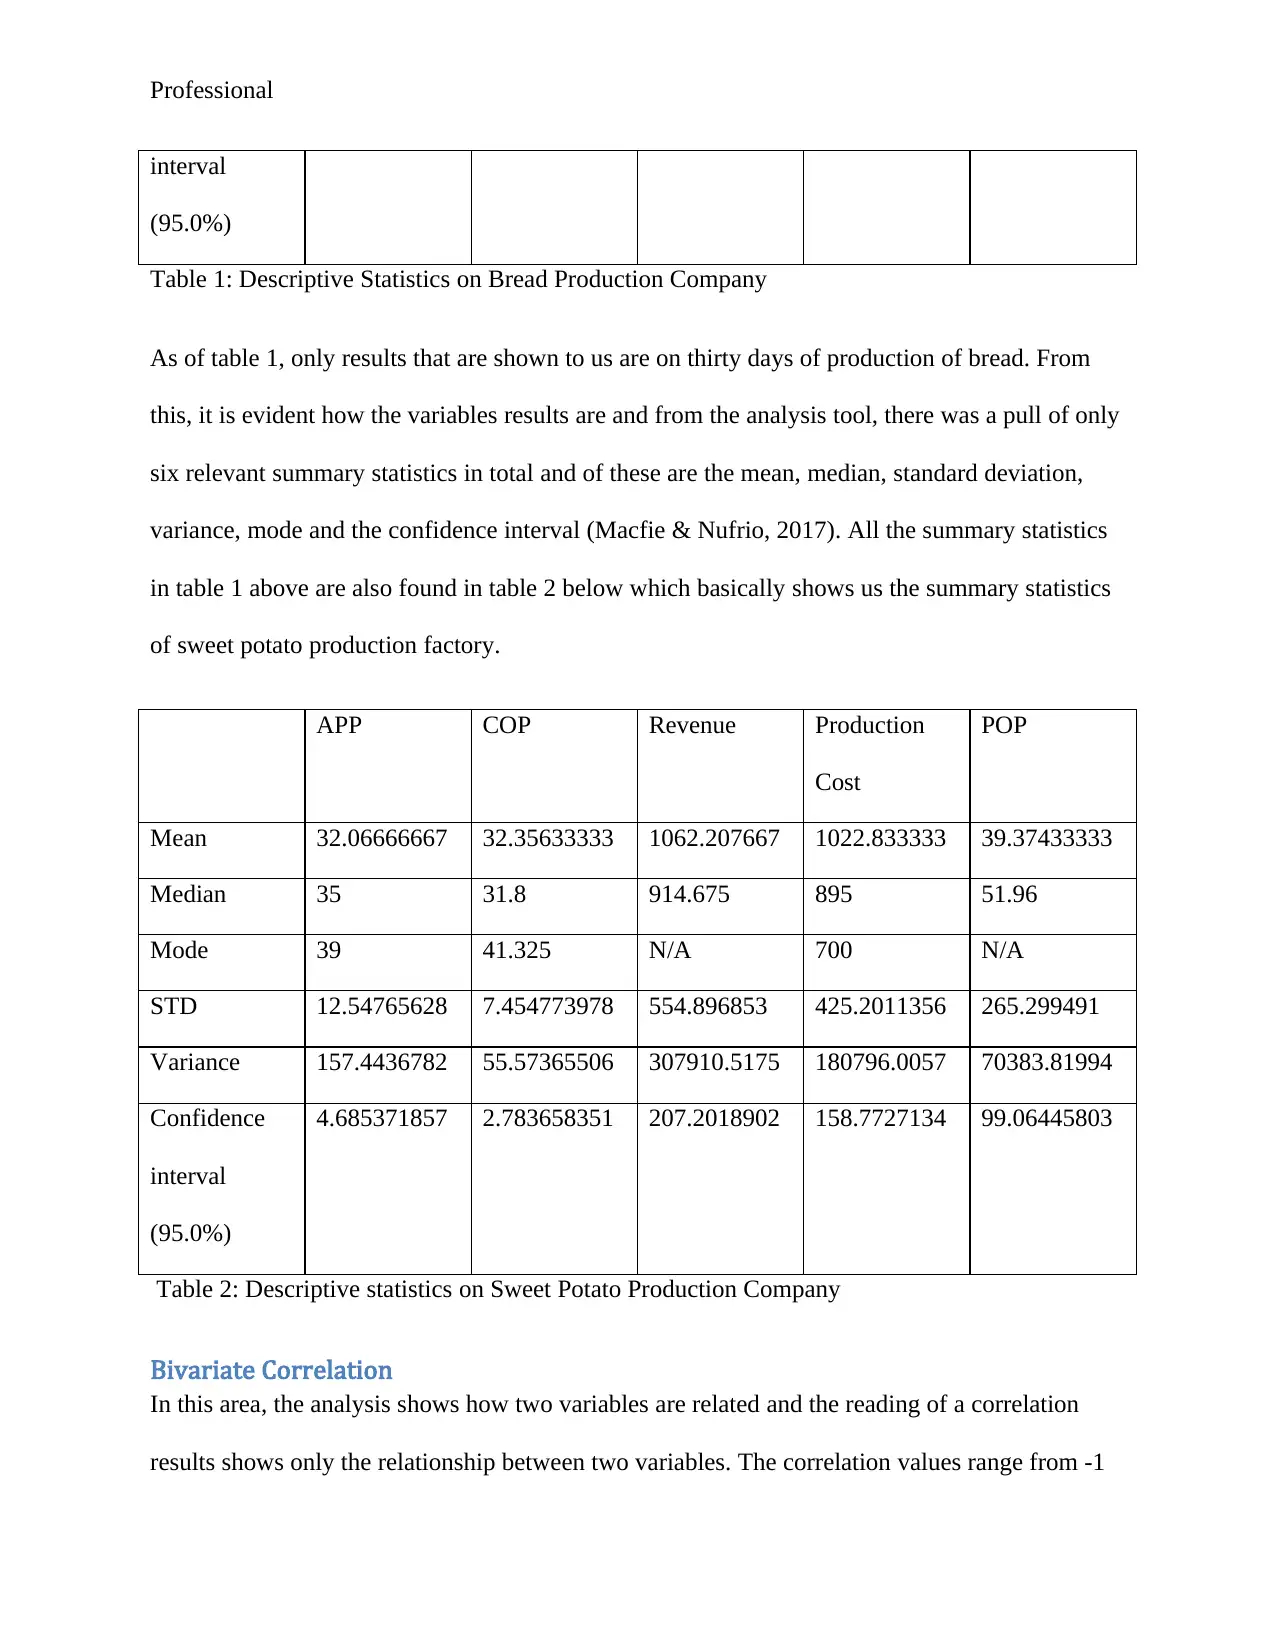
Table 1: Descriptive Statistics on Bread Production Company
As of table 1, only results that are shown to us are on thirty days of production of bread. From
this, it is evident how the variables results are and from the analysis tool, there was a pull of only
six relevant summary statistics in total and of these are the mean, median, standard deviation,
variance, mode and the confidence interval (Macfie & Nufrio, 2017). All the summary statistics
in table 1 above are also found in table 2 below which basically shows us the summary statistics
of sweet potato production factory.
APP COP Revenue Production
Cost
POP
Mean 32.06666667 32.35633333 1062.207667 1022.833333 39.37433333
Median 35 31.8 914.675 895 51.96
Mode 39 41.325 N/A 700 N/A
STD 12.54765628 7.454773978 554.896853 425.2011356 265.299491
Variance 157.4436782 55.57365506 307910.5175 180796.0057 70383.81994
Confidence
interval
(95.0%)
4.685371857 2.783658351 207.2018902 158.7727134 99.06445803
Table 2: Descriptive statistics on Sweet Potato Production Company
Bivariate Correlation
In this area, the analysis shows how two variables are related and the reading of a correlation
results shows only the relationship between two variables. The correlation values range from -1
interval
(95.0%)
Table 1: Descriptive Statistics on Bread Production Company
As of table 1, only results that are shown to us are on thirty days of production of bread. From
this, it is evident how the variables results are and from the analysis tool, there was a pull of only
six relevant summary statistics in total and of these are the mean, median, standard deviation,
variance, mode and the confidence interval (Macfie & Nufrio, 2017). All the summary statistics
in table 1 above are also found in table 2 below which basically shows us the summary statistics
of sweet potato production factory.
APP COP Revenue Production
Cost
POP
Mean 32.06666667 32.35633333 1062.207667 1022.833333 39.37433333
Median 35 31.8 914.675 895 51.96
Mode 39 41.325 N/A 700 N/A
STD 12.54765628 7.454773978 554.896853 425.2011356 265.299491
Variance 157.4436782 55.57365506 307910.5175 180796.0057 70383.81994
Confidence
interval
(95.0%)
4.685371857 2.783658351 207.2018902 158.7727134 99.06445803
Table 2: Descriptive statistics on Sweet Potato Production Company
Bivariate Correlation
In this area, the analysis shows how two variables are related and the reading of a correlation
results shows only the relationship between two variables. The correlation values range from -1
⊘ This is a preview!⊘
Do you want full access?
Subscribe today to unlock all pages.
Trusted by 1+ million students worldwide
Professional
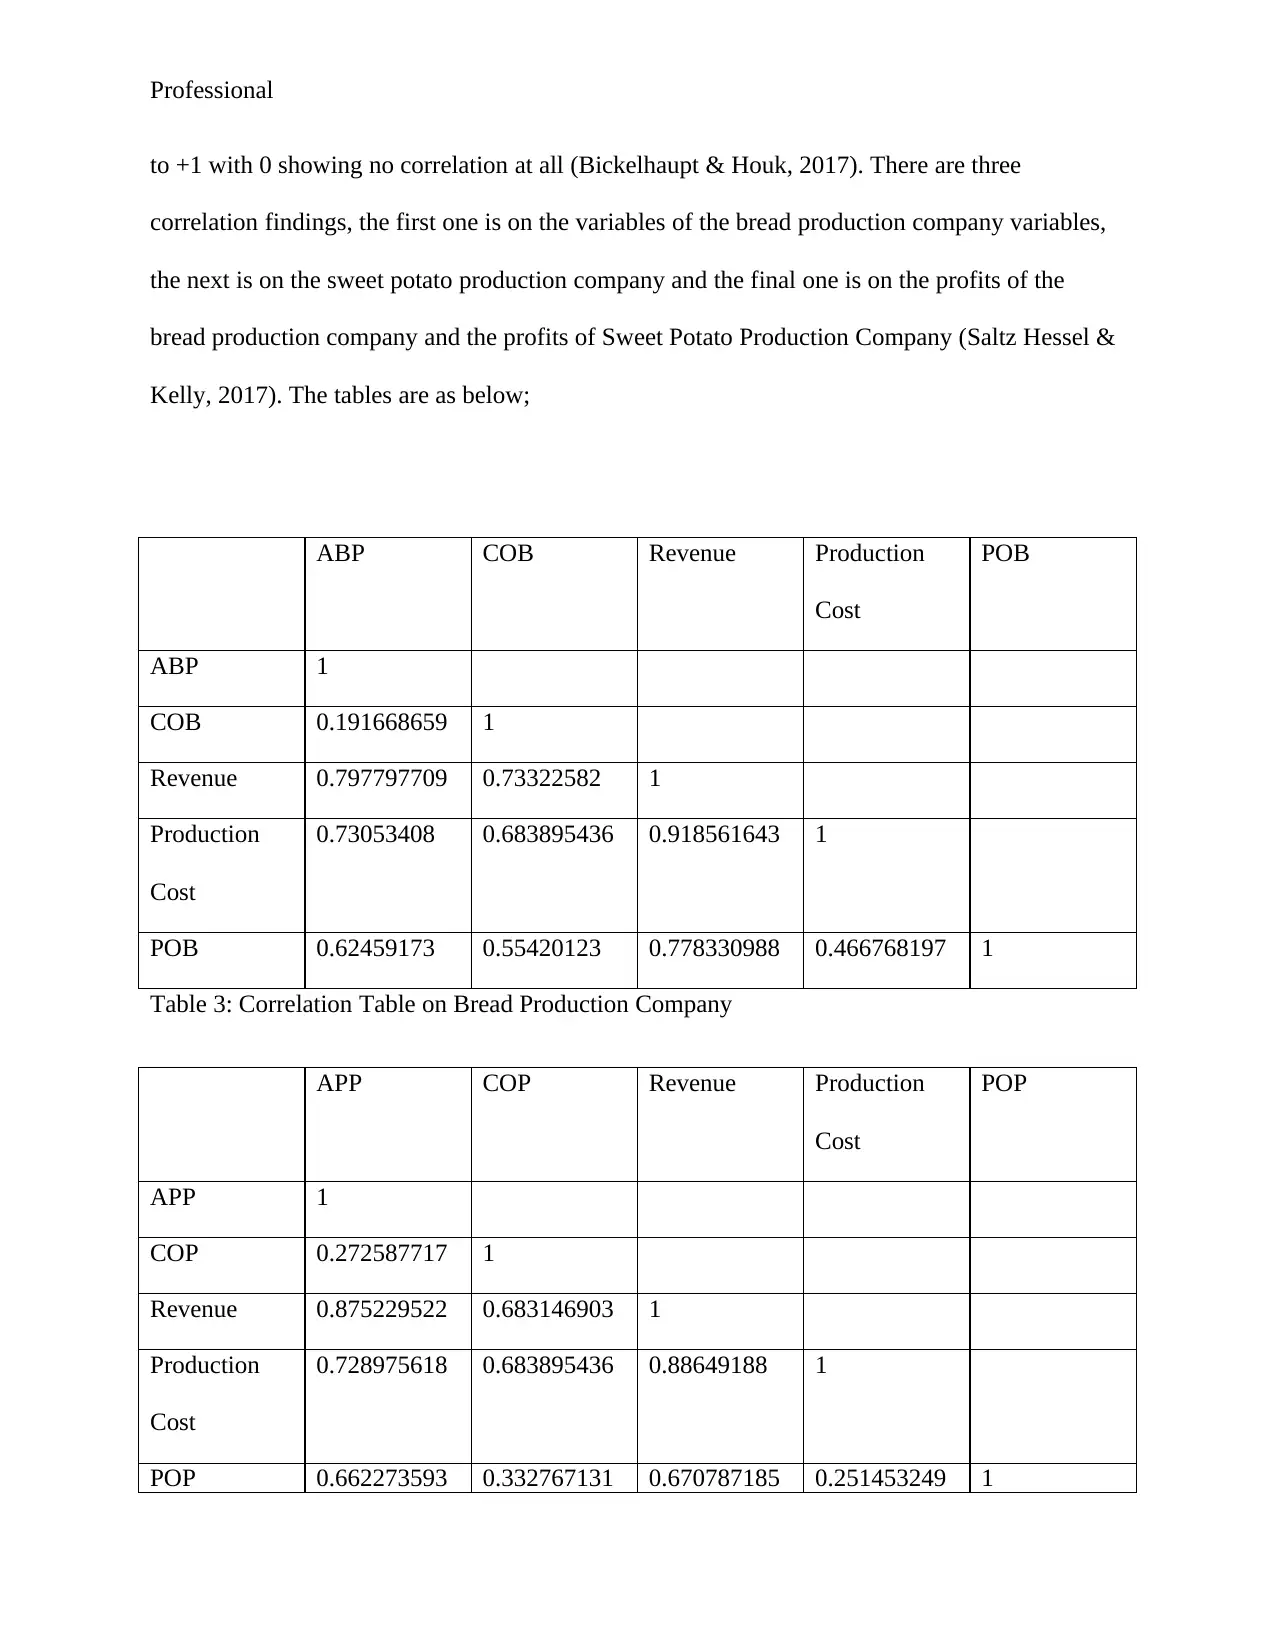
to +1 with 0 showing no correlation at all (Bickelhaupt & Houk, 2017). There are three
correlation findings, the first one is on the variables of the bread production company variables,
the next is on the sweet potato production company and the final one is on the profits of the
bread production company and the profits of Sweet Potato Production Company (Saltz Hessel &
Kelly, 2017). The tables are as below;
ABP COB Revenue Production
Cost
POB
ABP 1
COB 0.191668659 1
Revenue 0.797797709 0.73322582 1
Production
Cost
0.73053408 0.683895436 0.918561643 1
POB 0.62459173 0.55420123 0.778330988 0.466768197 1
Table 3: Correlation Table on Bread Production Company
APP COP Revenue Production
Cost
POP
APP 1
COP 0.272587717 1
Revenue 0.875229522 0.683146903 1
Production
Cost
0.728975618 0.683895436 0.88649188 1
POP 0.662273593 0.332767131 0.670787185 0.251453249 1
Paraphrase This Document
Need a fresh take? Get an instant paraphrase of this document with our AI Paraphraser
Professional
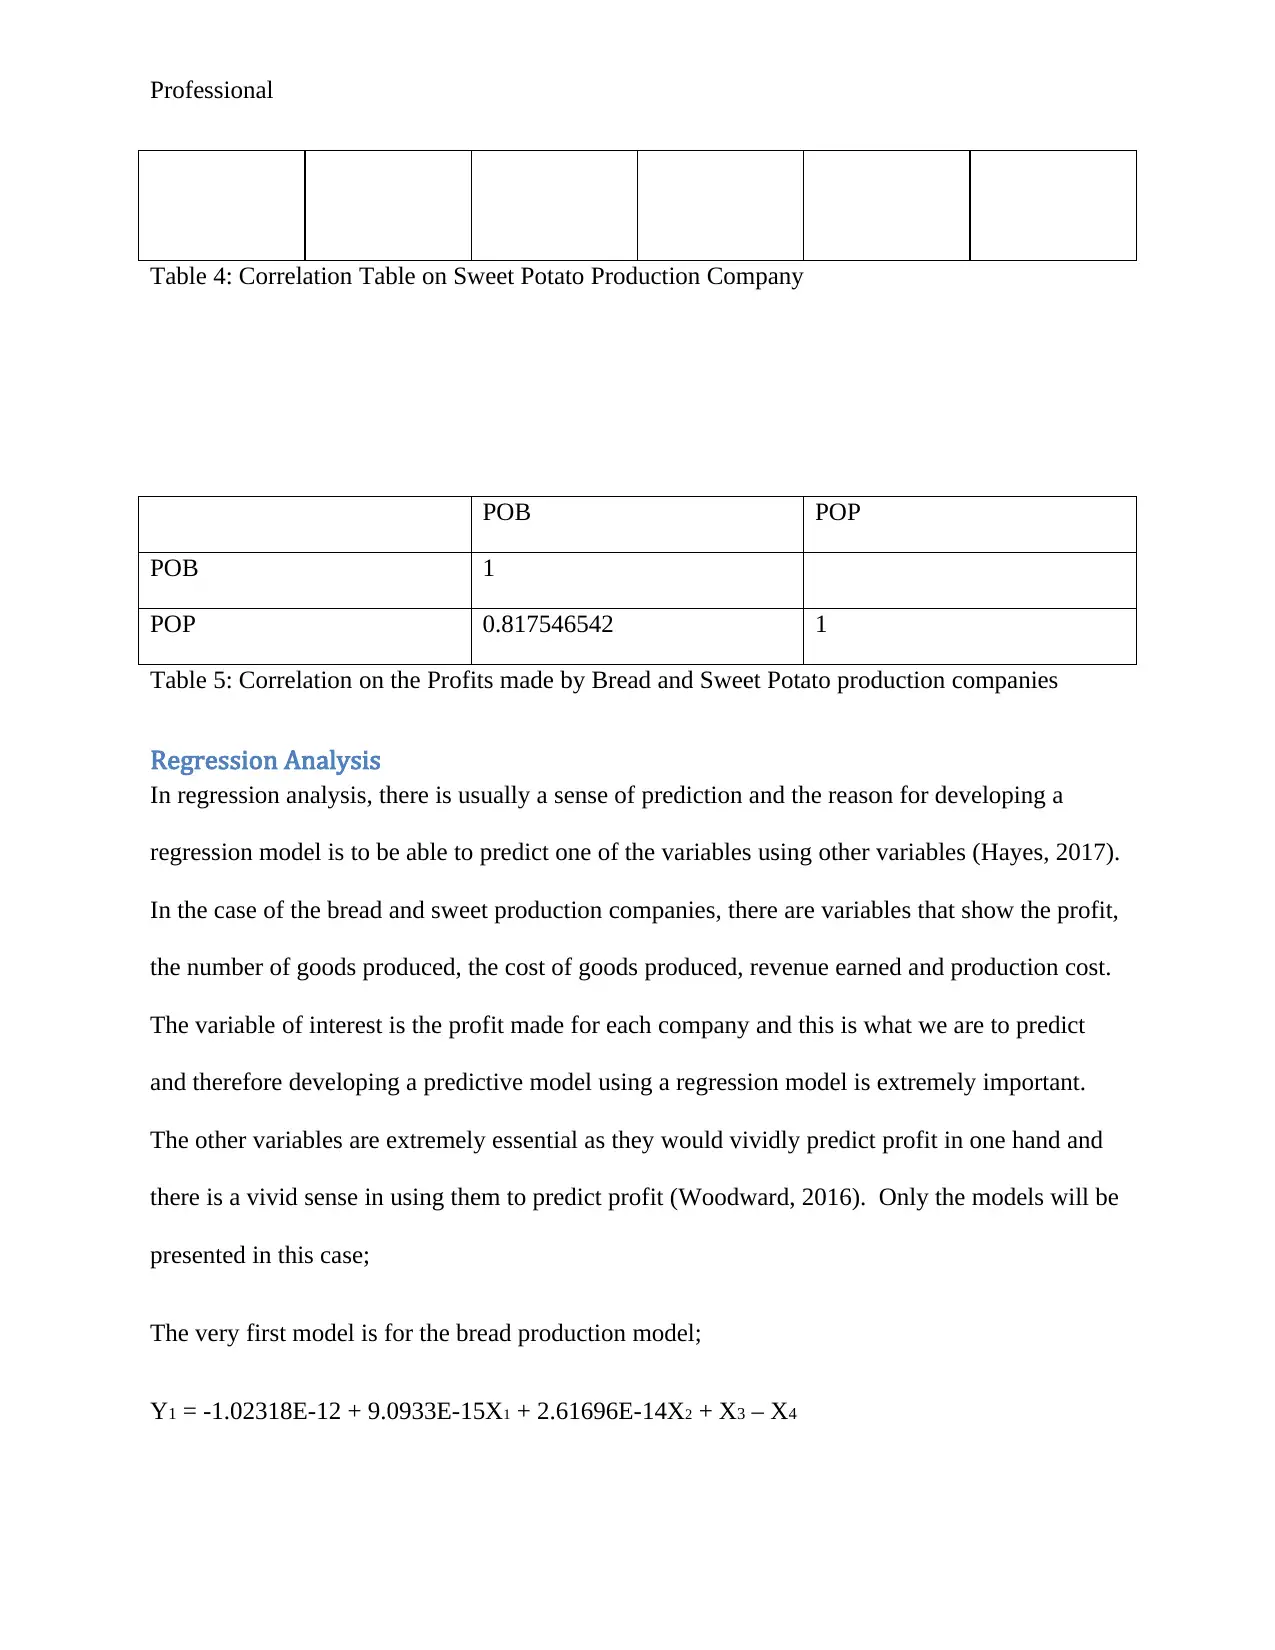
Table 4: Correlation Table on Sweet Potato Production Company
POB POP
POB 1
POP 0.817546542 1
Table 5: Correlation on the Profits made by Bread and Sweet Potato production companies
Regression Analysis
In regression analysis, there is usually a sense of prediction and the reason for developing a
regression model is to be able to predict one of the variables using other variables (Hayes, 2017).
In the case of the bread and sweet production companies, there are variables that show the profit,
the number of goods produced, the cost of goods produced, revenue earned and production cost.
The variable of interest is the profit made for each company and this is what we are to predict
and therefore developing a predictive model using a regression model is extremely important.
The other variables are extremely essential as they would vividly predict profit in one hand and
there is a vivid sense in using them to predict profit (Woodward, 2016). Only the models will be
presented in this case;
The very first model is for the bread production model;
Y1 = -1.02318E-12 + 9.0933E-15X1 + 2.61696E-14X2 + X3 – X4
Professional
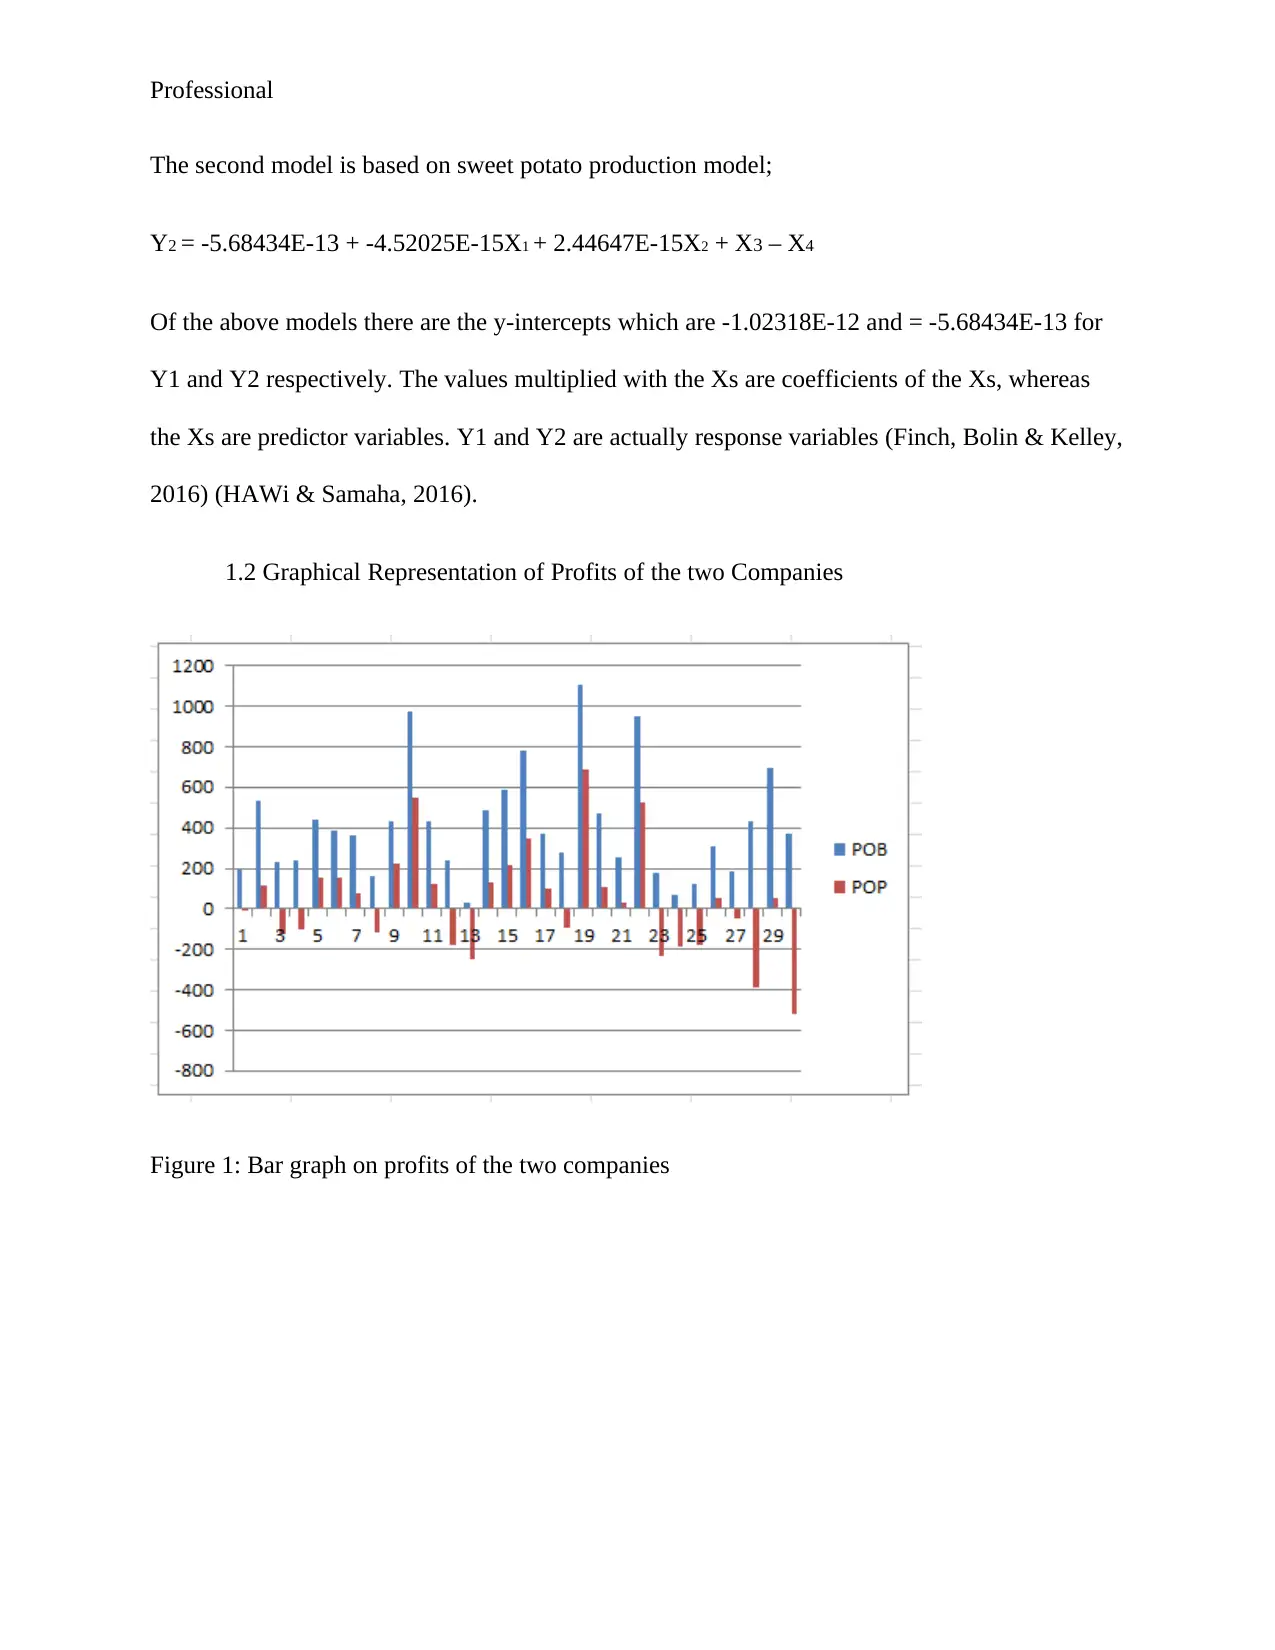
The second model is based on sweet potato production model;
Y2 = -5.68434E-13 + -4.52025E-15X1 + 2.44647E-15X2 + X3 – X4
Of the above models there are the y-intercepts which are -1.02318E-12 and = -5.68434E-13 for
Y1 and Y2 respectively. The values multiplied with the Xs are coefficients of the Xs, whereas
the Xs are predictor variables. Y1 and Y2 are actually response variables (Finch, Bolin & Kelley,
2016) (HAWi & Samaha, 2016).
1.2 Graphical Representation of Profits of the two Companies
Figure 1: Bar graph on profits of the two companies
⊘ This is a preview!⊘
Do you want full access?
Subscribe today to unlock all pages.
Trusted by 1+ million students worldwide
1 out of 18
Related Documents


Your All-in-One AI-Powered Toolkit for Academic Success.
+13062052269
info@desklib.com
Available 24*7 on WhatsApp / Email
![[object Object]](/_next/static/media/star-bottom.7253800d.svg)
Unlock your academic potential
Copyright © 2020–2026 A2Z Services. All Rights Reserved. Developed and managed by ZUCOL.