Capital Budgeting Report: Delaware Pipe Production Line
VerifiedAdded on 2020/03/16
|18
|3931
|154
Report
AI Summary
This capital budgeting report analyzes the viability of a new production line for Delaware Pipe, focusing on the production of 10-inch and 12-inch pipes. The report begins with an introduction to the company and the project, followed by a detailed analysis of the financial implications. It includes an examination of various financial analysis techniques, such as Net Present Value (NPV), Internal Rate of Return (IRR), Payback Period, and Profitability Index (PI), under worst-case, most-likely, and best-case scenarios. The analysis incorporates incremental cash flow tables, depreciation, and sensitivity analysis to sales quantity, providing a comprehensive assessment of the project's financial feasibility. The report concludes with recommendations based on the analysis and a discussion of the project's potential risks and rewards. The analysis reveals that the project is financially viable and recommends the implementation of the new production line.
ECF6010 Business Finance
The task: Prepare a capital budgeting report
Name
Institution
Case Study – Delaware Pipes 1
The task: Prepare a capital budgeting report
Name
Institution
Case Study – Delaware Pipes 1
Paraphrase This Document
Need a fresh take? Get an instant paraphrase of this document with our AI Paraphraser
ECF6010 Business Finance
Table of Contents
1. Introduction.................................................................................................................................3
2. Analysis........................................................................................................................................3
2.1. Question One........................................................................................................................3
2.2. Question Two: the incremental cash flow table.................................................................5
2.3. Question Three: Decision Techniques...................................................................................7
2.3.2. Payback Period................................................................................................................8
2.4. Question 4: Sensitivity analysis of NPV to sales quantity...............................................10
2.5. Question 5: The project’s expected NPV, standard deviation, and coefficient of
variation.........................................................................................................................................13
2.6. Question 6: The minimum annual increase.....................................................................14
2.7. Question 7: Does higher discounting rate make sense.....................................................15
2.8. Recommendation based on questions 1-7.........................................................................16
3. Conclusion..................................................................................................................................16
4. Recommendations......................................................................................................................16
5. References......................................................................................................................................17
Case Study – Delaware Pipes 2
ECF6010 Business Finance
1. Introduction
By using the information given for Mr. Walker about his company, this report is
prepared to analyze the viability and to give some recommendation about a new production
line for two different sizes of pipes in Delaware Pipe.
Delaware Pipe is a company with more than 29 years of background in the pipe
market to producing three used sizes of PVC pipe, 3 in, 6 in and 8 in. The company has
performed very well in the last year only with these three production lines. However, two
other sizes are demanded by the customers, where until the present moment the company
have purchased these goods from another company and have sold them.
Company’s owner, Mr. Walker’s has provided relevant information about the
company and the marketplace of the firm. In addition, the accountant of the Delaware Pipe
has prepared a cost estimation for this production line, which resulted in an unfeasible project
for the company.
In the context of project evaluation, using NPV as one of the evaluation’s method, this
report will show if the project is consistent with the firm goals. Furthermore, a
complementary revision in the accountant’s number will be presented.
2. Analysis
This section entails detailed analysis of the two options, i.e. producing the pipes
internally or buying them. The financial analysis techniques such as Payback Period (PBP),
Net Present Value (NPV), Internal Rate of Return (IRR) and Profitability Index (PI) have
been considered in the analysis based on the three scenarios i.e. Worst Scenario, Most Likely,
and Best.
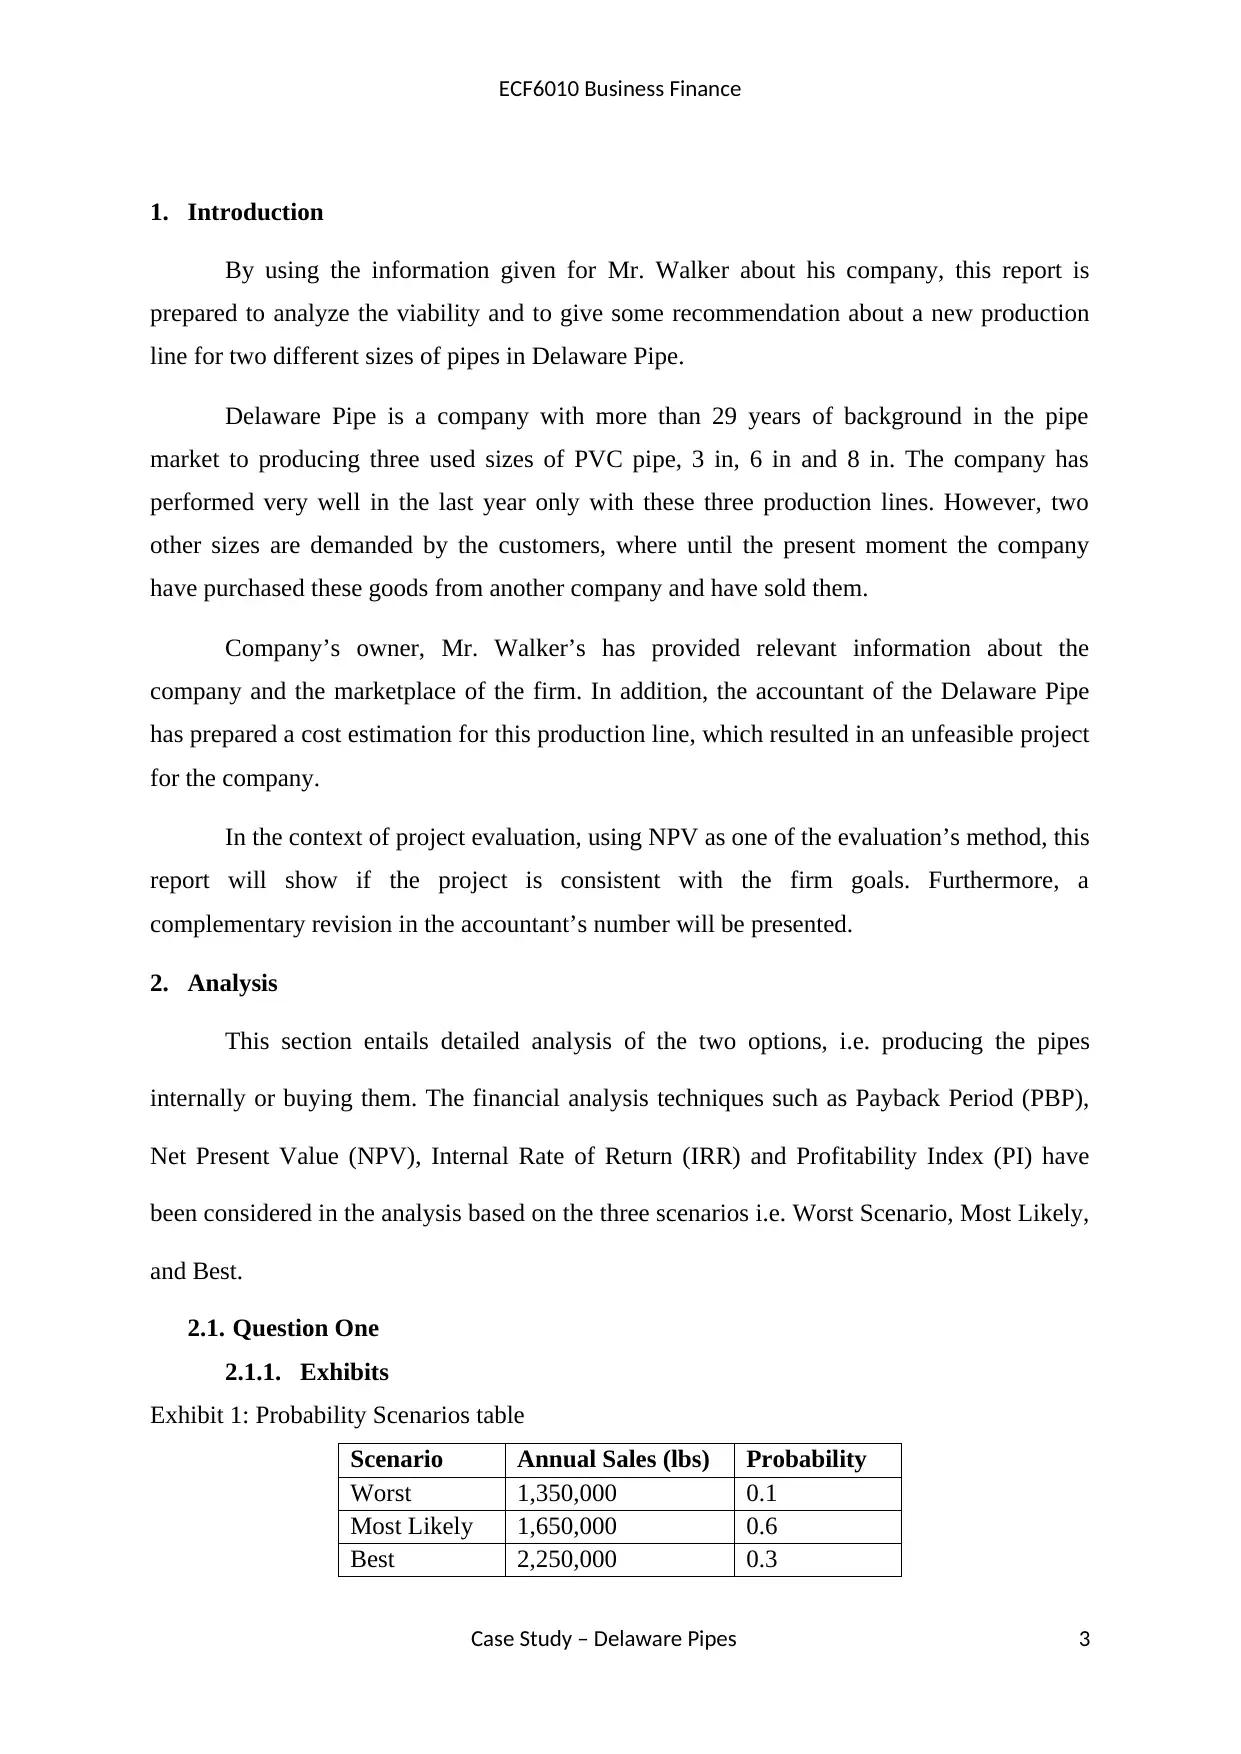
2.1. Question One
2.1.1. Exhibits
Exhibit 1: Probability Scenarios table
Scenario Annual Sales (lbs) Probability
Worst 1,350,000 0.1
Most Likely 1,650,000 0.6
Best 2,250,000 0.3
Case Study – Delaware Pipes 3
1. Introduction
By using the information given for Mr. Walker about his company, this report is
prepared to analyze the viability and to give some recommendation about a new production
line for two different sizes of pipes in Delaware Pipe.
Delaware Pipe is a company with more than 29 years of background in the pipe
market to producing three used sizes of PVC pipe, 3 in, 6 in and 8 in. The company has
performed very well in the last year only with these three production lines. However, two
other sizes are demanded by the customers, where until the present moment the company
have purchased these goods from another company and have sold them.
Company’s owner, Mr. Walker’s has provided relevant information about the
company and the marketplace of the firm. In addition, the accountant of the Delaware Pipe
has prepared a cost estimation for this production line, which resulted in an unfeasible project
for the company.
In the context of project evaluation, using NPV as one of the evaluation’s method, this
report will show if the project is consistent with the firm goals. Furthermore, a
complementary revision in the accountant’s number will be presented.
2. Analysis
This section entails detailed analysis of the two options, i.e. producing the pipes
internally or buying them. The financial analysis techniques such as Payback Period (PBP),
Net Present Value (NPV), Internal Rate of Return (IRR) and Profitability Index (PI) have
been considered in the analysis based on the three scenarios i.e. Worst Scenario, Most Likely,
and Best.
2.1. Question One
2.1.1. Exhibits
Exhibit 1: Probability Scenarios table
Scenario Annual Sales (lbs) Probability
Worst 1,350,000 0.1
Most Likely 1,650,000 0.6
Best 2,250,000 0.3
Case Study – Delaware Pipes 3
⊘ This is a preview!⊘
Do you want full access?
Subscribe today to unlock all pages.
Trusted by 1+ million students worldwide
ECF6010 Business Finance
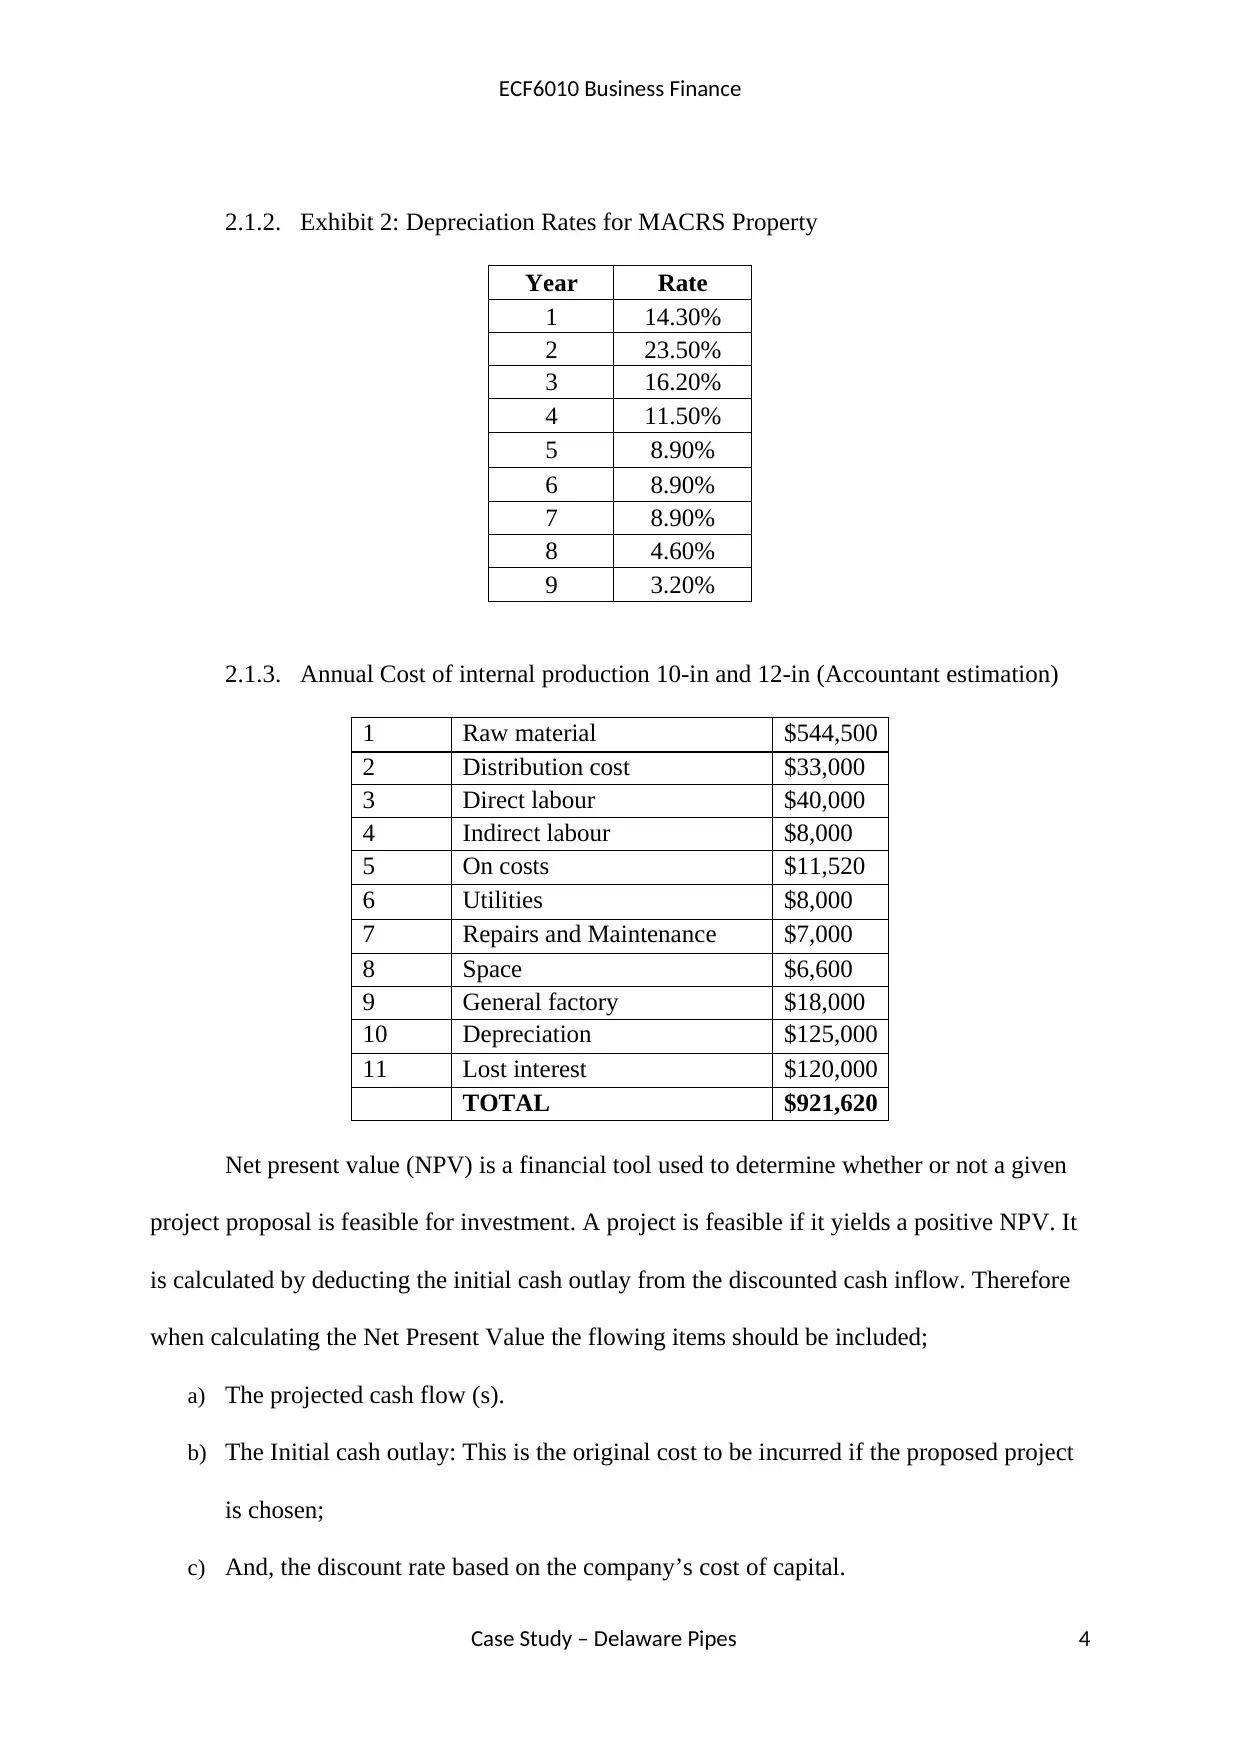
2.1.2. Exhibit 2: Depreciation Rates for MACRS Property
Year Rate
1 14.30%
2 23.50%
3 16.20%
4 11.50%
5 8.90%
6 8.90%
7 8.90%
8 4.60%
9 3.20%
2.1.3. Annual Cost of internal production 10-in and 12-in (Accountant estimation)
1 Raw material $544,500
2 Distribution cost $33,000
3 Direct labour $40,000
4 Indirect labour $8,000
5 On costs $11,520
6 Utilities $8,000
7 Repairs and Maintenance $7,000
8 Space $6,600
9 General factory $18,000
10 Depreciation $125,000
11 Lost interest $120,000
TOTAL $921,620
Net present value (NPV) is a financial tool used to determine whether or not a given
project proposal is feasible for investment. A project is feasible if it yields a positive NPV. It
is calculated by deducting the initial cash outlay from the discounted cash inflow. Therefore
when calculating the Net Present Value the flowing items should be included;
a) The projected cash flow (s).
b) The Initial cash outlay: This is the original cost to be incurred if the proposed project
is chosen;
c) And, the discount rate based on the company’s cost of capital.
Case Study – Delaware Pipes 4
Paraphrase This Document
Need a fresh take? Get an instant paraphrase of this document with our AI Paraphraser
ECF6010 Business Finance
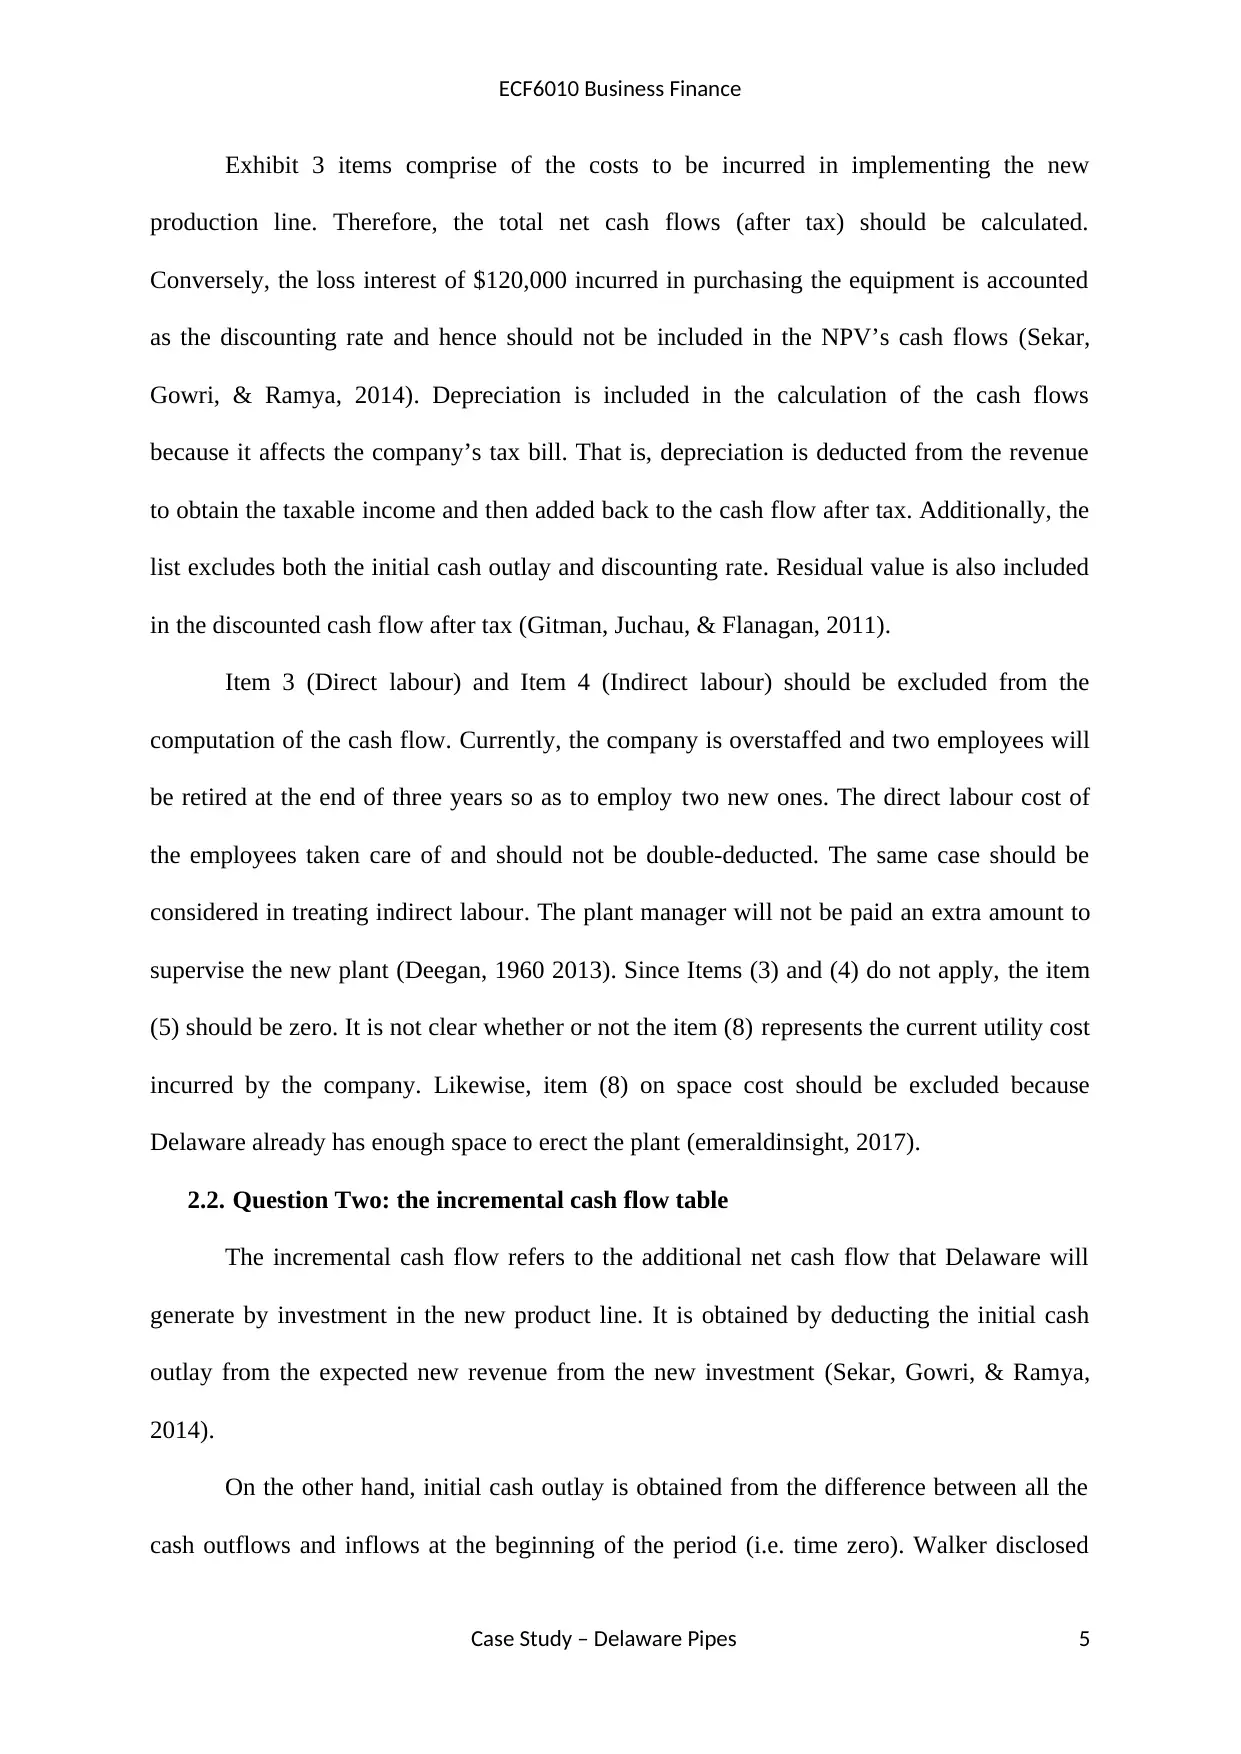
Exhibit 3 items comprise of the costs to be incurred in implementing the new
production line. Therefore, the total net cash flows (after tax) should be calculated.
Conversely, the loss interest of $120,000 incurred in purchasing the equipment is accounted
as the discounting rate and hence should not be included in the NPV’s cash flows (Sekar,
Gowri, & Ramya, 2014). Depreciation is included in the calculation of the cash flows
because it affects the company’s tax bill. That is, depreciation is deducted from the revenue
to obtain the taxable income and then added back to the cash flow after tax. Additionally, the
list excludes both the initial cash outlay and discounting rate. Residual value is also included
in the discounted cash flow after tax (Gitman, Juchau, & Flanagan, 2011).
Item 3 (Direct labour) and Item 4 (Indirect labour) should be excluded from the
computation of the cash flow. Currently, the company is overstaffed and two employees will
be retired at the end of three years so as to employ two new ones. The direct labour cost of
the employees taken care of and should not be double-deducted. The same case should be
considered in treating indirect labour. The plant manager will not be paid an extra amount to
supervise the new plant (Deegan, 1960 2013). Since Items (3) and (4) do not apply, the item
(5) should be zero. It is not clear whether or not the item (8) represents the current utility cost
incurred by the company. Likewise, item (8) on space cost should be excluded because
Delaware already has enough space to erect the plant (emeraldinsight, 2017).
2.2. Question Two: the incremental cash flow table
The incremental cash flow refers to the additional net cash flow that Delaware will
generate by investment in the new product line. It is obtained by deducting the initial cash
outlay from the expected new revenue from the new investment (Sekar, Gowri, & Ramya,
2014).
On the other hand, initial cash outlay is obtained from the difference between all the
cash outflows and inflows at the beginning of the period (i.e. time zero). Walker disclosed
Case Study – Delaware Pipes 5
ECF6010 Business Finance
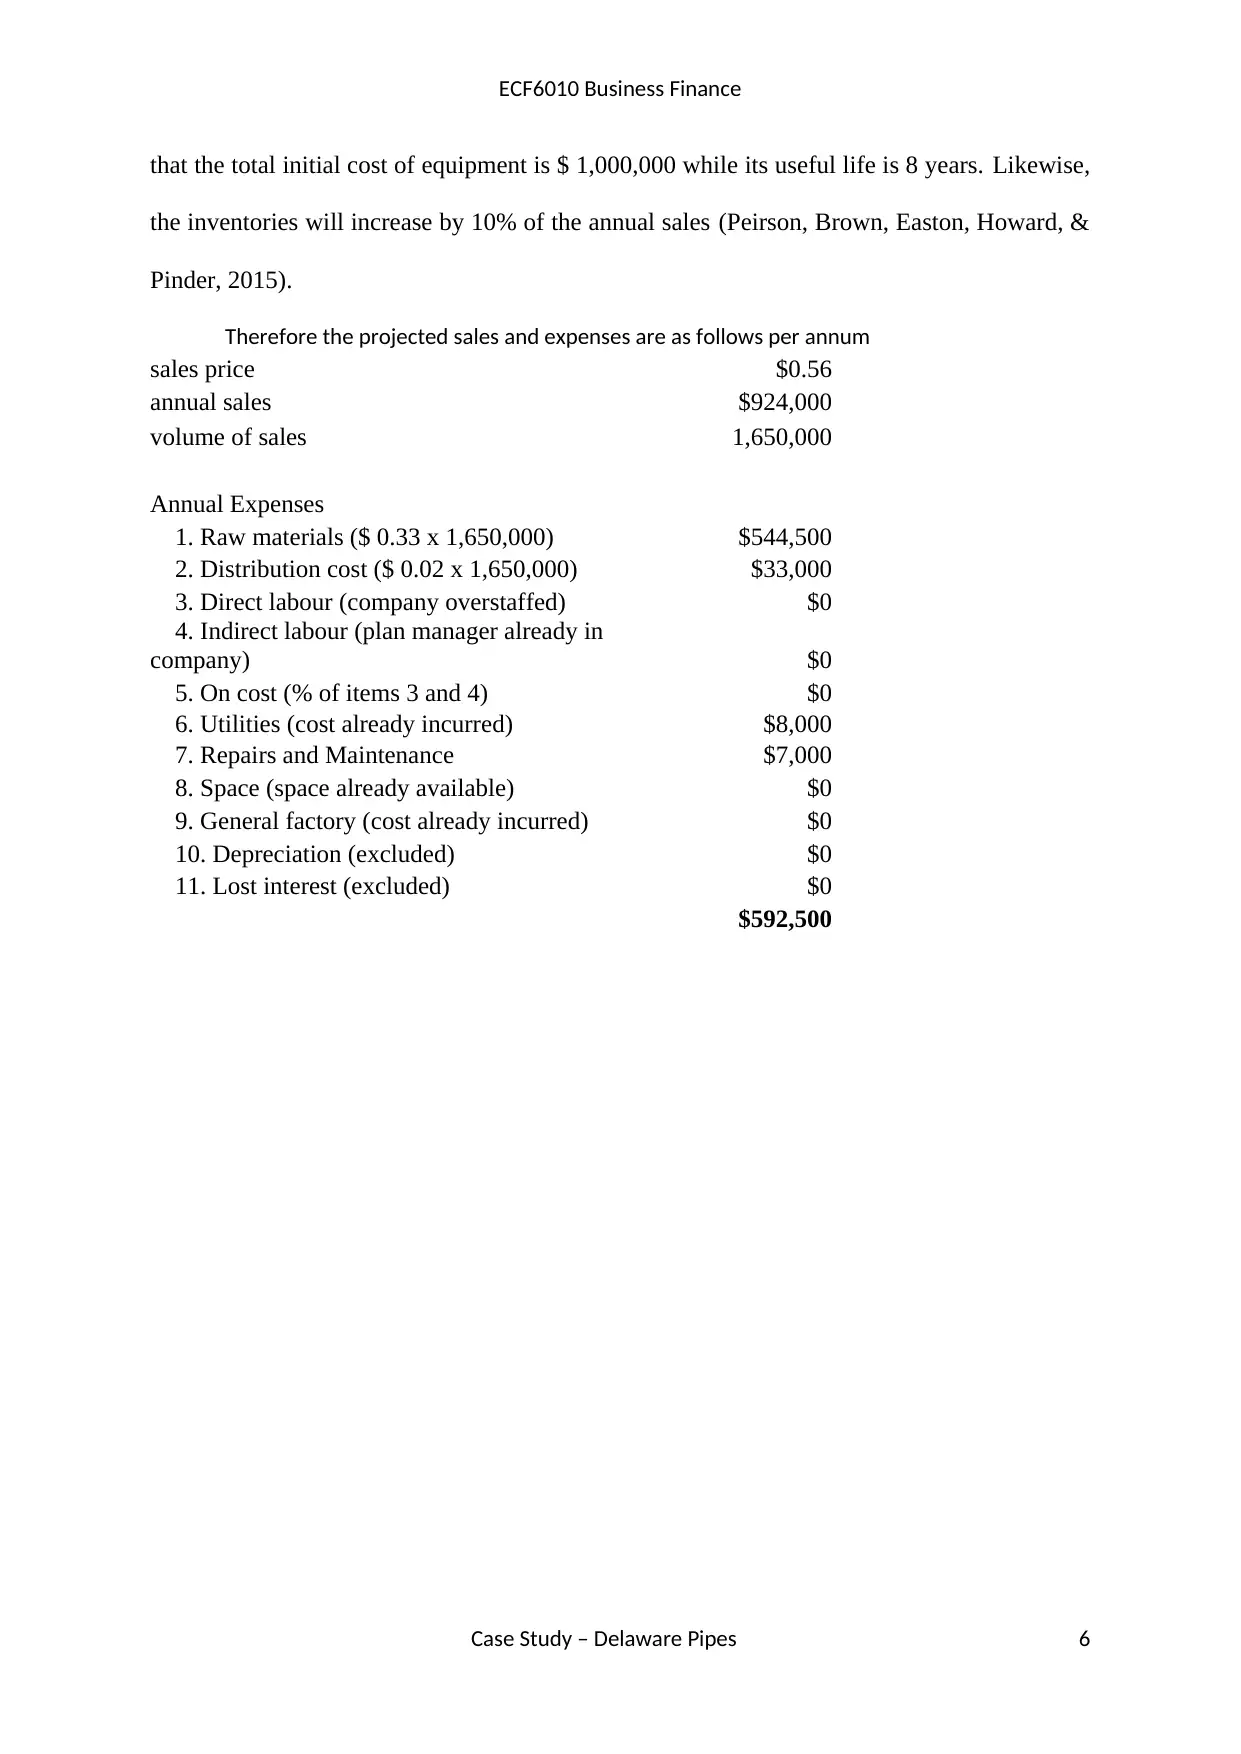
that the total initial cost of equipment is $ 1,000,000 while its useful life is 8 years. Likewise,
the inventories will increase by 10% of the annual sales (Peirson, Brown, Easton, Howard, &
Pinder, 2015).
Therefore the projected sales and expenses are as follows per annum
sales price $0.56
annual sales $924,000
volume of sales 1,650,000
Annual Expenses
1. Raw materials ($ 0.33 x 1,650,000) $544,500
2. Distribution cost ($ 0.02 x 1,650,000) $33,000
3. Direct labour (company overstaffed) $0
4. Indirect labour (plan manager already in
company) $0
5. On cost (% of items 3 and 4) $0
6. Utilities (cost already incurred) $8,000
7. Repairs and Maintenance $7,000
8. Space (space already available) $0
9. General factory (cost already incurred) $0
10. Depreciation (excluded) $0
11. Lost interest (excluded) $0
$592,500
Case Study – Delaware Pipes 6
⊘ This is a preview!⊘
Do you want full access?
Subscribe today to unlock all pages.
Trusted by 1+ million students worldwide
ECF6010 Business Finance
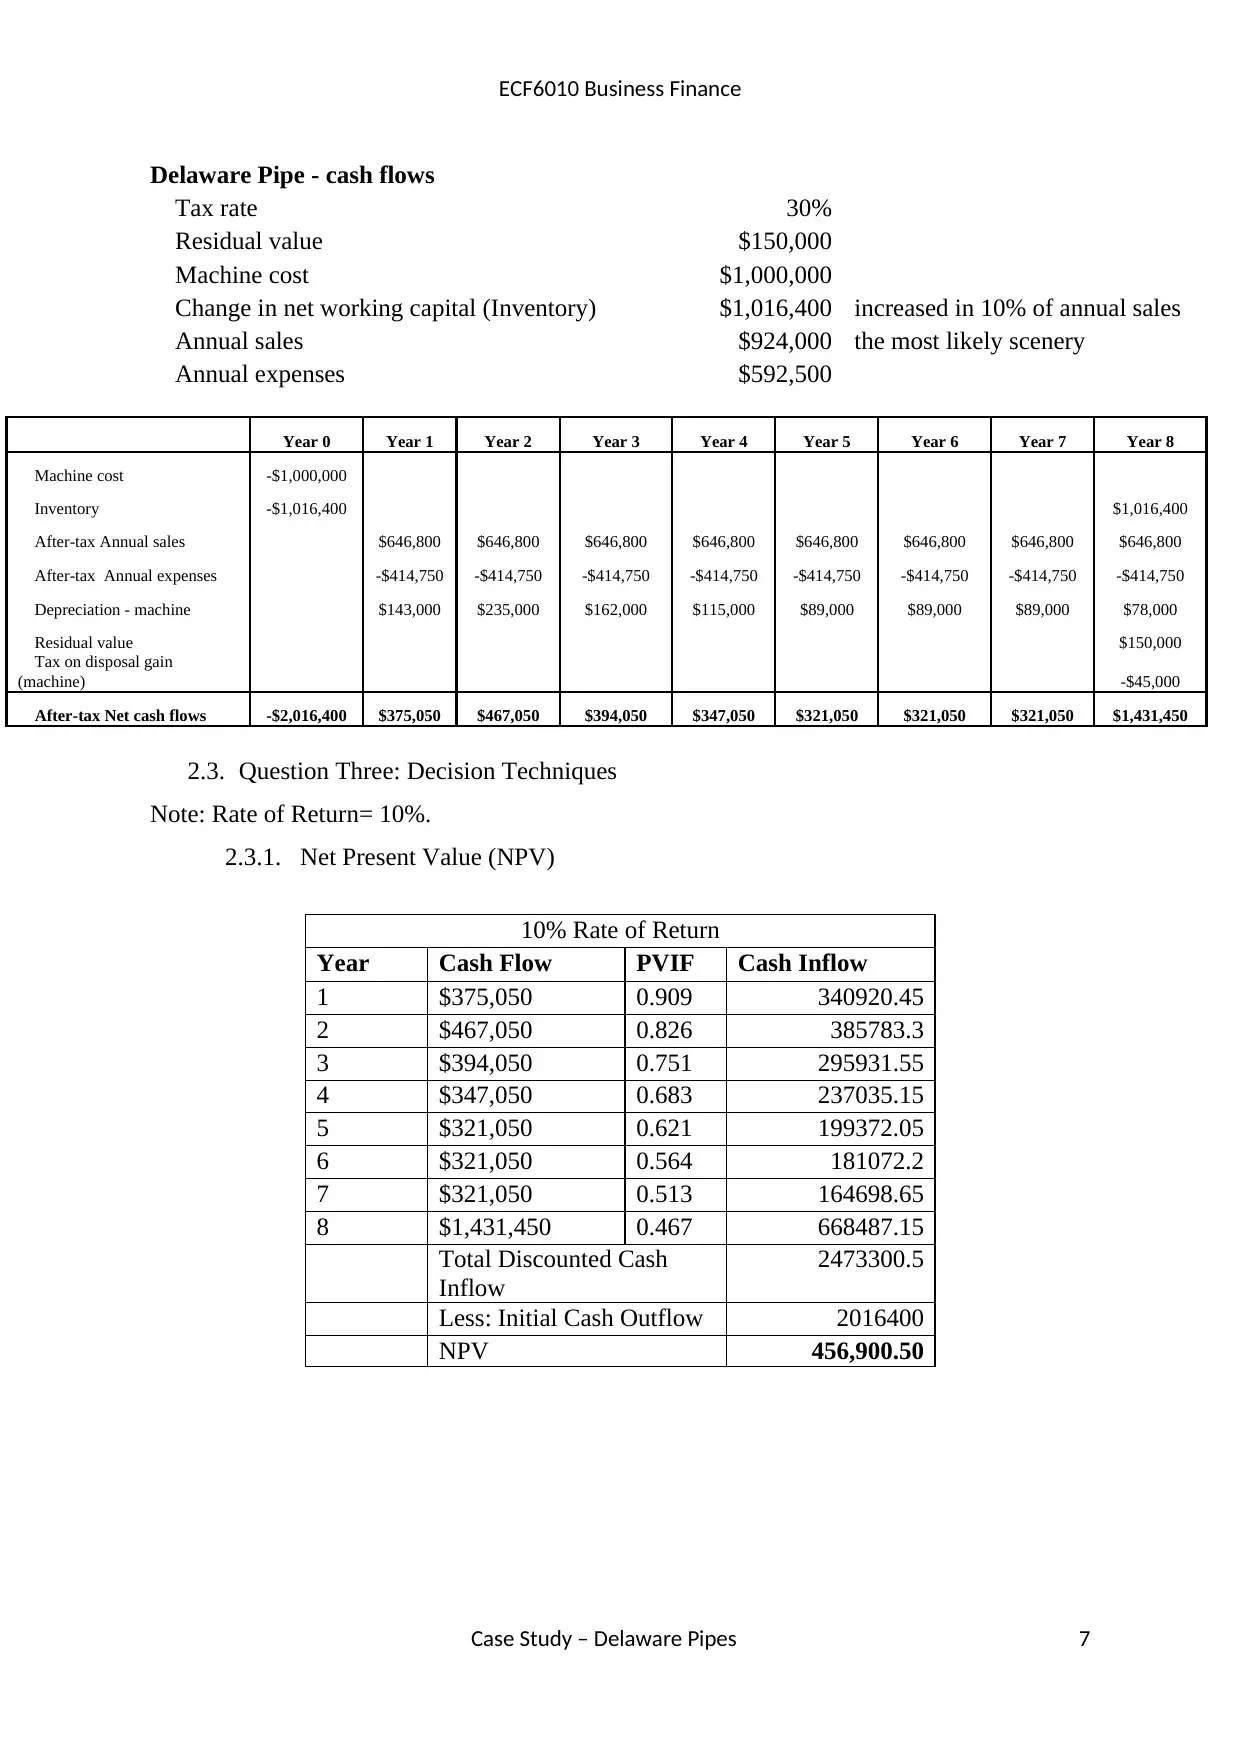
Delaware Pipe - cash flows
Tax rate 30%
Residual value $150,000
Machine cost $1,000,000
Change in net working capital (Inventory) $1,016,400 increased in 10% of annual sales
Annual sales $924,000 the most likely scenery
Annual expenses $592,500
Year 0 Year 1 Year 2 Year 3 Year 4 Year 5 Year 6 Year 7 Year 8
Machine cost -$1,000,000
Inventory -$1,016,400 $1,016,400
After-tax Annual sales $646,800 $646,800 $646,800 $646,800 $646,800 $646,800 $646,800 $646,800
After-tax Annual expenses -$414,750 -$414,750 -$414,750 -$414,750 -$414,750 -$414,750 -$414,750 -$414,750
Depreciation - machine $143,000 $235,000 $162,000 $115,000 $89,000 $89,000 $89,000 $78,000
Residual value $150,000
Tax on disposal gain
(machine) -$45,000
After-tax Net cash flows -$2,016,400 $375,050 $467,050 $394,050 $347,050 $321,050 $321,050 $321,050 $1,431,450
2.3. Question Three: Decision Techniques
Note: Rate of Return= 10%.
2.3.1. Net Present Value (NPV)
10% Rate of Return
Year Cash Flow PVIF Cash Inflow
1 $375,050 0.909 340920.45
2 $467,050 0.826 385783.3
3 $394,050 0.751 295931.55
4 $347,050 0.683 237035.15
5 $321,050 0.621 199372.05
6 $321,050 0.564 181072.2
7 $321,050 0.513 164698.65
8 $1,431,450 0.467 668487.15
Total Discounted Cash
Inflow
2473300.5
Less: Initial Cash Outflow 2016400
NPV 456,900.50
Case Study – Delaware Pipes 7
Paraphrase This Document
Need a fresh take? Get an instant paraphrase of this document with our AI Paraphraser
ECF6010 Business Finance
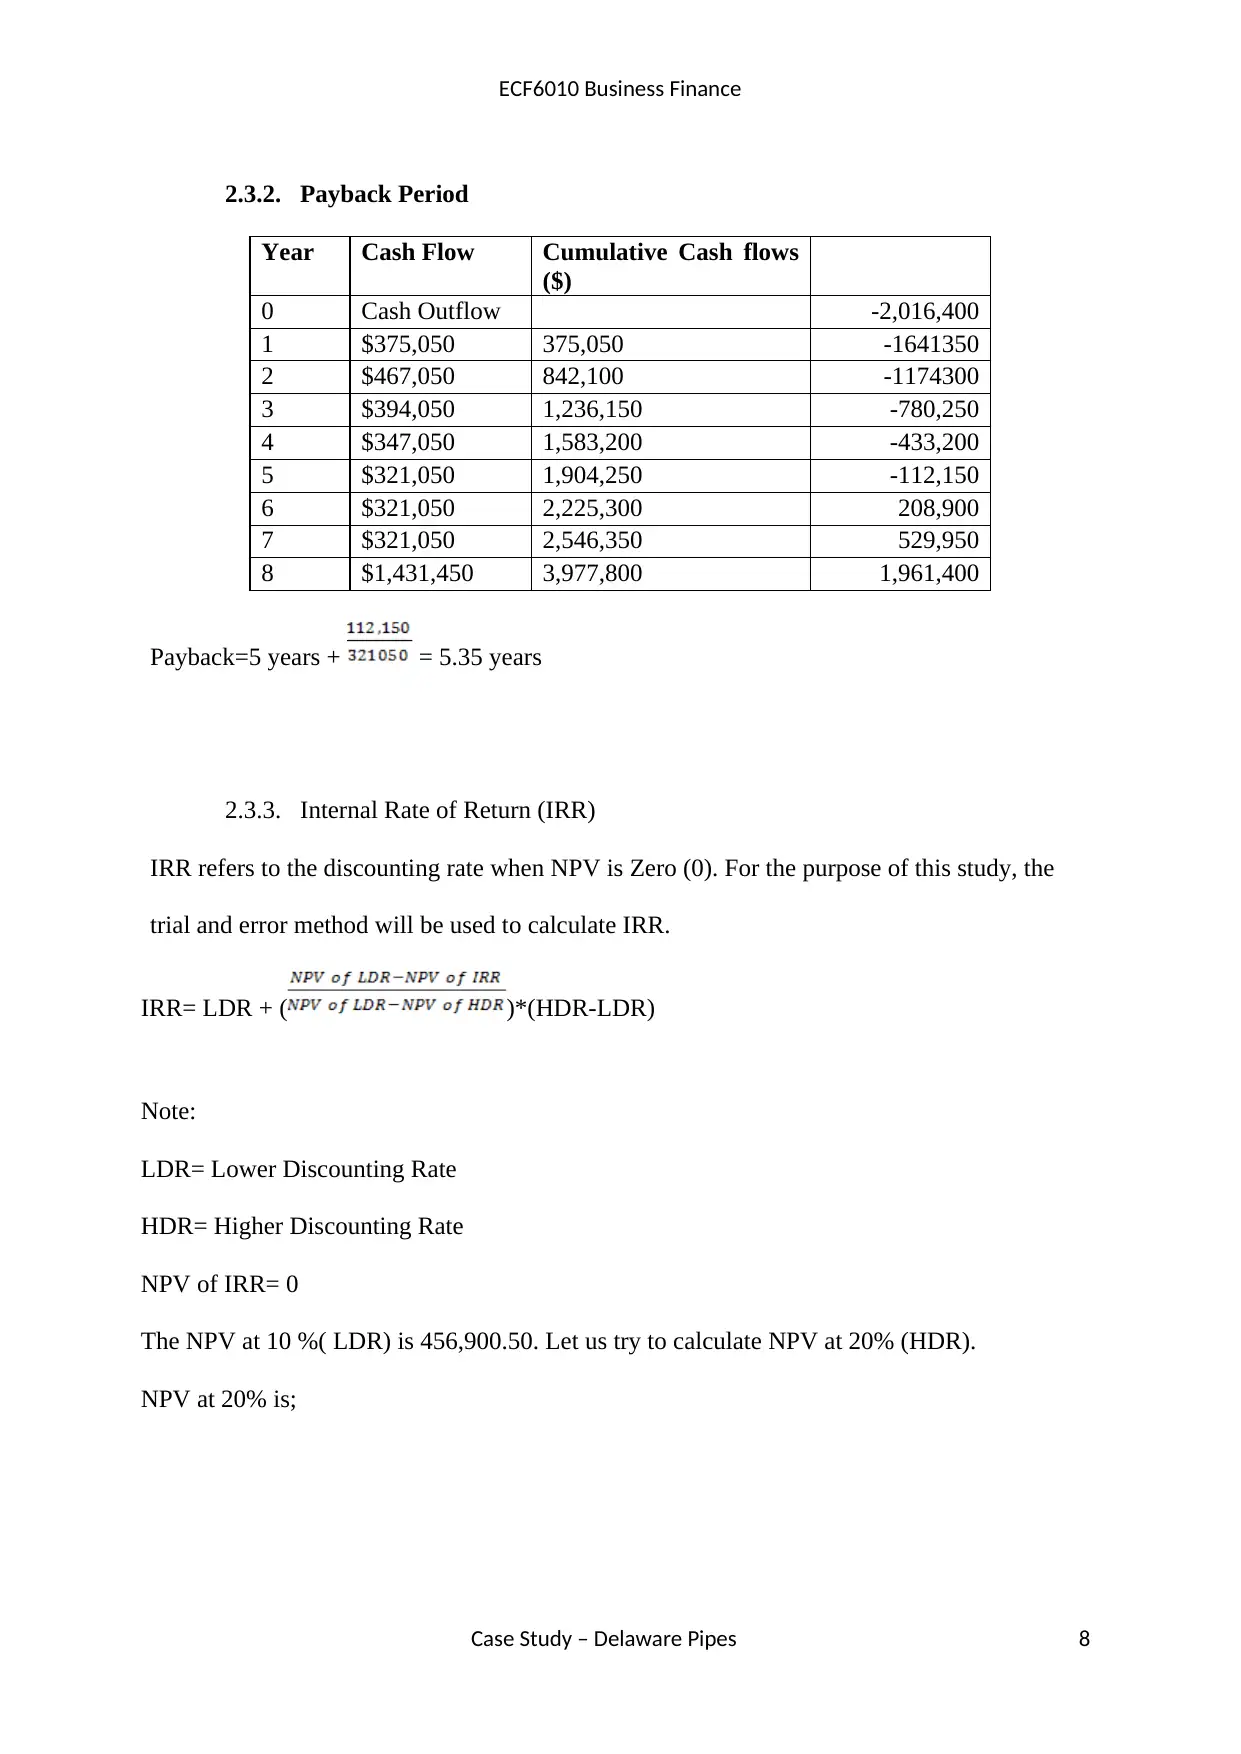
2.3.2. Payback Period
Year Cash Flow Cumulative Cash flows
($)
0 Cash Outflow -2,016,400
1 $375,050 375,050 -1641350
2 $467,050 842,100 -1174300
3 $394,050 1,236,150 -780,250
4 $347,050 1,583,200 -433,200
5 $321,050 1,904,250 -112,150
6 $321,050 2,225,300 208,900
7 $321,050 2,546,350 529,950
8 $1,431,450 3,977,800 1,961,400
Payback=5 years + = 5.35 years
2.3.3. Internal Rate of Return (IRR)
IRR refers to the discounting rate when NPV is Zero (0). For the purpose of this study, the
trial and error method will be used to calculate IRR.
IRR= LDR + ( )*(HDR-LDR)
Note:
LDR= Lower Discounting Rate
HDR= Higher Discounting Rate
NPV of IRR= 0
The NPV at 10 %( LDR) is 456,900.50. Let us try to calculate NPV at 20% (HDR).
NPV at 20% is;
Case Study – Delaware Pipes 8
ECF6010 Business Finance
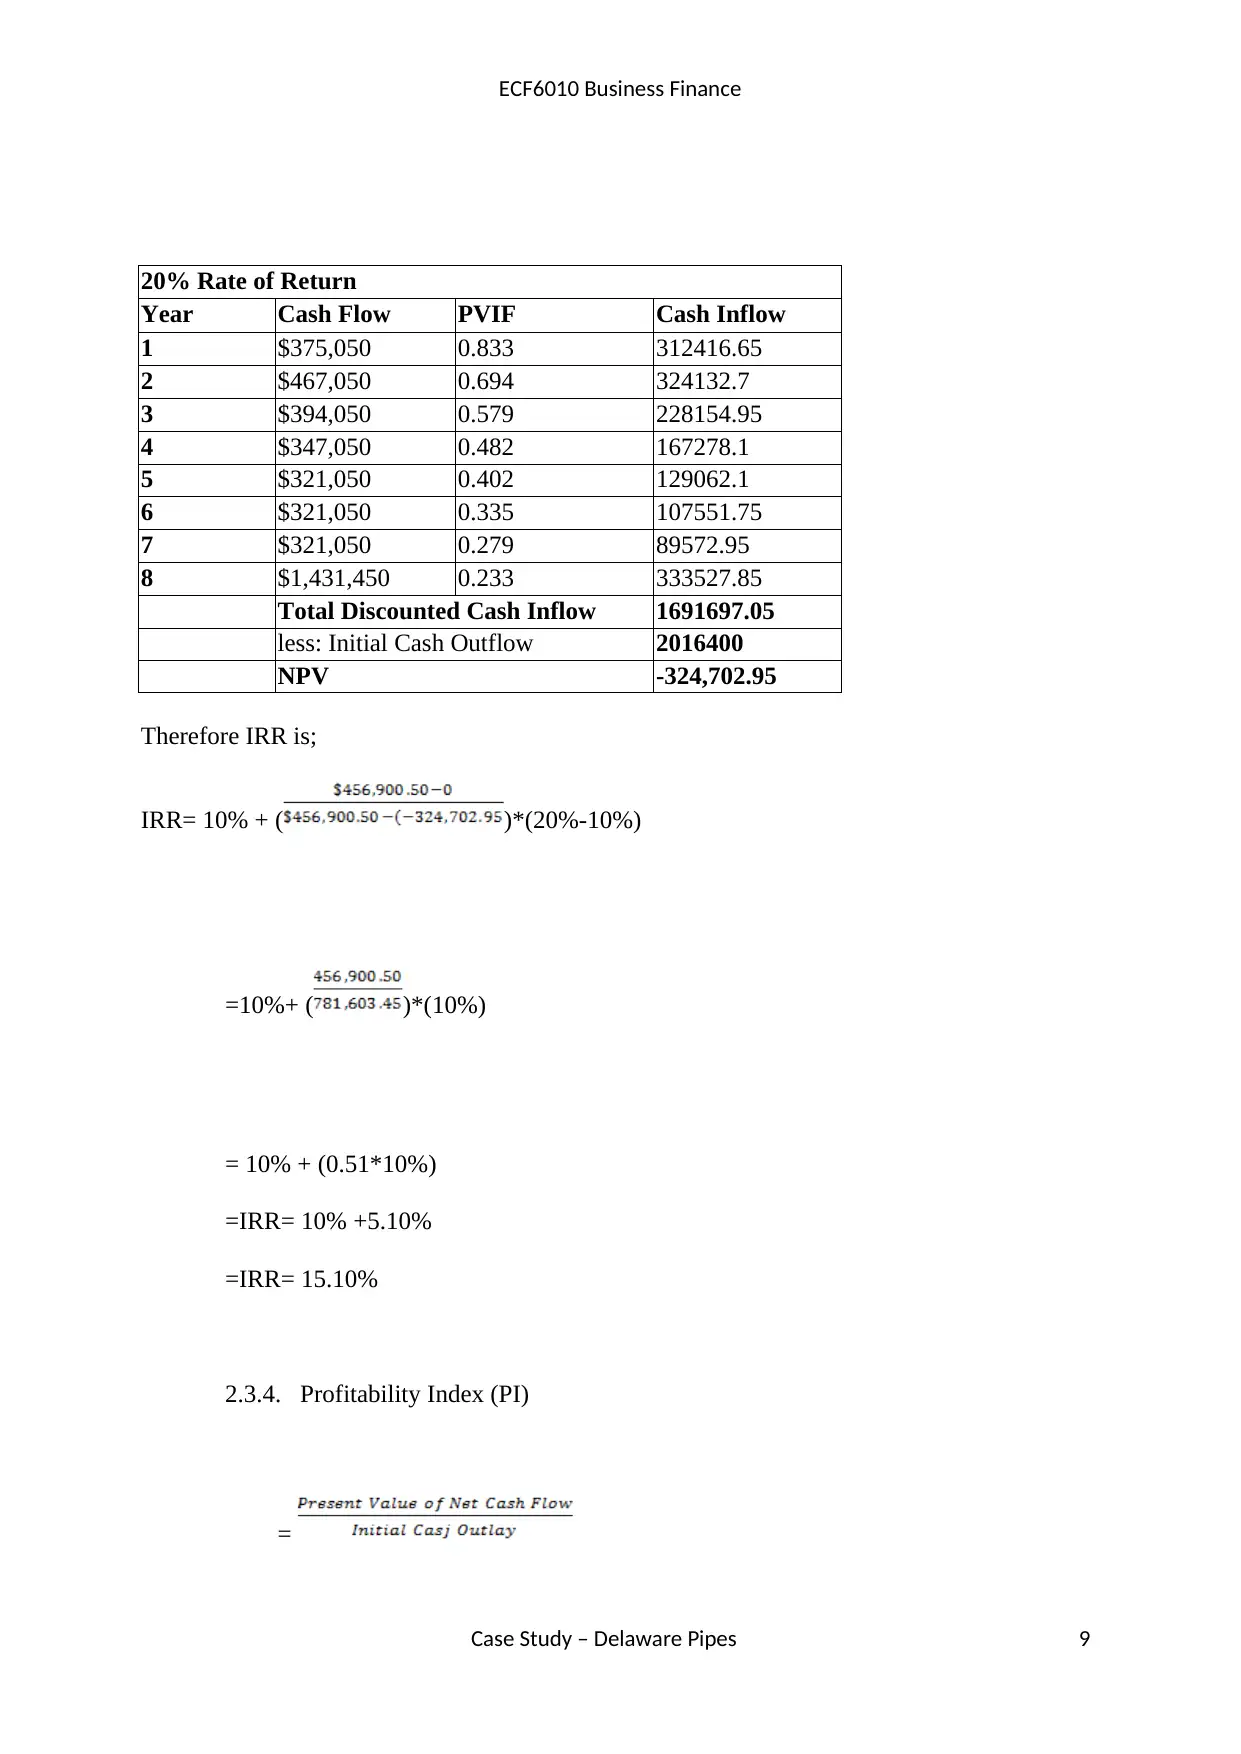
20% Rate of Return
Year Cash Flow PVIF Cash Inflow
1 $375,050 0.833 312416.65
2 $467,050 0.694 324132.7
3 $394,050 0.579 228154.95
4 $347,050 0.482 167278.1
5 $321,050 0.402 129062.1
6 $321,050 0.335 107551.75
7 $321,050 0.279 89572.95
8 $1,431,450 0.233 333527.85
Total Discounted Cash Inflow 1691697.05
less: Initial Cash Outflow 2016400
NPV -324,702.95
Therefore IRR is;
IRR= 10% + ( )*(20%-10%)
=10%+ ( )*(10%)
= 10% + (0.51*10%)
=IRR= 10% +5.10%
=IRR= 15.10%
2.3.4. Profitability Index (PI)
=
Case Study – Delaware Pipes 9
⊘ This is a preview!⊘
Do you want full access?
Subscribe today to unlock all pages.
Trusted by 1+ million students worldwide
ECF6010 Business Finance
= = 1.227
Decision Criteria
According to the NPV, a single propjet should be accepted or rejected is the NPV is
greater than zero or less than zero respectively. In this case, the NPV is $ 456,900.50 hence
the new plant should be accepted.
According to Payback Period, a single project should be accepted if the period
obtained is below or equal to the one set by the management. The company’s payback period
is 5 years. However, it would take approximately 5 years and 4 months for the company to
recover the initial cash outlay. Under strict adherence to the desired payback period, the
project should be rejected. However, four months is a shorter period and the project should be
accepted (Deegan, 1960 2013).
According to the IRR technique, the projected should be accepted if the IRR is greater
than the cost of capital. In this case, the IRR is 15.1% while the Cost of Capital is 10%.
Therefore the project should be accepted.
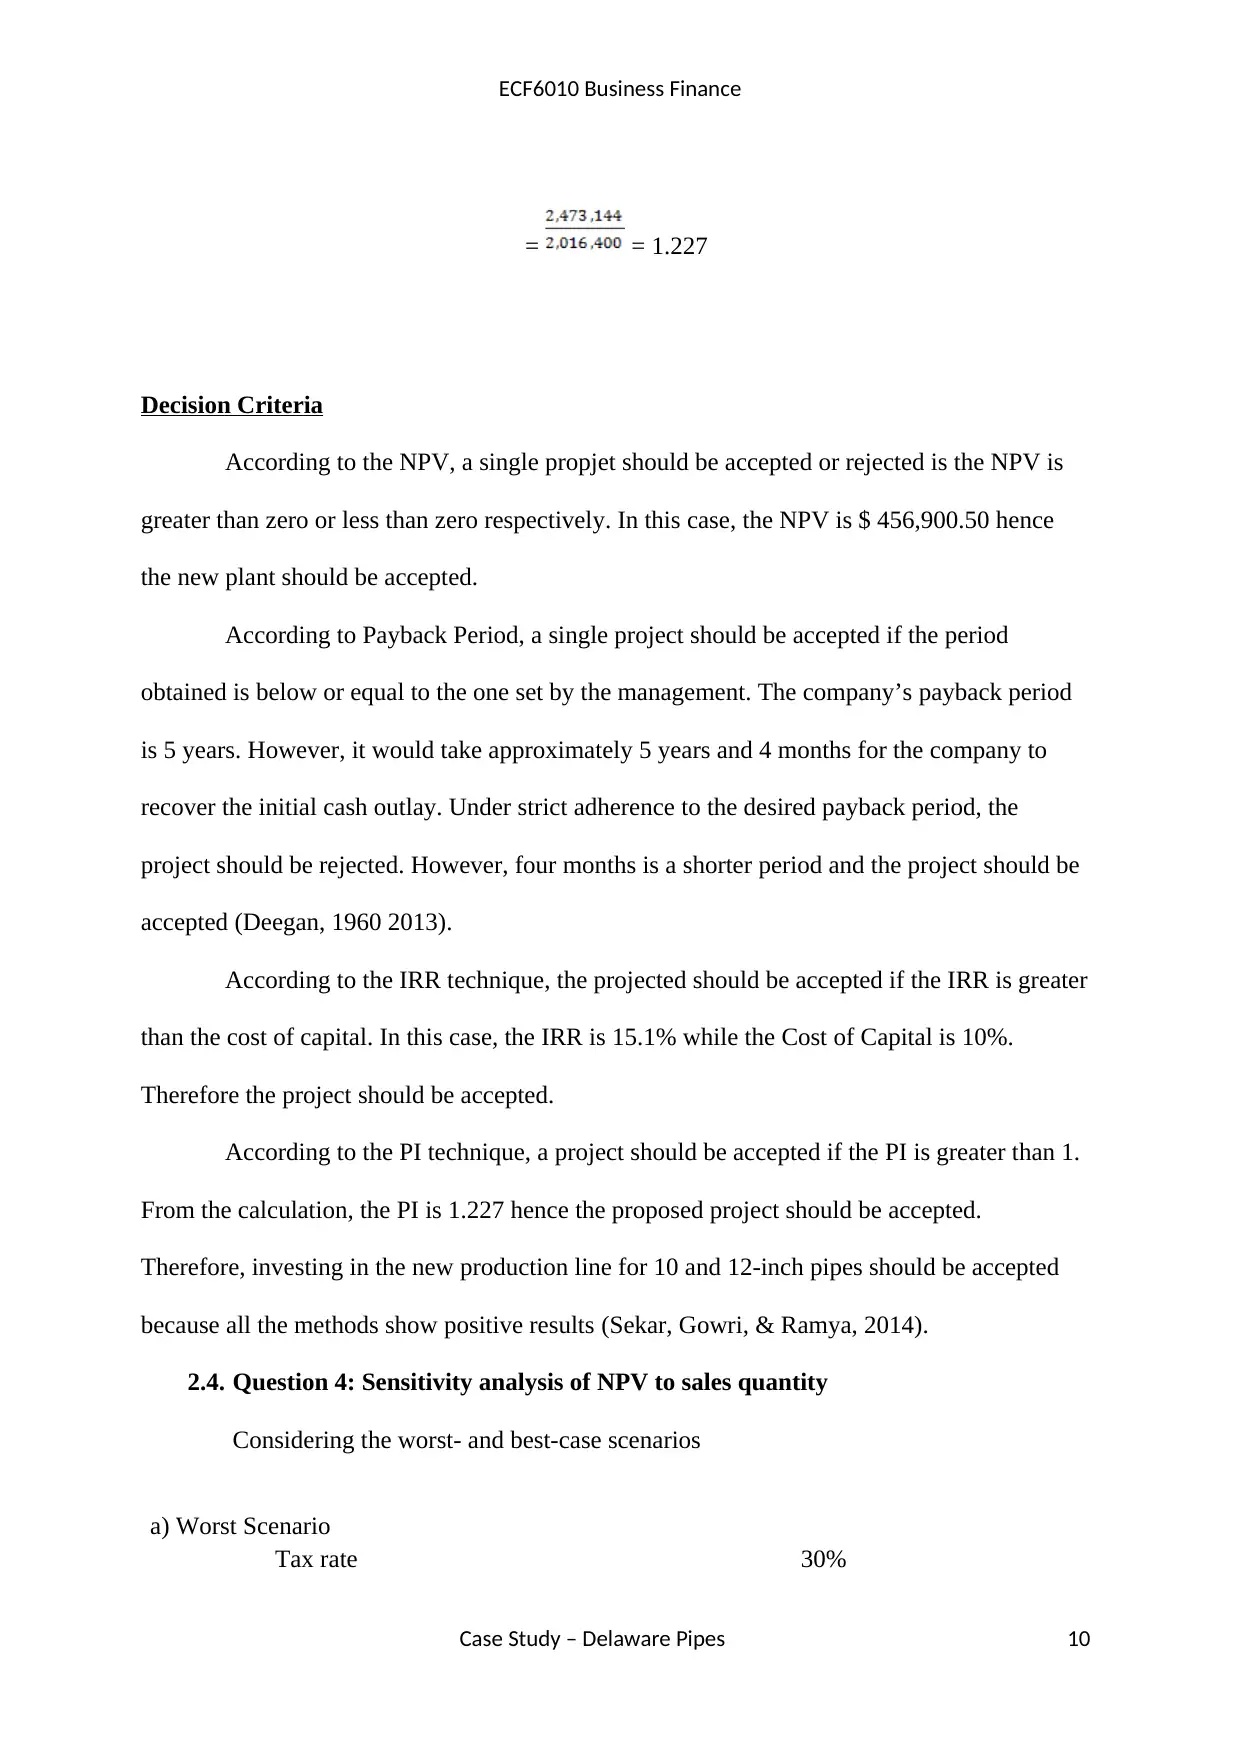
According to the PI technique, a project should be accepted if the PI is greater than 1.
From the calculation, the PI is 1.227 hence the proposed project should be accepted.
Therefore, investing in the new production line for 10 and 12-inch pipes should be accepted
because all the methods show positive results (Sekar, Gowri, & Ramya, 2014).
2.4. Question 4: Sensitivity analysis of NPV to sales quantity
Considering the worst- and best-case scenarios
a) Worst Scenario
Tax rate 30%
Case Study – Delaware Pipes 10
= = 1.227
Decision Criteria
According to the NPV, a single propjet should be accepted or rejected is the NPV is
greater than zero or less than zero respectively. In this case, the NPV is $ 456,900.50 hence
the new plant should be accepted.
According to Payback Period, a single project should be accepted if the period
obtained is below or equal to the one set by the management. The company’s payback period
is 5 years. However, it would take approximately 5 years and 4 months for the company to
recover the initial cash outlay. Under strict adherence to the desired payback period, the
project should be rejected. However, four months is a shorter period and the project should be
accepted (Deegan, 1960 2013).
According to the IRR technique, the projected should be accepted if the IRR is greater
than the cost of capital. In this case, the IRR is 15.1% while the Cost of Capital is 10%.
Therefore the project should be accepted.
According to the PI technique, a project should be accepted if the PI is greater than 1.
From the calculation, the PI is 1.227 hence the proposed project should be accepted.
Therefore, investing in the new production line for 10 and 12-inch pipes should be accepted
because all the methods show positive results (Sekar, Gowri, & Ramya, 2014).
2.4. Question 4: Sensitivity analysis of NPV to sales quantity
Considering the worst- and best-case scenarios
a) Worst Scenario
Tax rate 30%
Case Study – Delaware Pipes 10
Paraphrase This Document
Need a fresh take? Get an instant paraphrase of this document with our AI Paraphraser
ECF6010 Business Finance
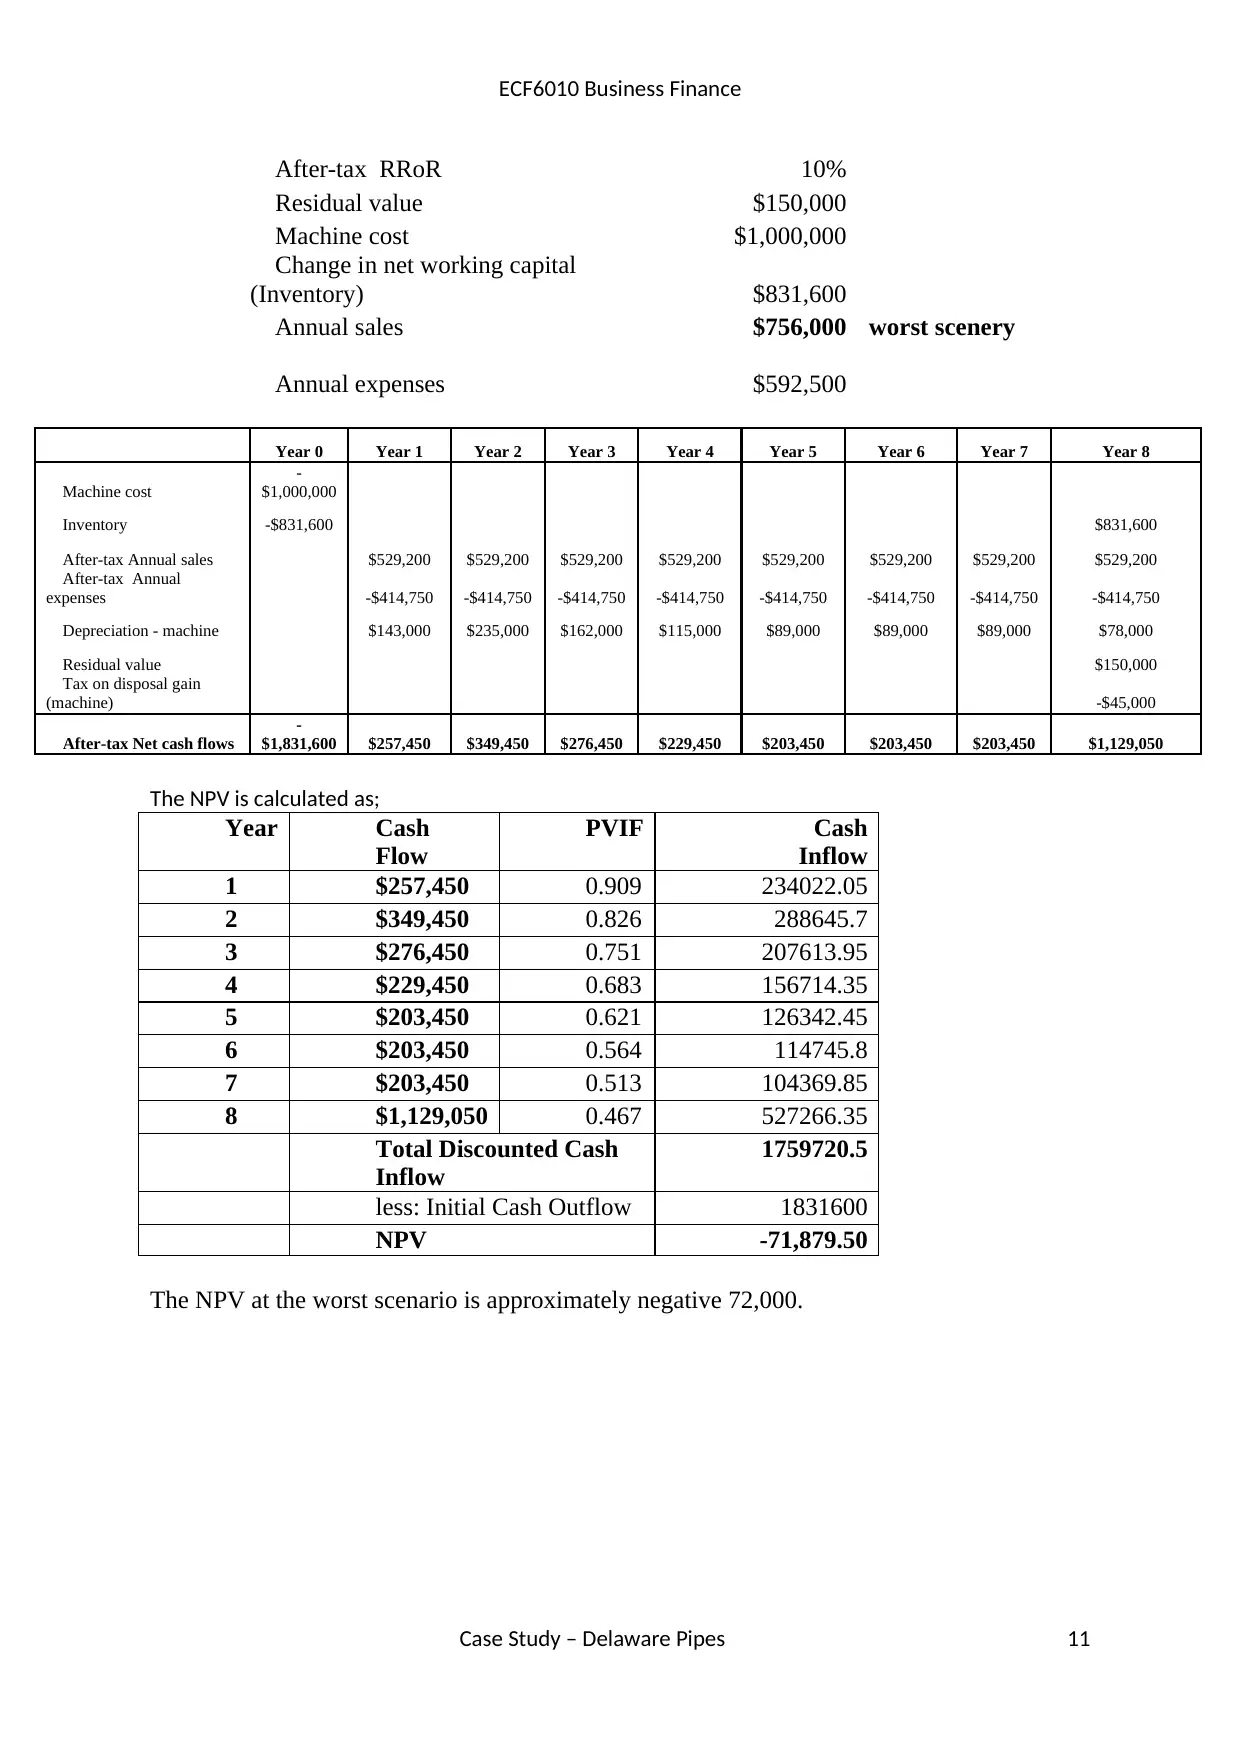
After-tax RRoR 10%
Residual value $150,000
Machine cost $1,000,000
Change in net working capital
(Inventory) $831,600
Annual sales $756,000 worst scenery
Annual expenses $592,500
Year 0 Year 1 Year 2 Year 3 Year 4 Year 5 Year 6 Year 7 Year 8
Machine cost
-
$1,000,000
Inventory -$831,600 $831,600
After-tax Annual sales $529,200 $529,200 $529,200 $529,200 $529,200 $529,200 $529,200 $529,200
After-tax Annual
expenses -$414,750 -$414,750 -$414,750 -$414,750 -$414,750 -$414,750 -$414,750 -$414,750
Depreciation - machine $143,000 $235,000 $162,000 $115,000 $89,000 $89,000 $89,000 $78,000
Residual value $150,000
Tax on disposal gain
(machine) -$45,000
After-tax Net cash flows
-
$1,831,600 $257,450 $349,450 $276,450 $229,450 $203,450 $203,450 $203,450 $1,129,050
The NPV is calculated as;
Year Cash
Flow
PVIF Cash
Inflow
1 $257,450 0.909 234022.05
2 $349,450 0.826 288645.7
3 $276,450 0.751 207613.95
4 $229,450 0.683 156714.35
5 $203,450 0.621 126342.45
6 $203,450 0.564 114745.8
7 $203,450 0.513 104369.85
8 $1,129,050 0.467 527266.35
Total Discounted Cash
Inflow
1759720.5
less: Initial Cash Outflow 1831600
NPV -71,879.50
The NPV at the worst scenario is approximately negative 72,000.
Case Study – Delaware Pipes 11
ECF6010 Business Finance
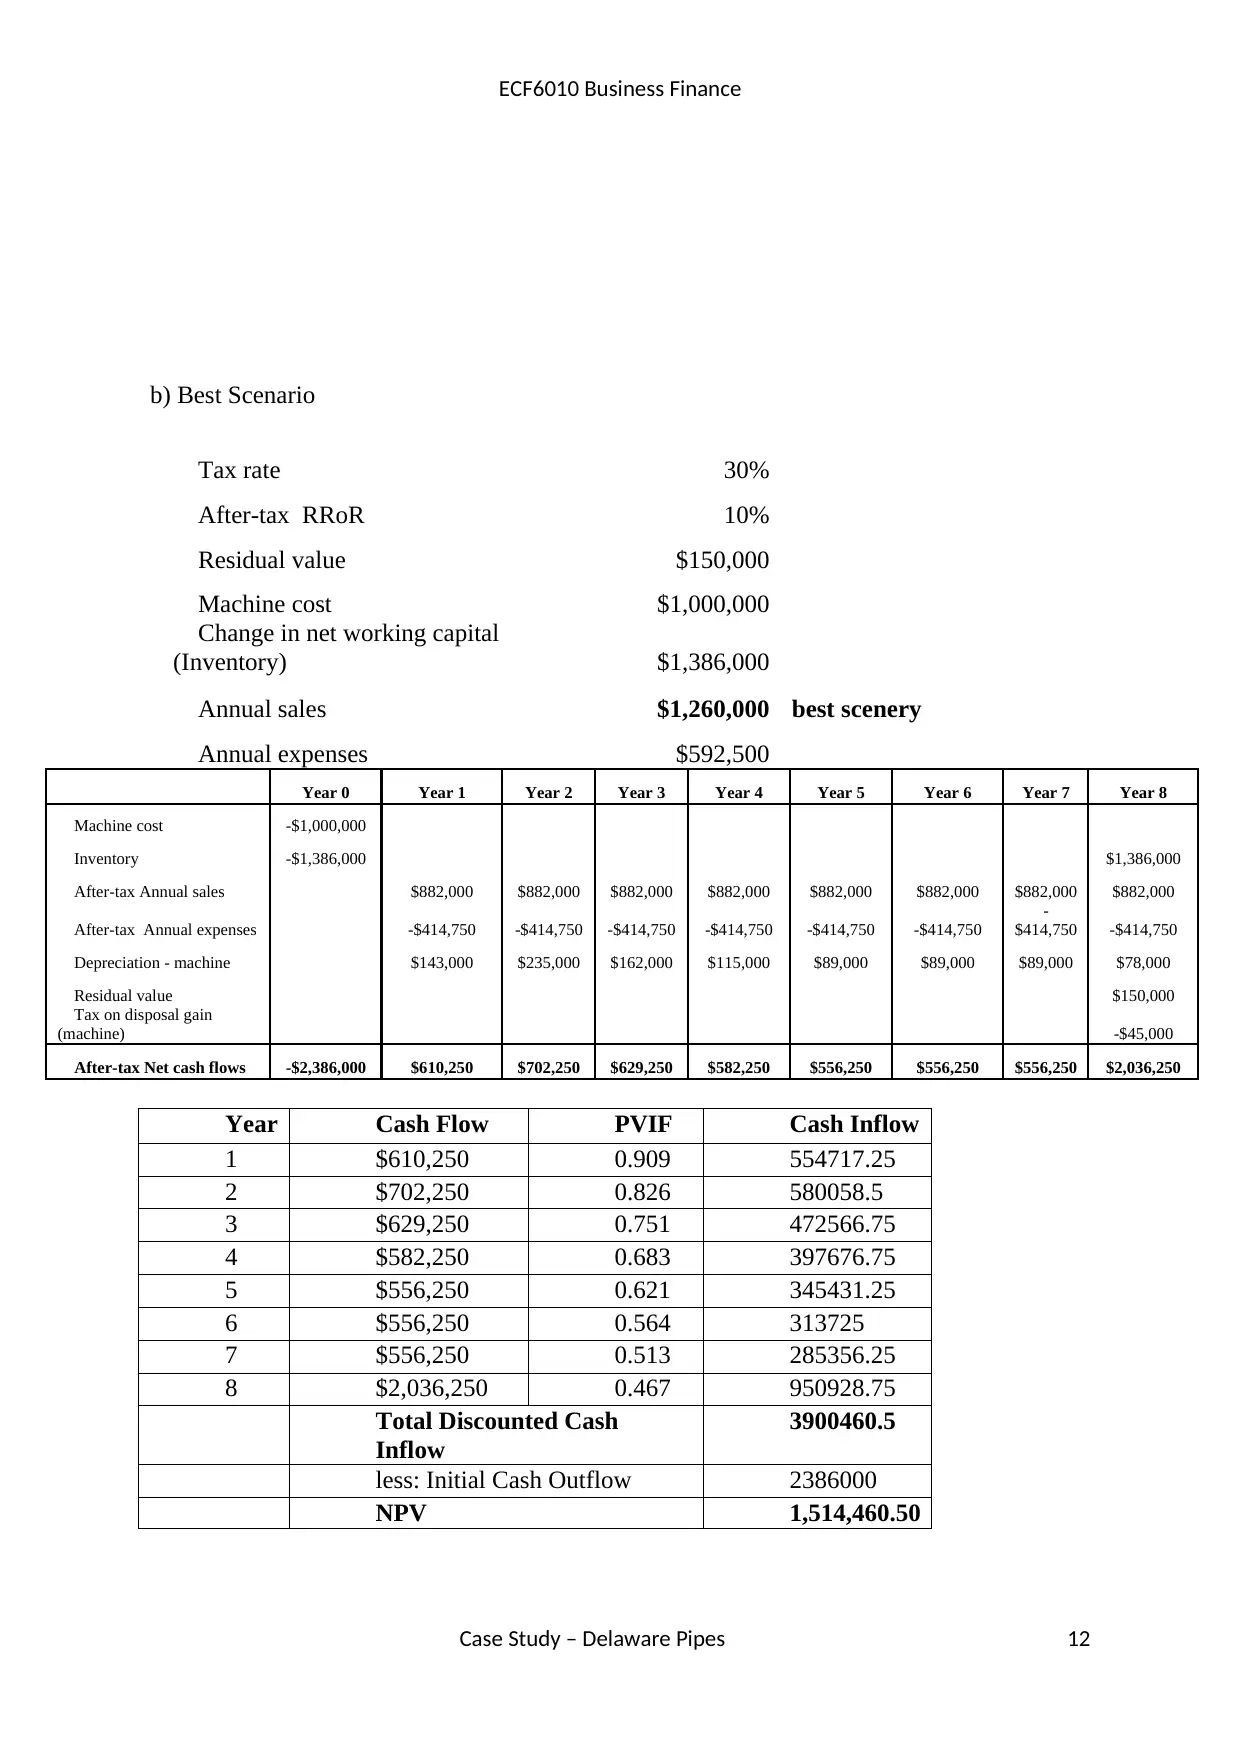
b) Best Scenario
Tax rate 30%
After-tax RRoR 10%
Residual value $150,000
Machine cost $1,000,000
Change in net working capital
(Inventory) $1,386,000
Annual sales $1,260,000 best scenery
Annual expenses $592,500
Year 0 Year 1 Year 2 Year 3 Year 4 Year 5 Year 6 Year 7 Year 8
Machine cost -$1,000,000
Inventory -$1,386,000 $1,386,000
After-tax Annual sales $882,000 $882,000 $882,000 $882,000 $882,000 $882,000 $882,000 $882,000
After-tax Annual expenses -$414,750 -$414,750 -$414,750 -$414,750 -$414,750 -$414,750
-
$414,750 -$414,750
Depreciation - machine $143,000 $235,000 $162,000 $115,000 $89,000 $89,000 $89,000 $78,000
Residual value $150,000
Tax on disposal gain
(machine) -$45,000
After-tax Net cash flows -$2,386,000 $610,250 $702,250 $629,250 $582,250 $556,250 $556,250 $556,250 $2,036,250
Year Cash Flow PVIF Cash Inflow
1 $610,250 0.909 554717.25
2 $702,250 0.826 580058.5
3 $629,250 0.751 472566.75
4 $582,250 0.683 397676.75
5 $556,250 0.621 345431.25
6 $556,250 0.564 313725
7 $556,250 0.513 285356.25
8 $2,036,250 0.467 950928.75
Total Discounted Cash
Inflow
3900460.5
less: Initial Cash Outflow 2386000
NPV 1,514,460.50
Case Study – Delaware Pipes 12
⊘ This is a preview!⊘
Do you want full access?
Subscribe today to unlock all pages.
Trusted by 1+ million students worldwide
1 out of 18
Related Documents


Your All-in-One AI-Powered Toolkit for Academic Success.
+13062052269
info@desklib.com
Available 24*7 on WhatsApp / Email
![[object Object]](/_next/static/media/star-bottom.7253800d.svg)
Unlock your academic potential
Copyright © 2020–2026 A2Z Services. All Rights Reserved. Developed and managed by ZUCOL.