Economics Assignment: Application of Economic Concepts and Theories
VerifiedAdded on 2020/05/03
|10
|1476
|85
Homework Assignment
AI Summary
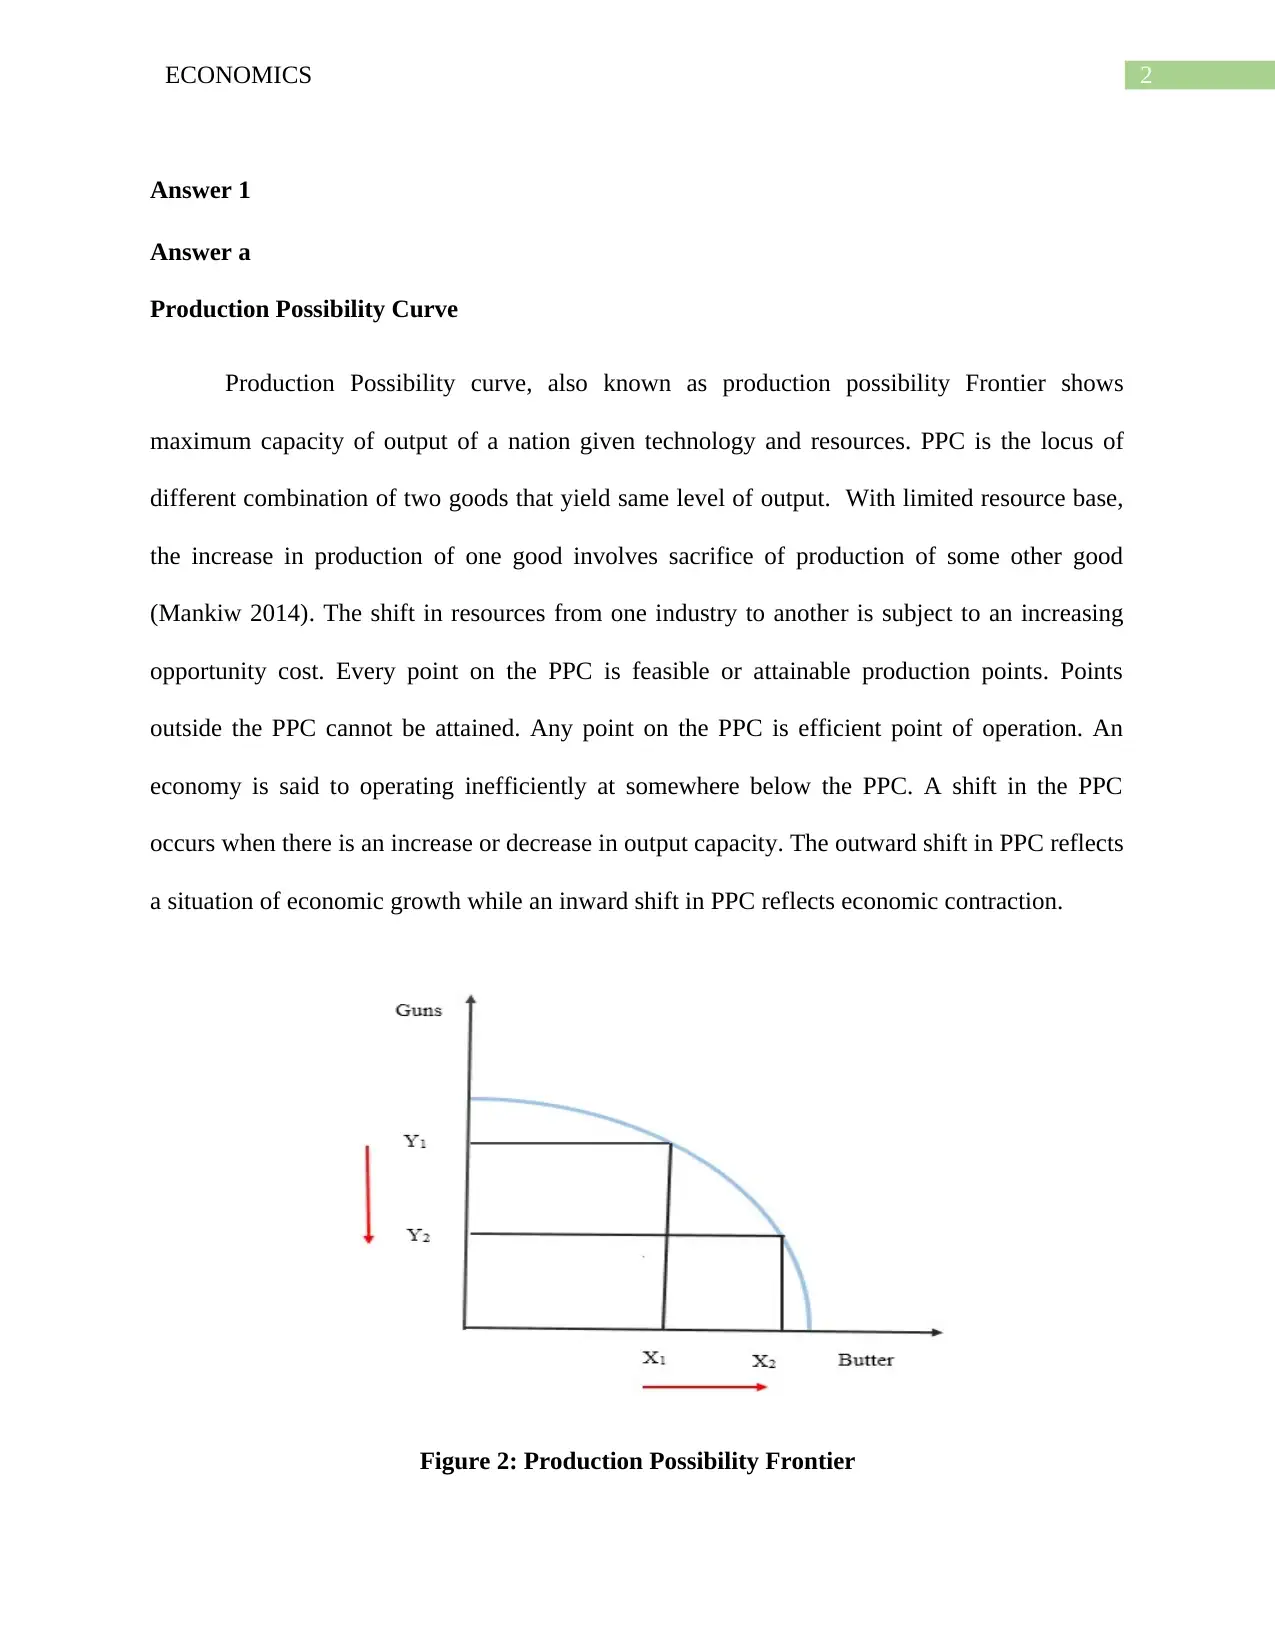
This economics assignment provides a comprehensive analysis of fundamental microeconomic principles. It begins with an exploration of the Production Possibility Curve (PPC), explaining its shape, shifts, and the concept of opportunity cost. The assignment then delves into the concept of margin, highlighting its importance in various economic contexts such as utility, production, and cost. The second part of the assignment focuses on demand and supply, differentiating between quantity demanded and demand schedules, and illustrating movements along and shifts in the demand curve. Finally, it examines market equilibrium, excess supply, and excess demand, using diagrams to explain how these forces interact to determine market prices and quantities. The assignment draws on economic theories and provides practical examples to enhance understanding of these core concepts.

Running head: ECONOMICS
Economics
Name of the Student
Name of the University
Author note
Economics
Name of the Student
Name of the University
Author note
Secure Best Marks with AI Grader
Need help grading? Try our AI Grader for instant feedback on your assignments.

1ECONOMICS
Table of Contents
Answer 1..........................................................................................................................................2
Answer a......................................................................................................................................2
Answer b......................................................................................................................................3
Answer c......................................................................................................................................4
Answer 2..........................................................................................................................................4
Answer a......................................................................................................................................4
Answer b......................................................................................................................................5
Answer c......................................................................................................................................6
References........................................................................................................................................9

2ECONOMICS
Answer 1
Answer a
Production Possibility Curve
Production Possibility curve, also known as production possibility Frontier shows
maximum capacity of output of a nation given technology and resources. PPC is the locus of
different combination of two goods that yield same level of output. With limited resource base,
the increase in production of one good involves sacrifice of production of some other good
(Mankiw 2014). The shift in resources from one industry to another is subject to an increasing
opportunity cost. Every point on the PPC is feasible or attainable production points. Points
outside the PPC cannot be attained. Any point on the PPC is efficient point of operation. An
economy is said to operating inefficiently at somewhere below the PPC. A shift in the PPC
occurs when there is an increase or decrease in output capacity. The outward shift in PPC reflects
a situation of economic growth while an inward shift in PPC reflects economic contraction.
Figure 2: Production Possibility Frontier

3ECONOMICS
(Source: as created by Author)
Because of the presence of increasing opportunity cost Production Possibility Curve is in
Concave shape. Suppose the economy produces two goods Butter and Guns using all of its
resources. In order to increase production of butter from X1 to X2 the economy has to produce
less guns as shown from a decline in guns production from Y1 to Y2. This is the idea of
Production Possibility Curve.
Answer b
Opportunity Cost
The concept of opportunity cost in economics is derived from the idea that limited
resources are available to fulfill unlimited want of people. That is the economy always faces
problem of scarcity. Every choice of people involve an opportunity cost. Opportunity cost is
described as the cost of sacrificing something in order to make a particular choice. Alternatively,
it can also be defined as the imputed value of second best alternative. People have many
available alternatives while deciding over spending their money income. Everybody has 24 hours
in a day. However, different people allocate their times differently. These decisions depend on
opportunity cost. The opportunity cost arises because of the tradeoff that economic agents face.
There is nothing called free lunch in the economy. In the world full of wants and limited
resources, everything comes with an opportunity cost. Suppose an individual has a plot of land.
In that land, either paddy or wheat can be produced. If the individual chose to produce wheat
then production of paddy and income from it is sacrificed. Here, the opportunity cost of wheat
production is the sacrificed production of paddy. An application of the concept of opportunity
cost is in the construction of Production Possibility Curve. The increase in production of one
good within the boundary of PPC needs to sacrifice production of others.
Secure Best Marks with AI Grader
Need help grading? Try our AI Grader for instant feedback on your assignments.

4ECONOMICS
Answer c
Margin Meaning
The concept of margin holds great importance in economics. In its most simple form, the
term ‘Marginal’ refers to something extra. The marginal quantity of a factor of production or any
output is the recorded extra unit of that factor or output. The term is associate with many
important concept of economics such as in utility, production and cost. The marginal utility of an
item is the additional utility derived when an addition unit of that item is consumed. Marginal
cost refers to additional cost generated from unit change in output. Marginal production is the
unit change in total production due to the unit change in factor input (Fine 2016). Similarly, the
concept of marginal revenue, marginal profits are used to take important economic decision.
There are numerous applications of the concept of margins in economics. Consumers’
willingness to pay for a particular unit of a good depends on the marginal utility derived from the
good. The minimum price at which suppliers supply their goods depend on the marginal cost of
production. The equilibrium price and output of a profit-maximizing firm is determined at the
point where marginal revenue equals with the marginal cost. Because of the application of this
concept in several fields of economics, it is regarded as one of most valuable economic concept.
Answer 2
Answer a
Quantity demanded and demand schedule
Demand for a good is defined as the desire to get something as supported by the
purchasing power. Quantity demand of a good is particular quantity bough at a particular price.

5ECONOMICS
Demand schedule on the other hand represent a table containing different figures for quantity
demand each corresponds to a particular price. Demand schedule therefore represents a set of
quantity demanded and price.
Quantity demand is obtained for a single price. For obtaining a demand schedule, a set of
price and quantity demanded is required.
From the demand schedule, plotting different price and corresponding quantity demand
curve for the good is derived. However, from a single quantity demanded it is not possible to
obtain the demand curve.
Answer b
Movement along the demand curve and Shifts in the demand curve
Figure 2: Movement along the demand curve and shift in the demand curve

6ECONOMICS
(Source: As created by Author)
Demand curve shows the relation between price and quantity demanded of a commodity.
A change in price likely to affect the demand curve inversely. When price of a commodity
increases, then it becomes costly to purchase the good. As a result, demand decreases.
Conversely, when price decreases then cost of purchasing the commodity decreases. This leads
to an increase in the quantity demanded. The change in demand due to change in price is
captured by the movement along the demand curve.
This is shown in panel (a) of figure 2. The demand curve is DD. When price is P1, then
demand is Q1. Corresponding point on the demand curve is A. Now consider, a fall in price from
P1 to P2. With a decrease in price quantity demanded increase from Q1 to Q2. Corresponding
point on the demand curve shifts from A to B.
In addition to price, demand of a commodity depends on a number of other factors such
as income, taste and preferences, price of related goods and others. Change in any factor except
price causes a shift in the demand curve. For example, when income increases then purchasing
power also increases. This causes an outward shift in the demand curve. A decrease in income
causes a leftward shift of the demand curve. Similarly, changes in taste and preferences or
change in price of substitutes or complementary goods causes a shift in the demand curve.
Answer c
Equilibrium, Excess Supply and Excess Demand
Demand captures willingness of the buyers to purchase a commodity. Supply measures
the willingness of suppliers to supply the good. The two forces of demand and supply interact in
Paraphrase This Document
Need a fresh take? Get an instant paraphrase of this document with our AI Paraphraser

7ECONOMICS
the market and determine price and quantity. Equilibrium in the market occurs at a point where
demand and supply matches.
Figure 3: Equilibrium in the market of commodity X
(Source: As created by author)
DD curve shows demand of commodity X. SS curve is the corresponding supply curve.
Equilibrium point in the market is E. Corresponding to E, the equilibrium price is obtained as P*
and equilibrium quantity is Q*.

8ECONOMICS
P1 is a price above the equilibrium price. At this price, quantity demand is Q1D and
quantity supplied is Q1S. As the quantity supplied exceeds the quantity demanded an excess
supply of (Q1S – Q1D) is found to exist in the market.
P2 is a price below the equilibrium price. At this price, Quantity demanded is Q2D and
Quantity supplied is Q2S. Here, Quantity demanded exceeds the quantity supplied resulting in an
excess demand of (Q2D – Q2S).

9ECONOMICS
References
Fine, B., 2016. Microeconomics. University of Chicago Press Economics Books.
Mankiw, N.G., 2014. Principles of macroeconomics. Cengage Learning.
References
Fine, B., 2016. Microeconomics. University of Chicago Press Economics Books.
Mankiw, N.G., 2014. Principles of macroeconomics. Cengage Learning.
1 out of 10
Related Documents

Your All-in-One AI-Powered Toolkit for Academic Success.
+13062052269
info@desklib.com
Available 24*7 on WhatsApp / Email
Unlock your academic potential
© 2024 | Zucol Services PVT LTD | All rights reserved.