ECON 5: Individual Project - Production Possibility Frontier Analysis
VerifiedAdded on 2022/08/17
|7
|1174
|12
Project
AI Summary
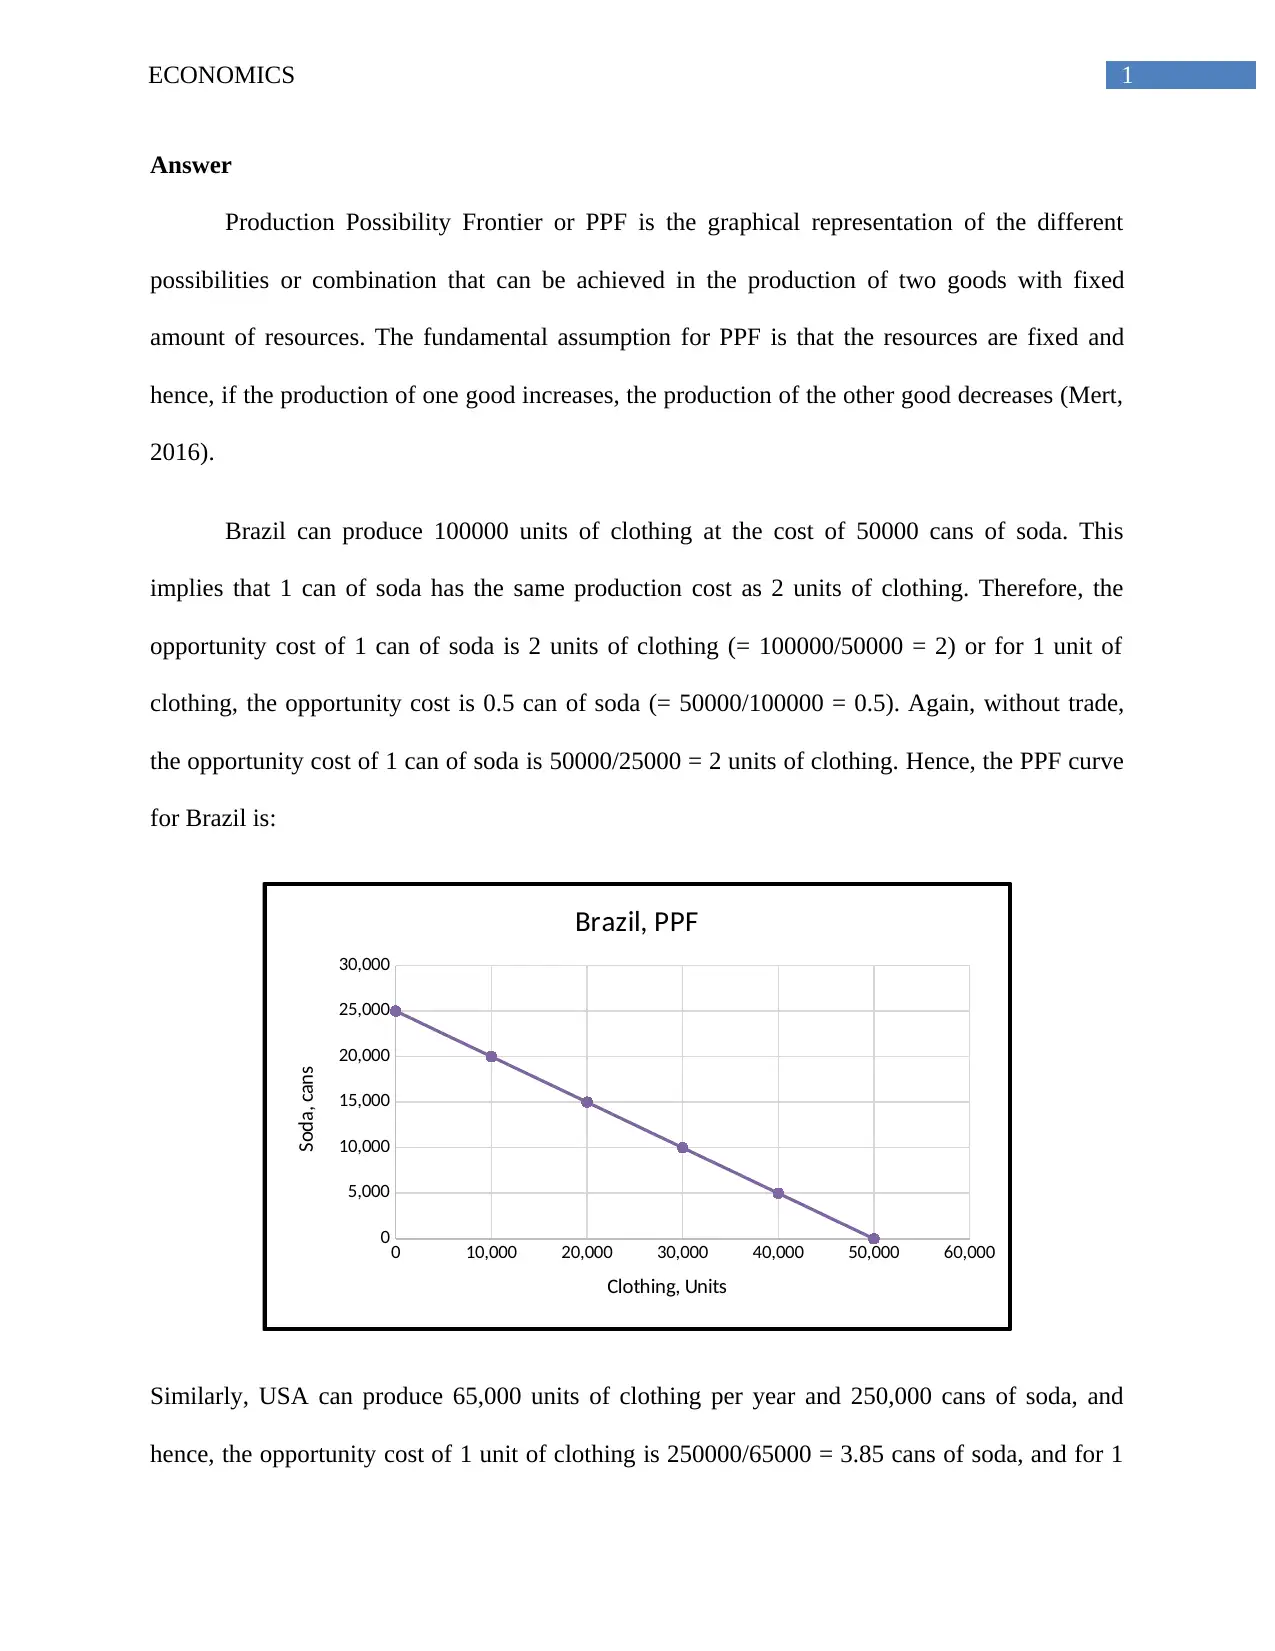
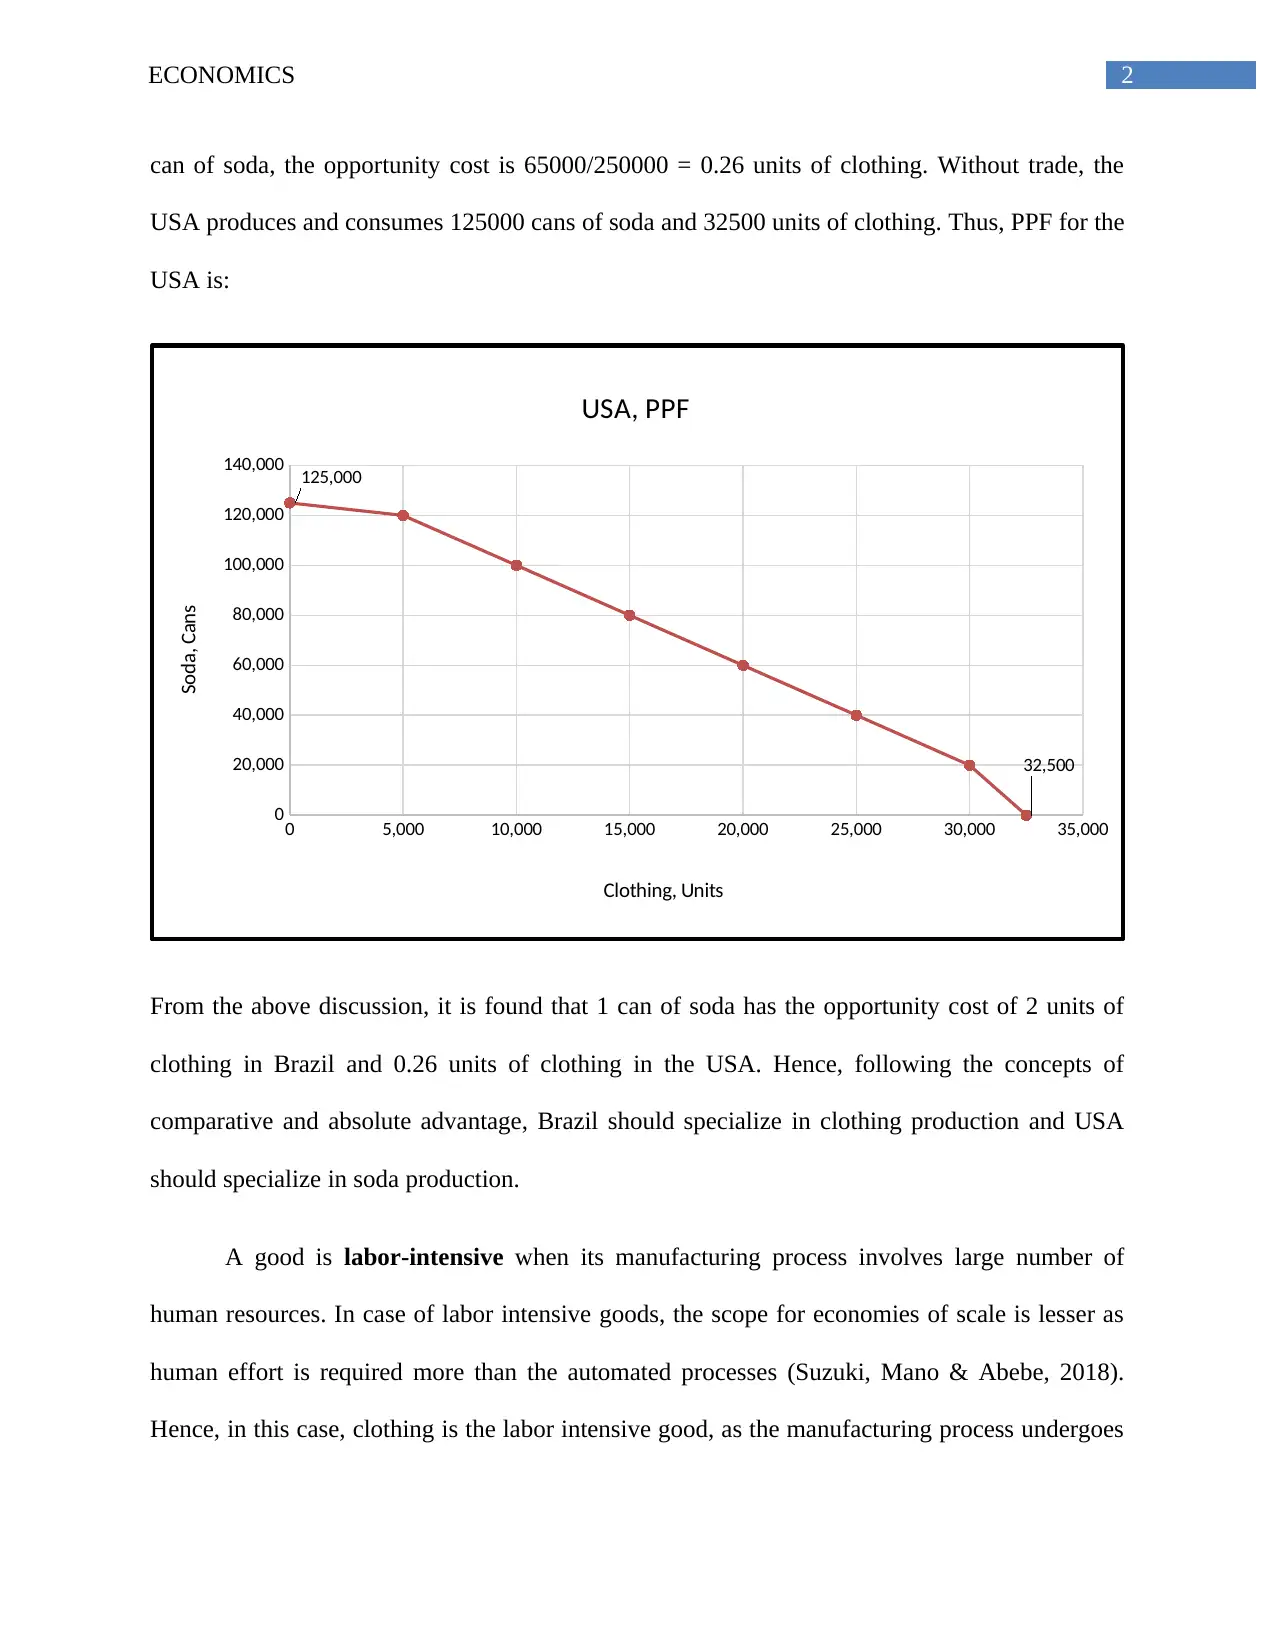
This economics project analyzes the production possibility frontiers (PPF) for Brazil and the United States, considering their production capacities for clothing and soda. The assignment calculates opportunity costs, determines comparative advantages, and illustrates the PPF graphically for each countr...
Read More
Contribute Materials
Your contribution can guide someone’s learning journey. Share your
documents today.

Running head: ECONOMICS
Economics
Name of the Student:
Name of the University:
Author note:
Economics
Name of the Student:
Name of the University:
Author note:
Secure Best Marks with AI Grader
Need help grading? Try our AI Grader for instant feedback on your assignments.

1ECONOMICS
Answer
Production Possibility Frontier or PPF is the graphical representation of the different
possibilities or combination that can be achieved in the production of two goods with fixed
amount of resources. The fundamental assumption for PPF is that the resources are fixed and
hence, if the production of one good increases, the production of the other good decreases (Mert,
2016).
Brazil can produce 100000 units of clothing at the cost of 50000 cans of soda. This
implies that 1 can of soda has the same production cost as 2 units of clothing. Therefore, the
opportunity cost of 1 can of soda is 2 units of clothing (= 100000/50000 = 2) or for 1 unit of
clothing, the opportunity cost is 0.5 can of soda (= 50000/100000 = 0.5). Again, without trade,
the opportunity cost of 1 can of soda is 50000/25000 = 2 units of clothing. Hence, the PPF curve
for Brazil is:
0 10,000 20,000 30,000 40,000 50,000 60,000
0
5,000
10,000
15,000
20,000
25,000
30,000
Brazil, PPF
Clothing, Units
Soda, cans
Similarly, USA can produce 65,000 units of clothing per year and 250,000 cans of soda, and
hence, the opportunity cost of 1 unit of clothing is 250000/65000 = 3.85 cans of soda, and for 1

2ECONOMICS
can of soda, the opportunity cost is 65000/250000 = 0.26 units of clothing. Without trade, the
USA produces and consumes 125000 cans of soda and 32500 units of clothing. Thus, PPF for the
USA is:
0 5,000 10,000 15,000 20,000 25,000 30,000 35,000
0
20,000
40,000
60,000
80,000
100,000
120,000
140,000 125,000
32,500
USA, PPF
Clothing, Units
Soda, Cans
From the above discussion, it is found that 1 can of soda has the opportunity cost of 2 units of
clothing in Brazil and 0.26 units of clothing in the USA. Hence, following the concepts of
comparative and absolute advantage, Brazil should specialize in clothing production and USA
should specialize in soda production.
A good is labor-intensive when its manufacturing process involves large number of
human resources. In case of labor intensive goods, the scope for economies of scale is lesser as
human effort is required more than the automated processes (Suzuki, Mano & Abebe, 2018).
Hence, in this case, clothing is the labor intensive good, as the manufacturing process undergoes

3ECONOMICS
several stages with specific type of labor at each stage and on the other hand, soda production
undergoes automated production process that has less requirement for manual labor.
Marginal rate of transformation is associated with opportunity cost. Increasing
(decreasing) marginal rate of transformation leads to increasing (decreasing) opportunity cost. As
stated by Sueyoshi & Yuan (2016), marginal rate of transformation is obtained from the ratio of
number of goods sacrificed to number of goods obtained. Hence, in a two economy, this rate is
beneficial for taking the decision of which good to produce and which to sacrifice.
Labor abundant country is the one that has comparatively large number of labor than
other countries, with higher availability of cheap labor and comparative advantage for labor
intensive goods production. According to the Heckscher-Ohlin (H-O) model, in the labor
abundant nations, the capital (K) - labor (L) ratio, that is, K/L is lower, while it is much higher
for the capital intensive nations (Etro, 2017). In case of capital abundant country, the amount
of capital resources is much higher than the labor, and capital provides comparative advantage
for producing capital intensive products. In this case, Brazil is more labour intensive and the
USA is more capital intensive.
International trade has quite a few benefits, and poverty reduction is one of those. A
major way to get the maximum benefit from international trade for the countries is to practice
comparative advantage while producing and exporting products and services (Santos-Paulino,
2017). As highlighted by the World Bank (2018), it has been observed that as more and more
developing countries are participating in the international trade, there has been a sharp decline in
poverty worldwide. As the developing countries constitute around 48% of the total world trade,
the number of people living below poverty line and extreme poverty has come down to almost
Secure Best Marks with AI Grader
Need help grading? Try our AI Grader for instant feedback on your assignments.

4ECONOMICS
half since 1990 which is less than 1 billion people. It has also been observed that the number as
well as quality of jobs in the developing countries has increased significantly due to international
trade, which stimulated the aggregate demand and domestic output, and eventually stimulated the
economic growth of these nations. The developing countries, like, Brazil, are encouraged to
exploit their comparative advantage and produce and export those products more and this helped
them to maintain their trade balance. This also help these countries to exploit their capacity to get
the benefits from trade, and that act as one of the key drivers of economic growth and fall in
poverty. Income distribution through employment generation, and growth in the domestic market
are some major factors that help the developing countries to reduce their poverty level (Islam, Li
& Fatema, 2018).

5ECONOMICS
References
Etro, F. (2017). The Heckscher–Ohlin model with monopolistic competition and general
preferences. Economics Letters, 158, 26-29.
Islam, M. M., Li, Z., & Fatema, F. (2018). The Effects of Trade On Poverty: Does Sectoral
Composition of Trade Matter? Evidence From Emerging Economies. Journal of
Economics and Economic Education Research.
Mert, M. (2016). Measuring economic growth and its relation with production possibility frontier
and returns to scale. International Journal of Economics and Research, 7(6), 75-86.
Santos-Paulino, A. U. (2017). Estimating the impact of trade specialization and trade policy on
poverty in developing countries. The Journal of International Trade & Economic
Development, 26(6), 693-711.
Sueyoshi, T., & Yuan, Y. (2016). Marginal Rate of Transformation and Rate of Substitution
measured by DEA environmental assessment: Comparison among European and North
American nations. Energy Economics, 56, 270-287.
Suzuki, A., Mano, Y., & Abebe, G. (2018). Earnings, savings, and job satisfaction in a labor-
intensive export sector: Evidence from the cut flower industry in Ethiopia. World
Development, 110, 176-191.
World Bank. (2018). The Role of Trade in Ending Poverty. World Bank. Retrieved 4 March
2020, from https://www.worldbank.org/en/topic/trade/publication/the-role-of-trade-in-
ending-poverty.

6ECONOMICS
1 out of 7

Your All-in-One AI-Powered Toolkit for Academic Success.
+13062052269
info@desklib.com
Available 24*7 on WhatsApp / Email
Unlock your academic potential
© 2024 | Zucol Services PVT LTD | All rights reserved.