Analyzing Profitability: Management Accounting Assignment Solution

Verified

Added on  2023/06/03

|5
|635
|173
Homework Assignment
AI Summary
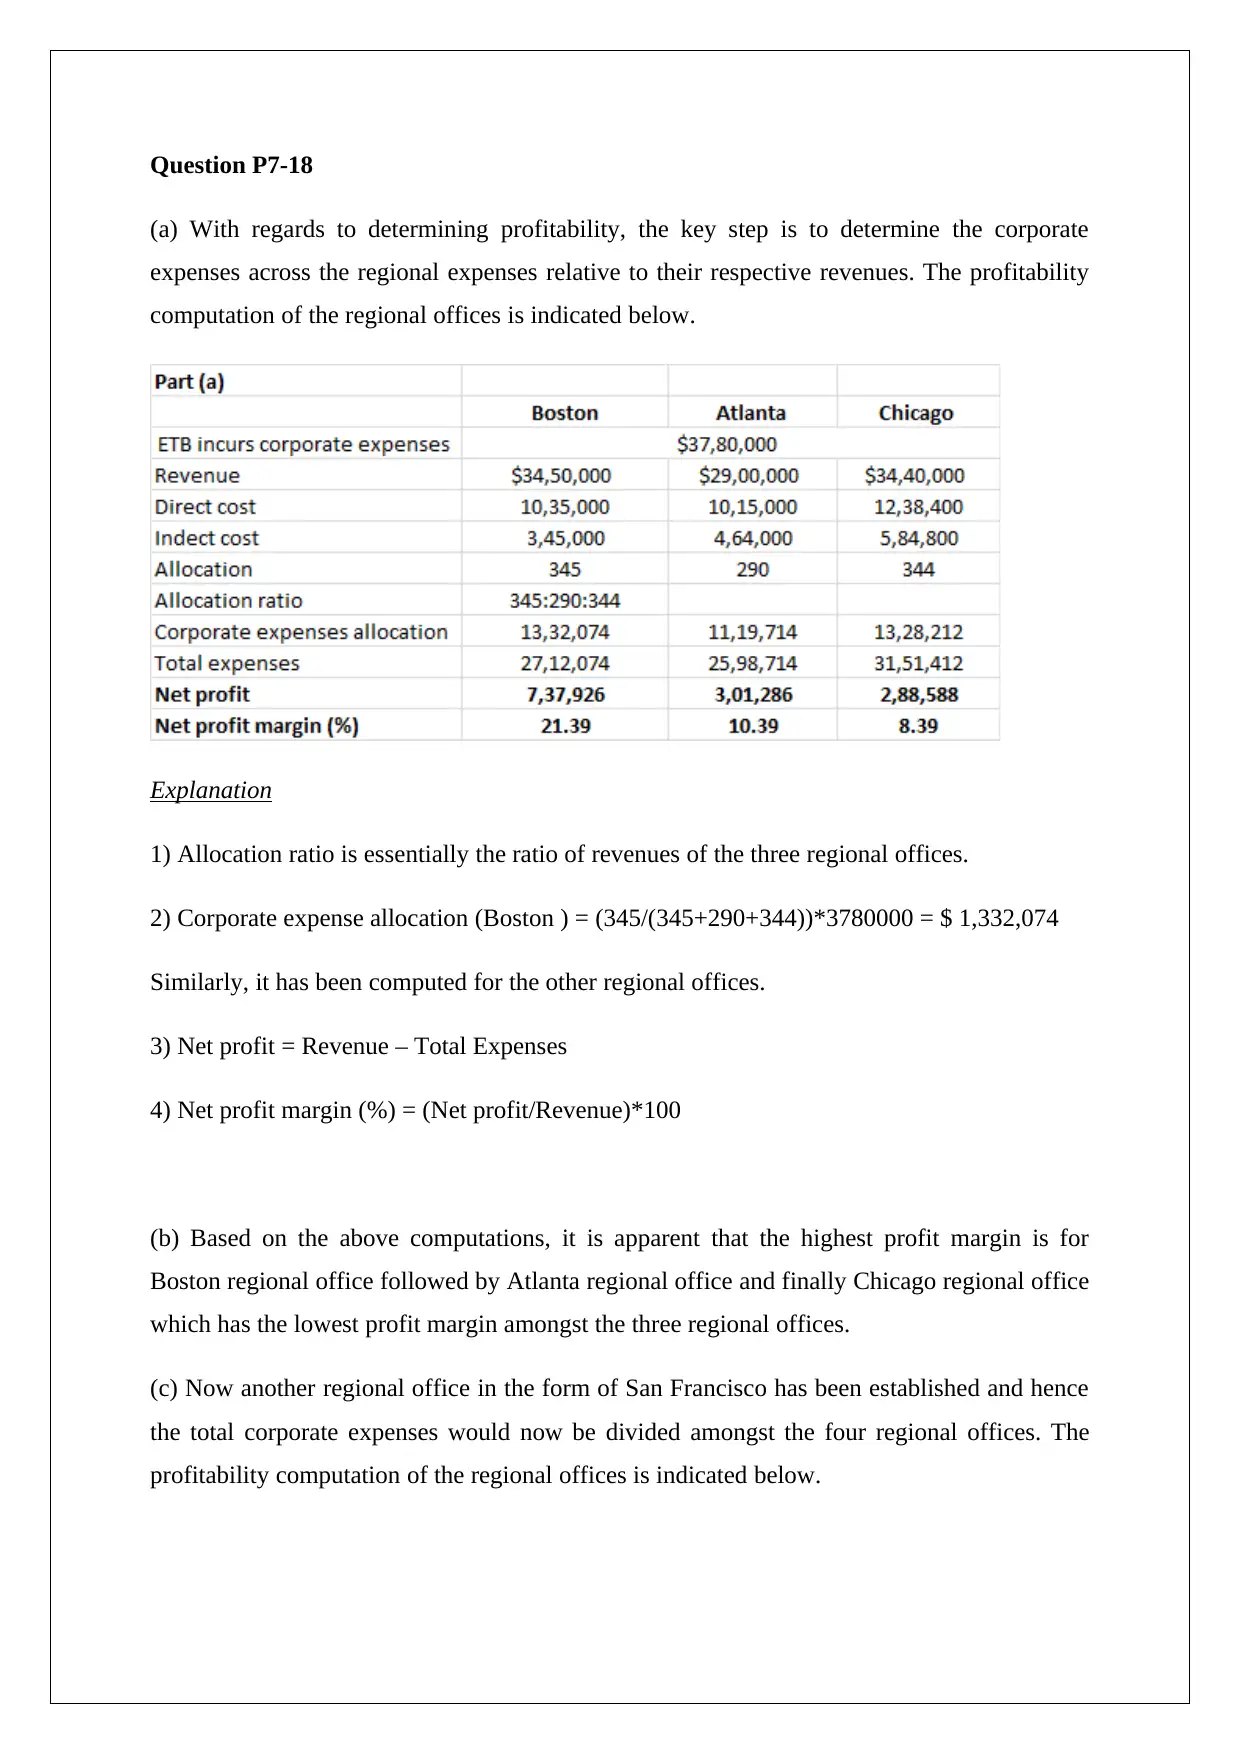
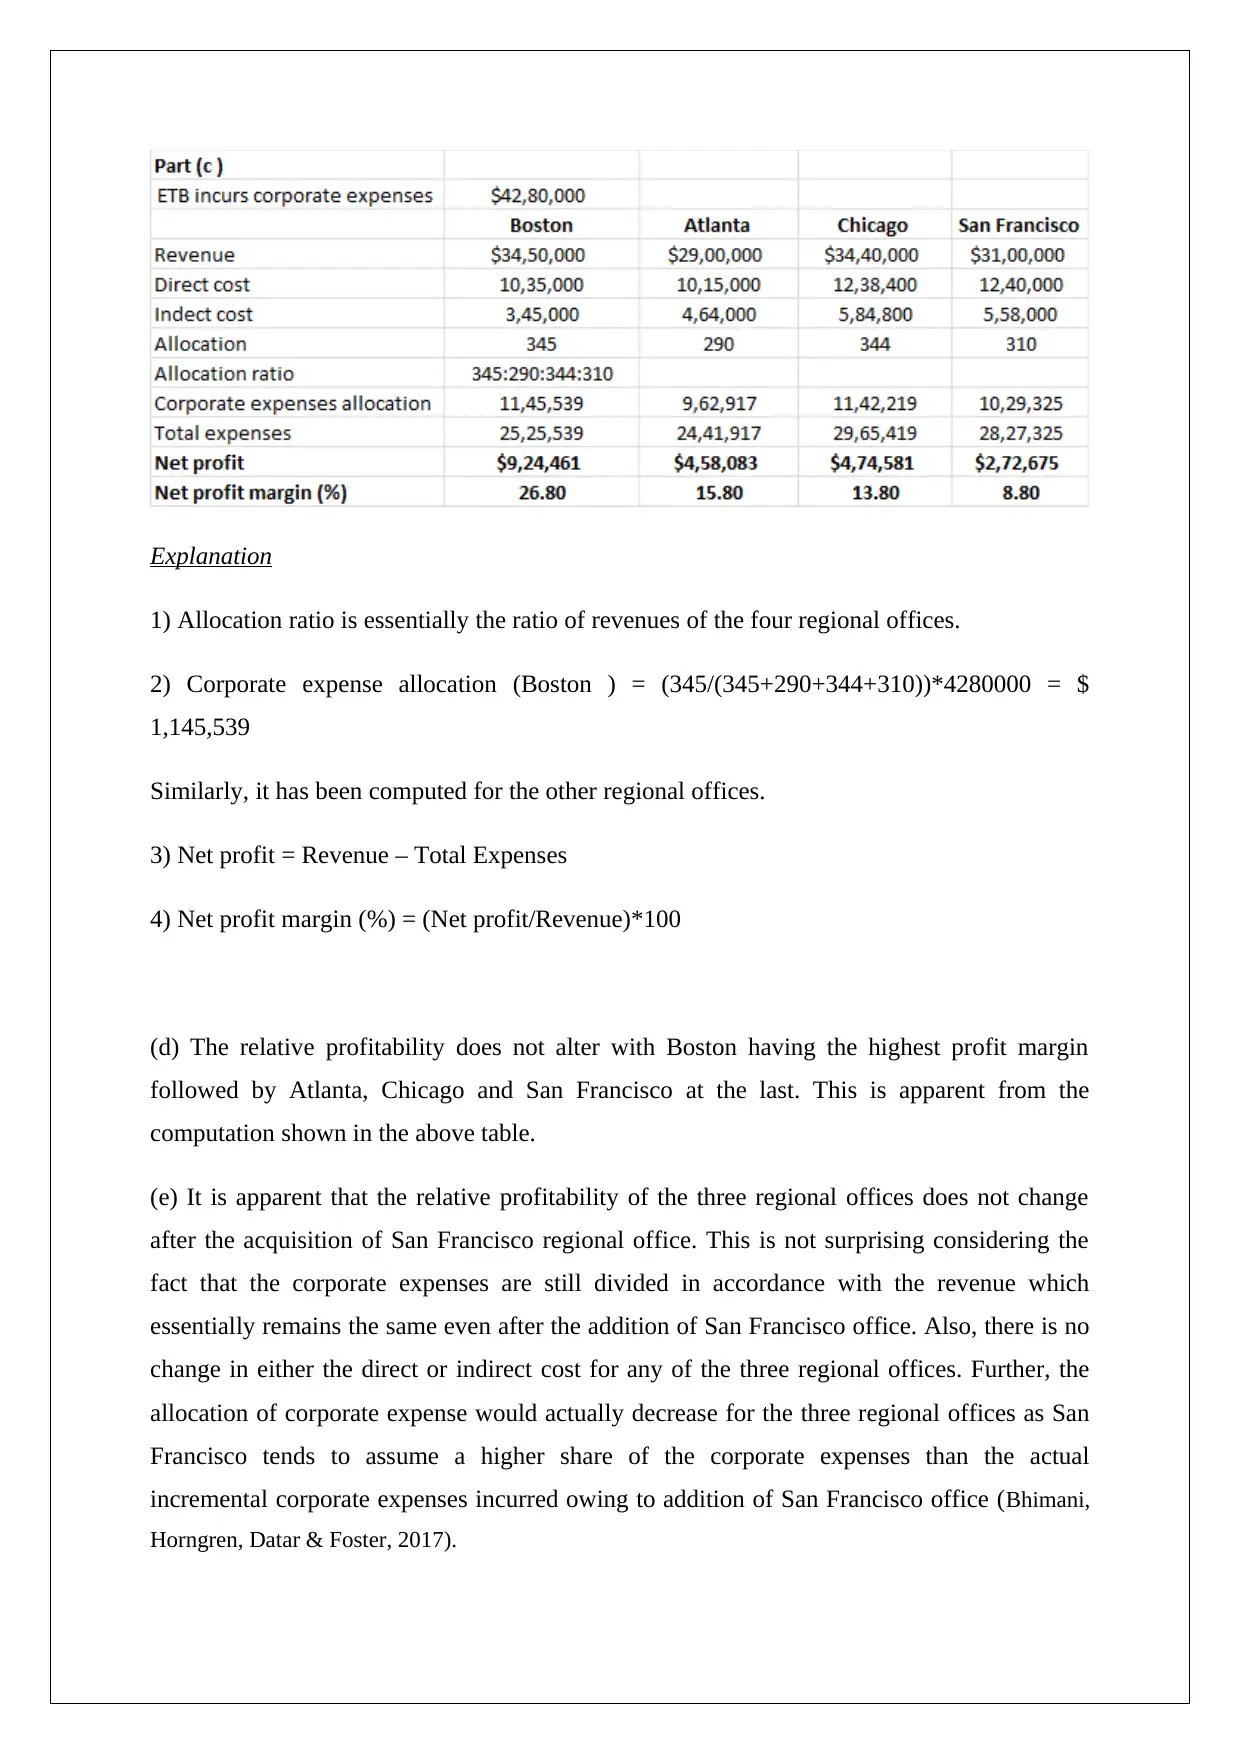
This assignment solution addresses a management accounting problem concerning the profitability analysis of regional offices. It begins by calculating the profitability of existing regional offices based on revenue and allocated corporate expenses, using a revenue-based allocation method. The solution then introduces a new regional office and recalculates profitability, demonstrating how the allocation of corporate expenses changes. The analysis highlights the potential inaccuracies of the current cost allocation method, showing how the allocation can misrepresent the profitability of individual offices. The solution also provides a detailed breakdown of the calculations, including the allocation ratios and net profit margins. Finally, it offers references from various accounting textbooks and resources to support the analysis and findings, emphasizing the importance of accurate cost allocation in determining profitability and making informed business decisions. This assignment highlights the critical role of financial analysis in assessing the performance of different business units and making strategic decisions.
tabler-icon-diamond-filled.svg

Contribute Materials

Your contribution can guide someone’s learning journey. Share your documents today.
Document Page
MANAGEMENT ACCOUNTING
STUDENT ID:
[Pick the date]
tabler-icon-diamond-filled.svg

Secure Best Marks with AI Grader

Need help grading? Try our AI Grader for instant feedback on your assignments.
Document Page
Question P7-18
(a) With regards to determining profitability, the key step is to determine the corporate
expenses across the regional expenses relative to their respective revenues. The profitability
computation of the regional offices is indicated below.
Explanation
1) Allocation ratio is essentially the ratio of revenues of the three regional offices.
2) Corporate expense allocation (Boston ) = (345/(345+290+344))*3780000 = $ 1,332,074
Similarly, it has been computed for the other regional offices.
3) Net profit = Revenue – Total Expenses
4) Net profit margin (%) = (Net profit/Revenue)*100
(b) Based on the above computations, it is apparent that the highest profit margin is for
Boston regional office followed by Atlanta regional office and finally Chicago regional office
which has the lowest profit margin amongst the three regional offices.
(c) Now another regional office in the form of San Francisco has been established and hence
the total corporate expenses would now be divided amongst the four regional offices. The
profitability computation of the regional offices is indicated below.
Document Page
Explanation
1) Allocation ratio is essentially the ratio of revenues of the four regional offices.
2) Corporate expense allocation (Boston ) = (345/(345+290+344+310))*4280000 = $
1,145,539
Similarly, it has been computed for the other regional offices.
3) Net profit = Revenue – Total Expenses
4) Net profit margin (%) = (Net profit/Revenue)*100
(d) The relative profitability does not alter with Boston having the highest profit margin
followed by Atlanta, Chicago and San Francisco at the last. This is apparent from the
computation shown in the above table.
(e) It is apparent that the relative profitability of the three regional offices does not change
after the acquisition of San Francisco regional office. This is not surprising considering the
fact that the corporate expenses are still divided in accordance with the revenue which
essentially remains the same even after the addition of San Francisco office. Also, there is no
change in either the direct or indirect cost for any of the three regional offices. Further, the
allocation of corporate expense would actually decrease for the three regional offices as San
Francisco tends to assume a higher share of the corporate expenses than the actual
incremental corporate expenses incurred owing to addition of San Francisco office (Bhimani,
Horngren, Datar & Foster, 2017).
Document Page
(f) The current cost allocation method of ETB seems inappropriate which is apparent from
the computations performed in part c (Heisinger, 2014). Even though the incremental
corporate expenses on account of San Francisco office are $ 500,000 but the allocated
corporate expense burden on the San Francisco office is $ 1,029,325 which is more than
twice owing to which the profitability of the San Francisco regional office is being
understated while that of the other three offices is being overstated (Drury, 2016). Clearly,
this is inaccurate and needs to be modified.
tabler-icon-diamond-filled.svg

Secure Best Marks with AI Grader

Need help grading? Try our AI Grader for instant feedback on your assignments.
Document Page
References
Bhimani, A., Horngren, C.T., Datar, S.M. & Foster, G. (2017), Management and Cost Accounting 4th
ed. Harlow: Prentice Hall/Financial Times
Drury, C. (2016) Cost and Management Accounting: An Introduction. 6th ed. New York: Cengage
Learning
Heisinger, K.(2014) Essentials of Managerial Accounting 4th ed. London: Cengage Learning.
chevron_up_icon
1 out of 5
circle_padding
hide_on_mobile
zoom_out_icon
logo.png

Your All-in-One AI-Powered Toolkit for Academic Success.

Available 24*7 on WhatsApp / Email

[object Object]