Cost Accounting Report: Proposal Profit Analysis, BEP
VerifiedAdded on 2020/10/22
|11
|2568
|275
Report
AI Summary
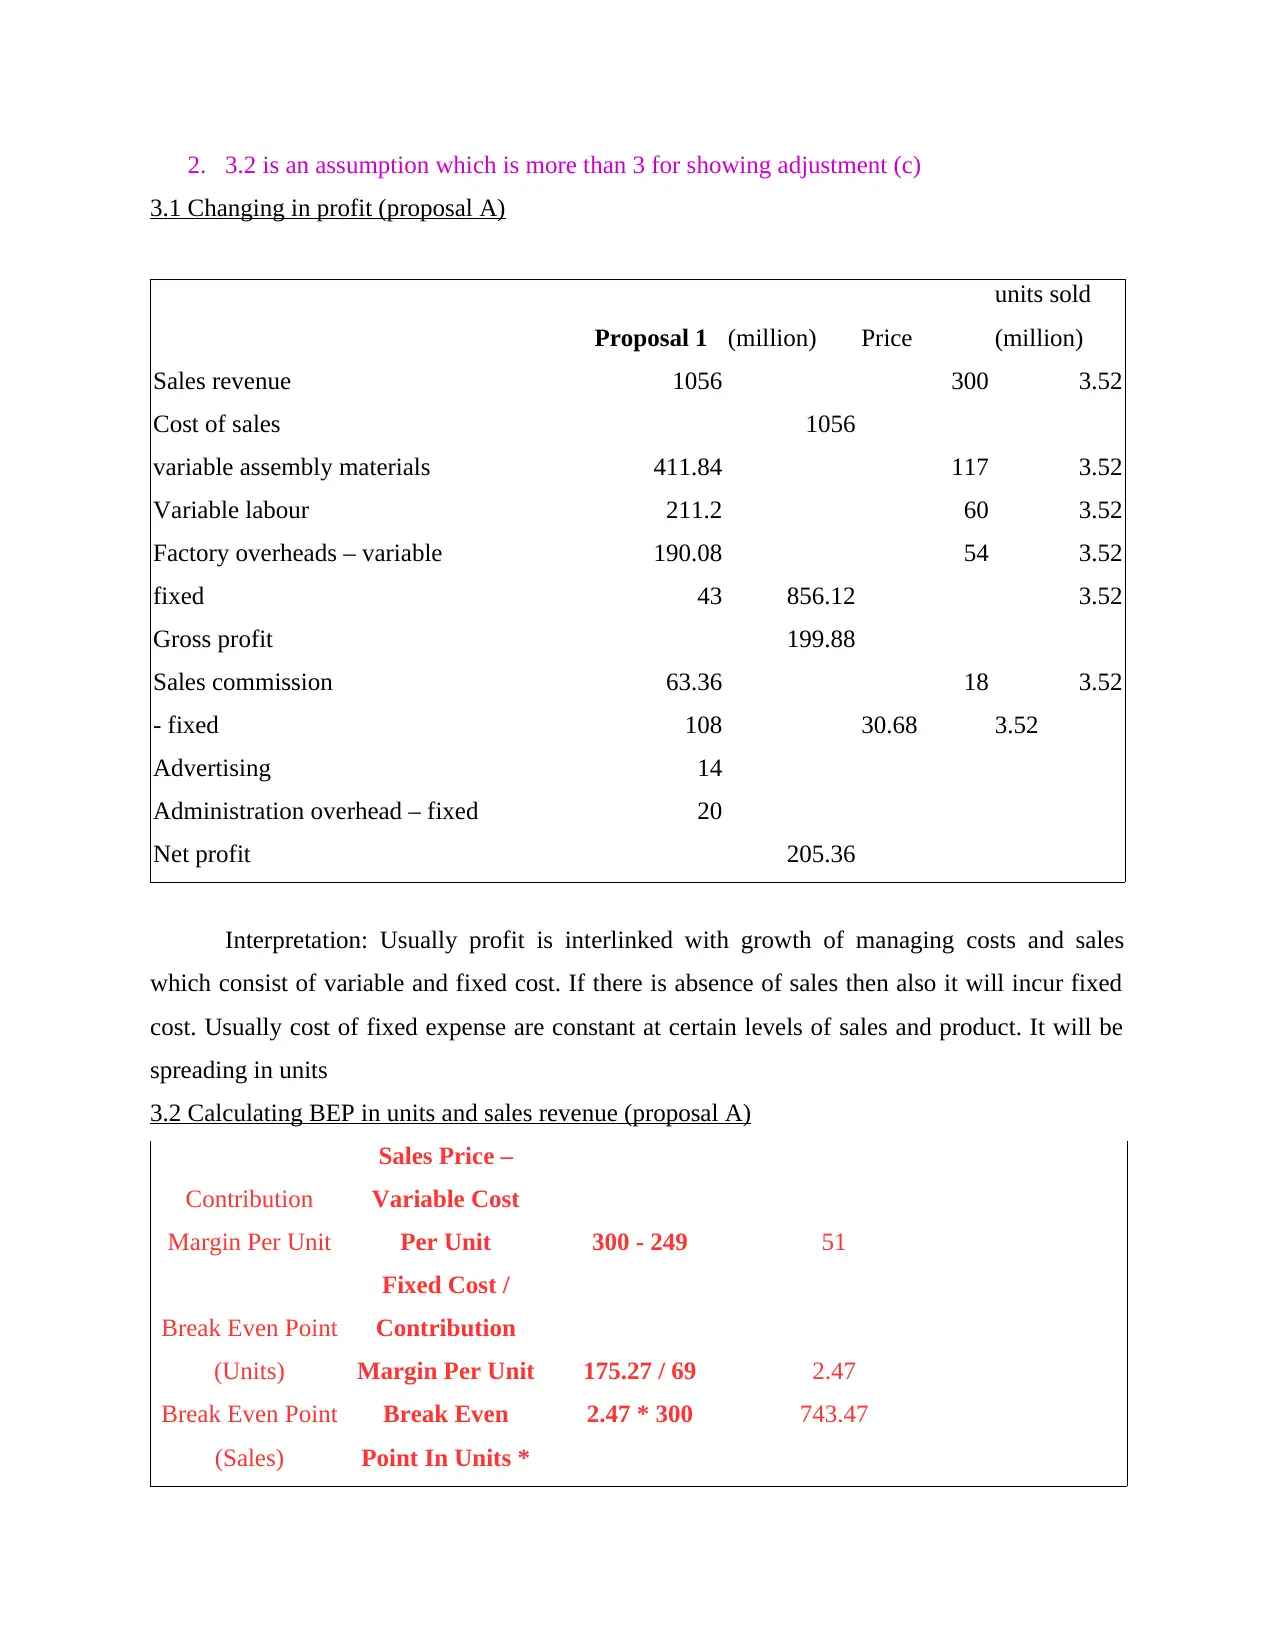
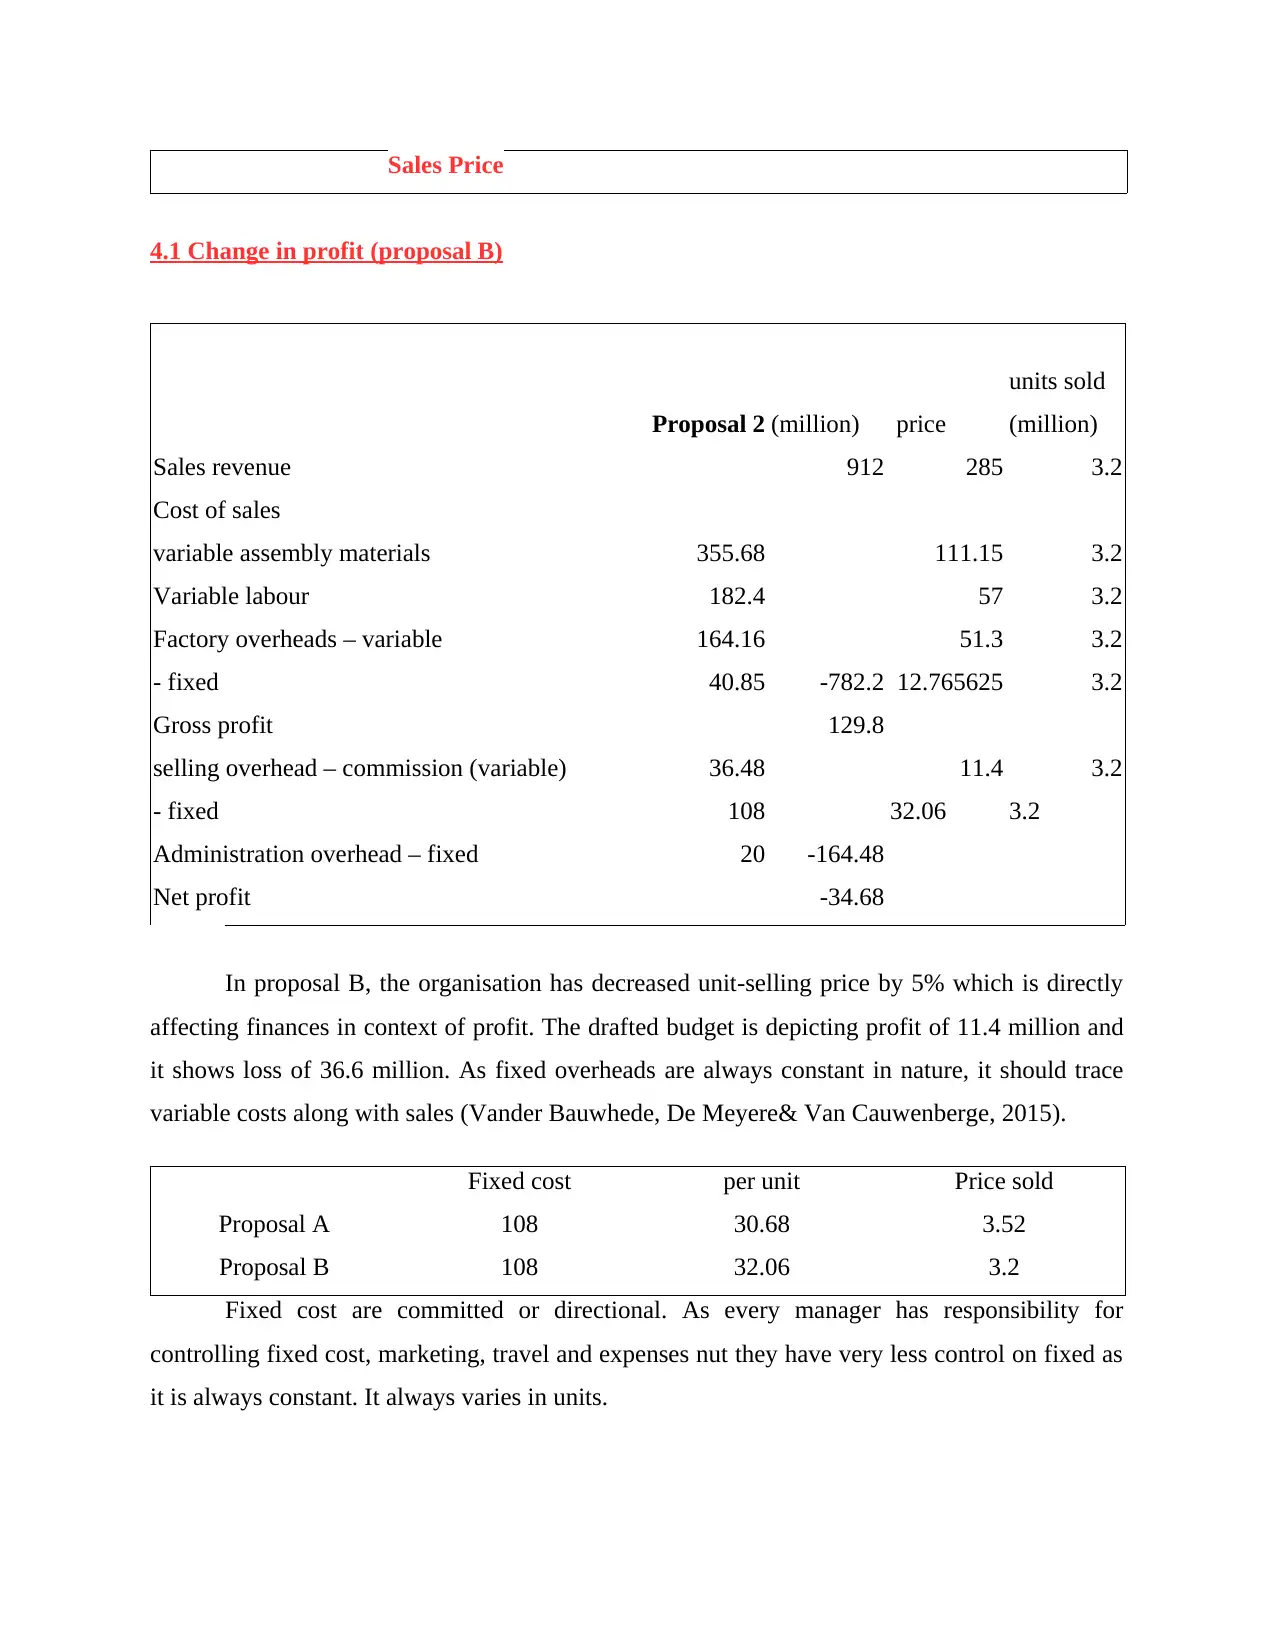
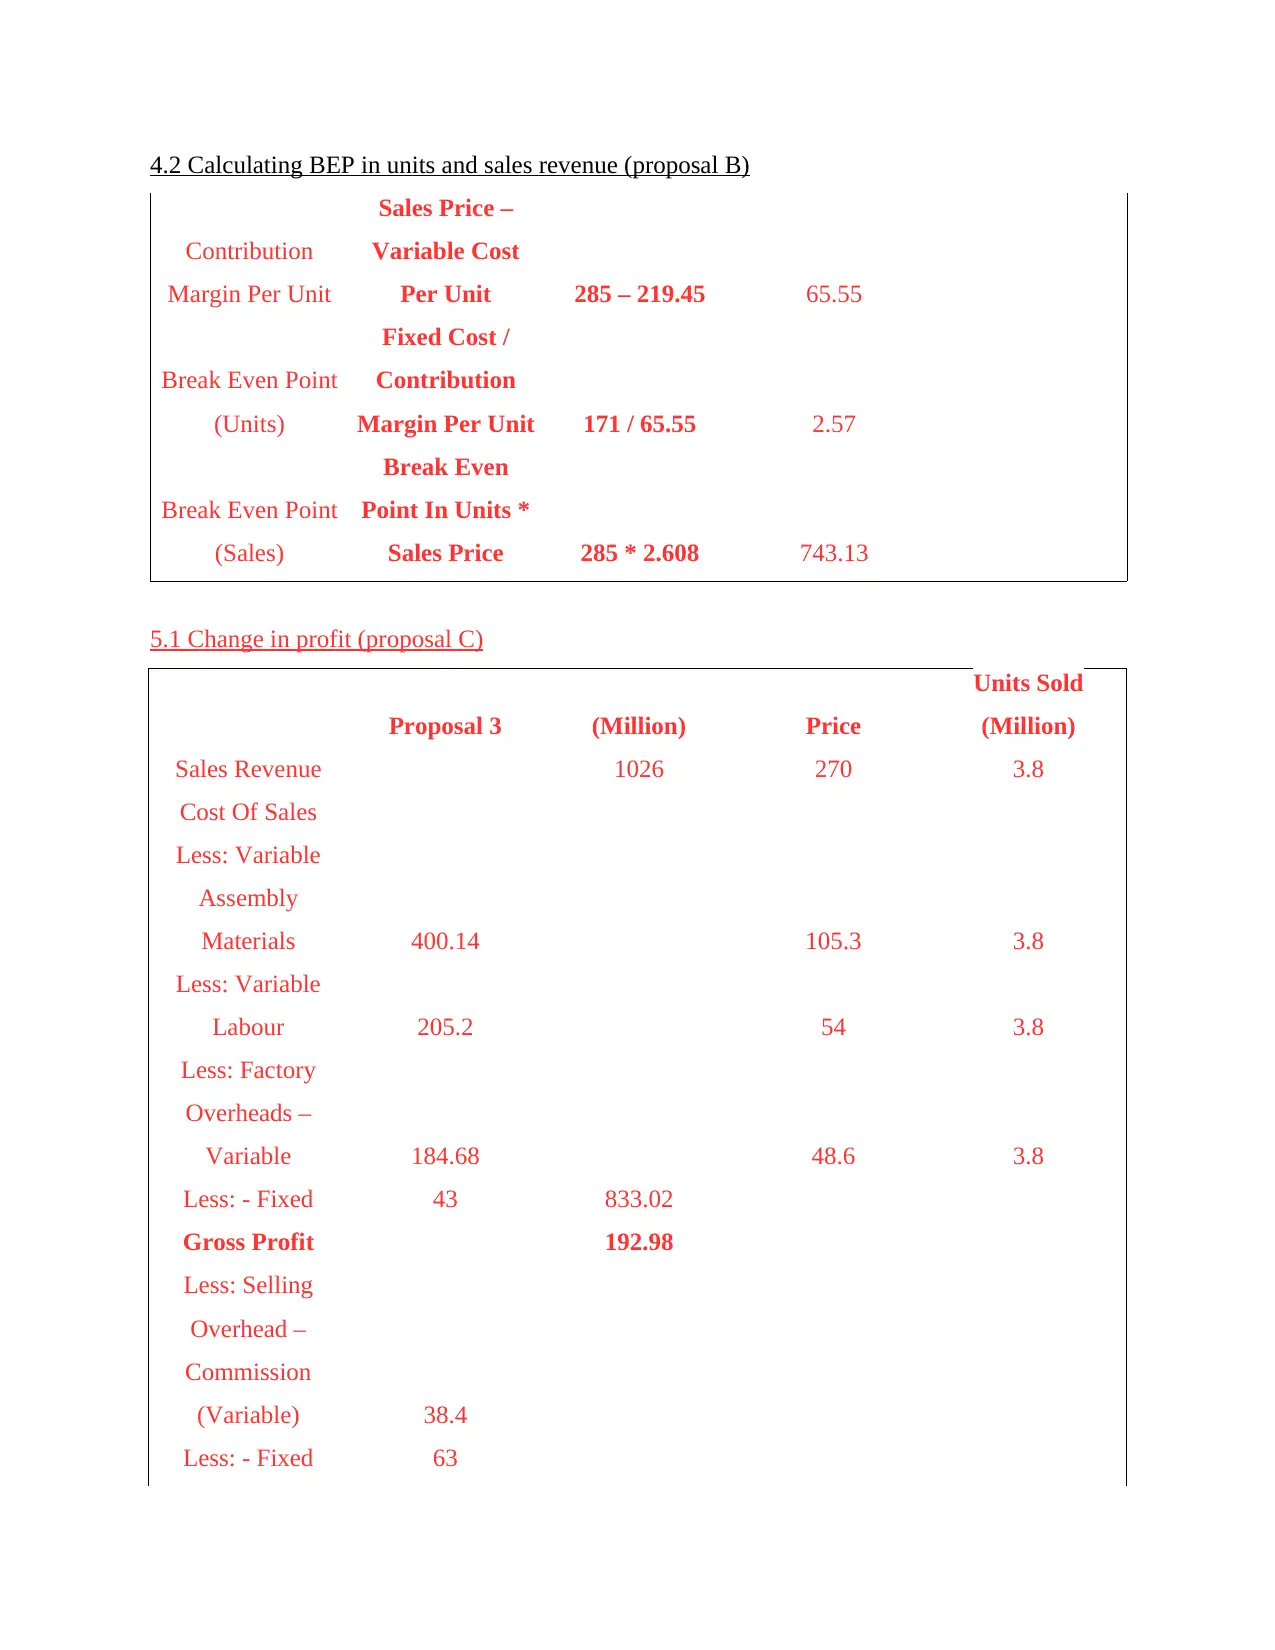
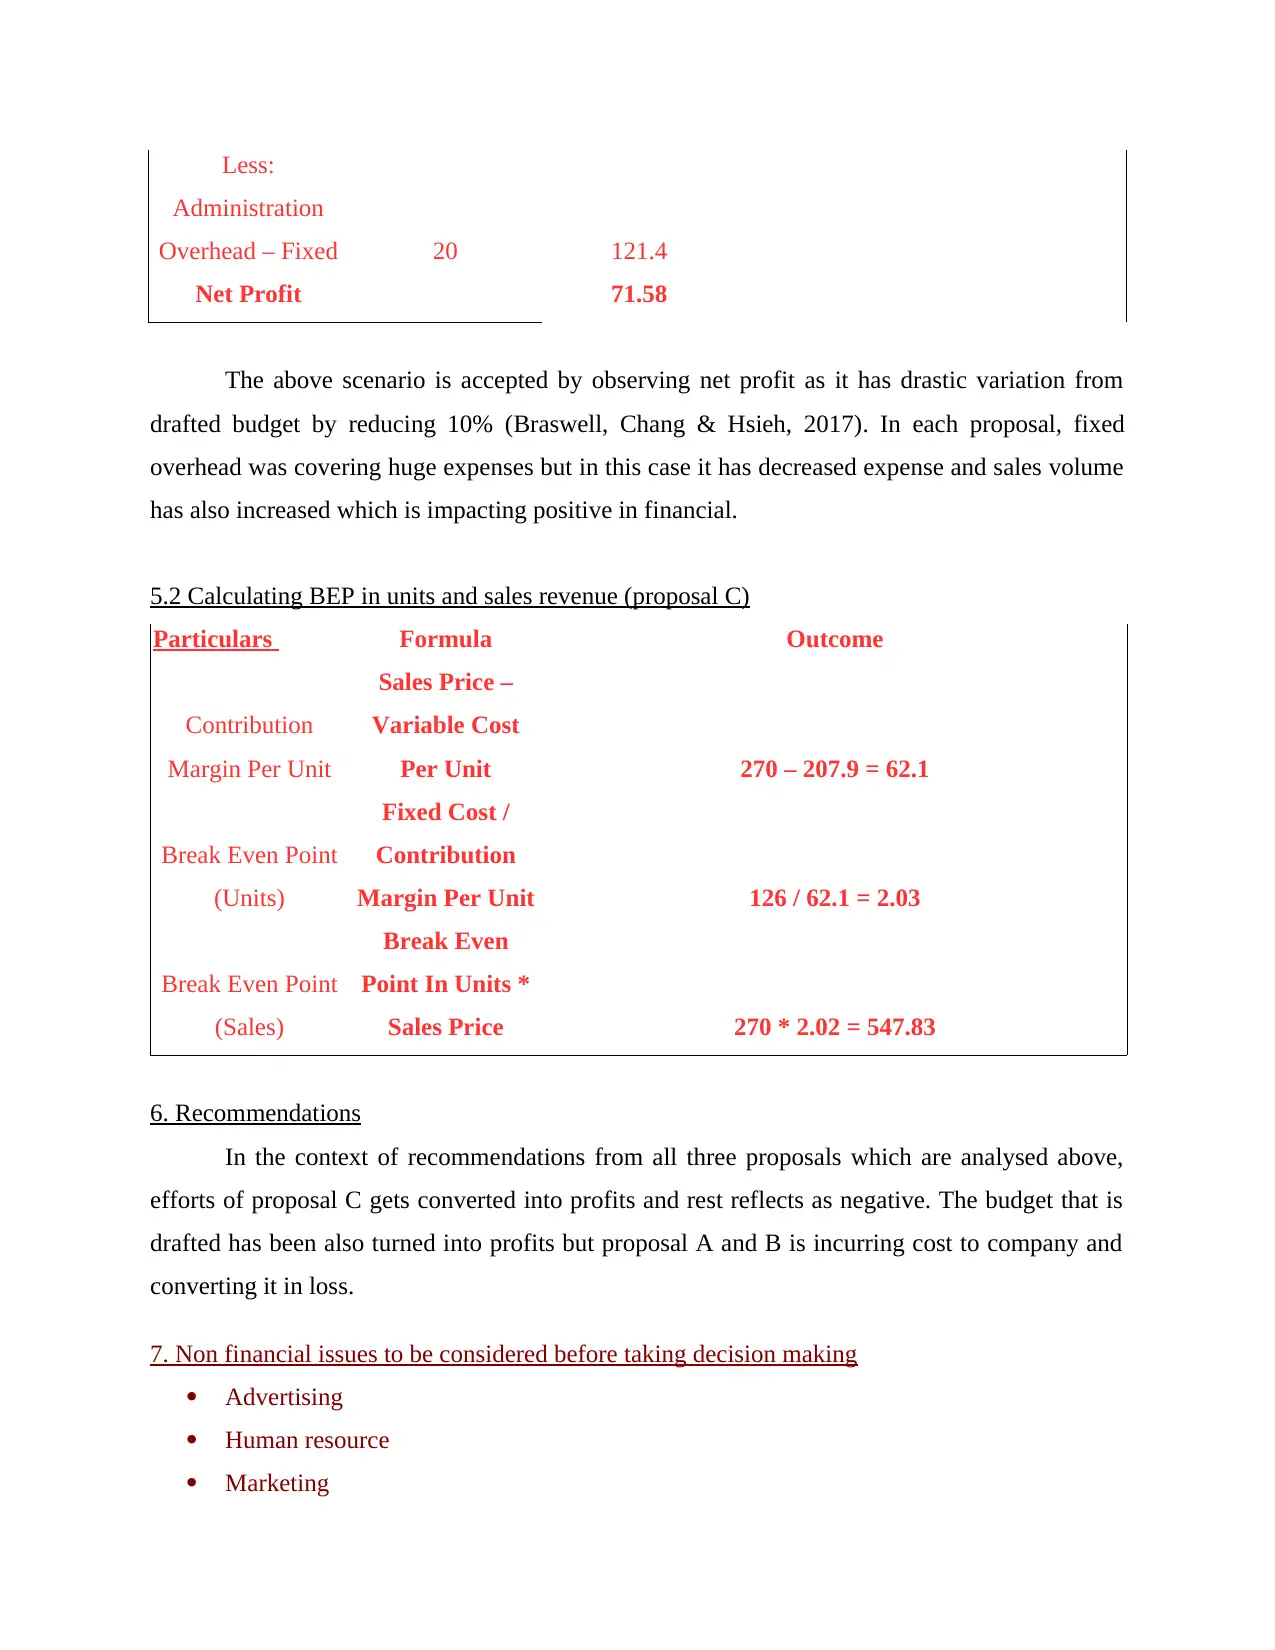
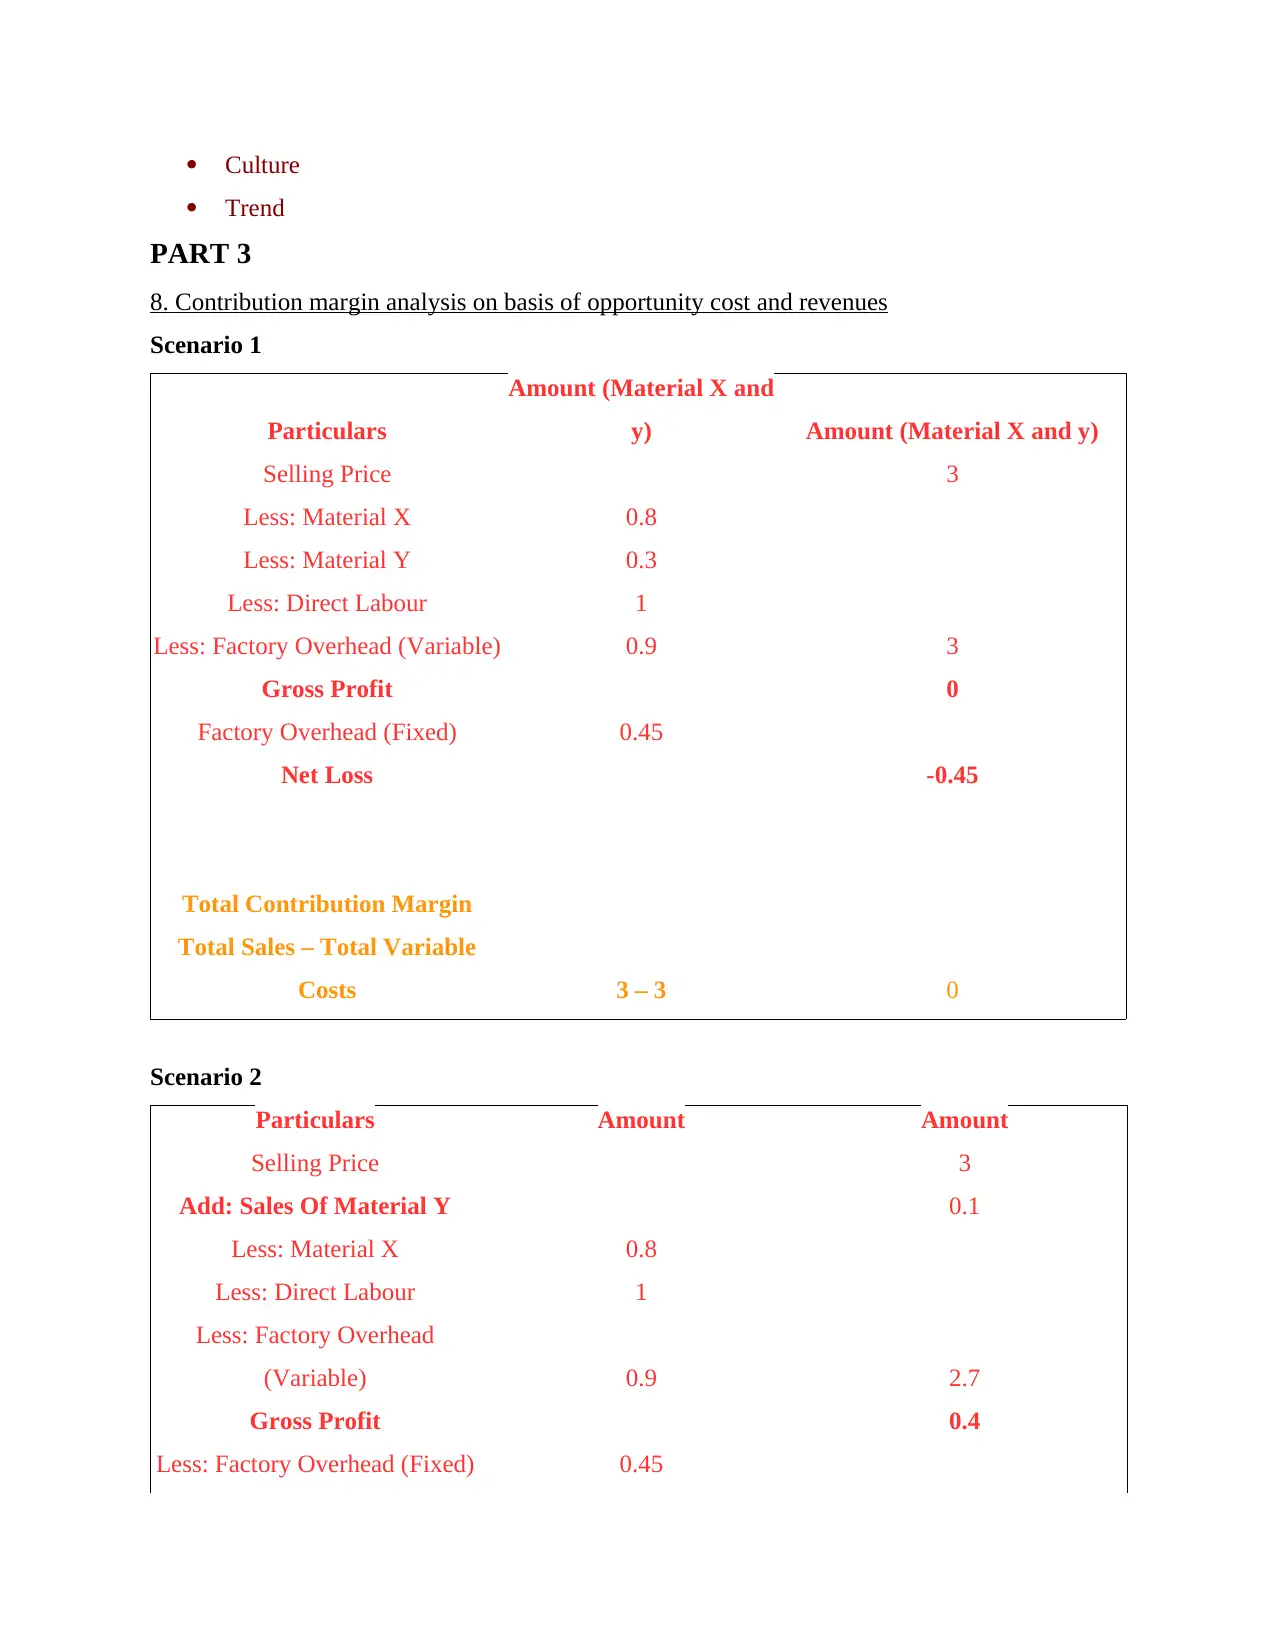
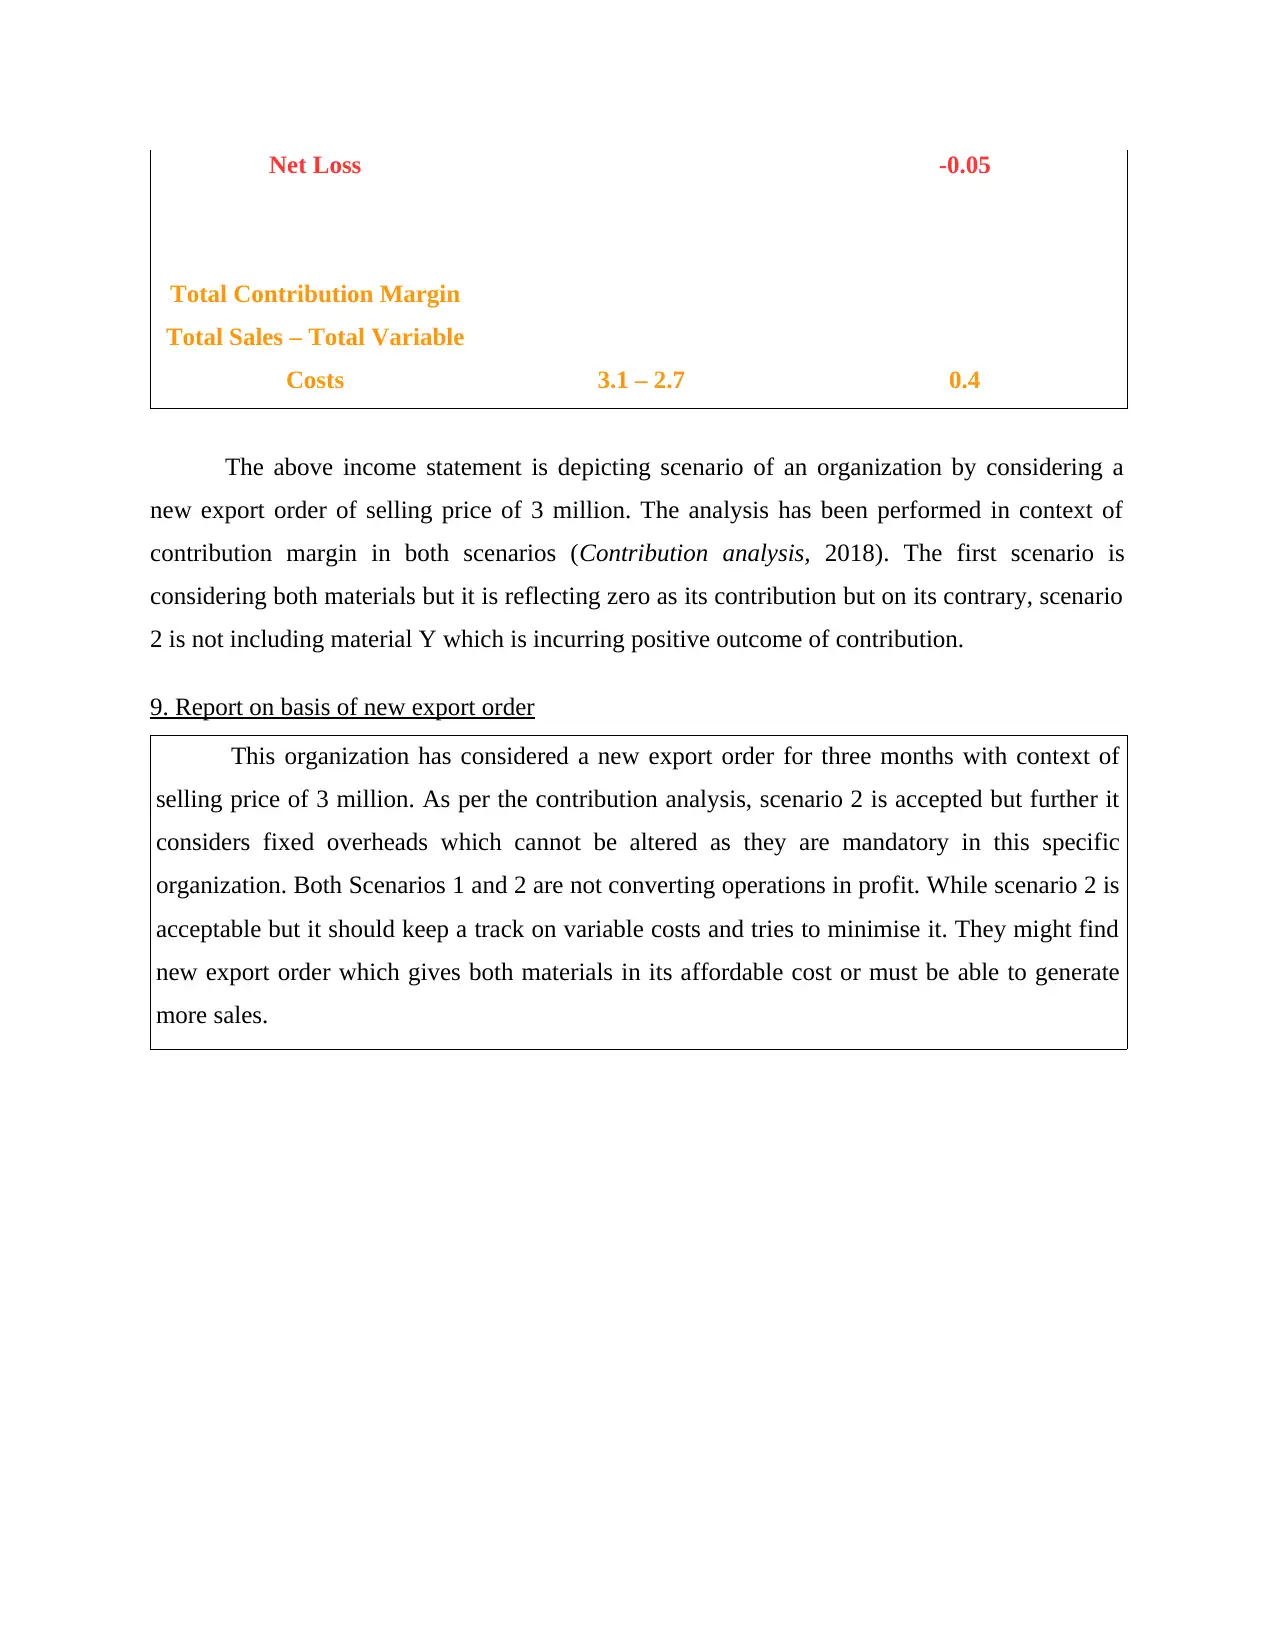
This cost accounting report presents a comprehensive analysis of three proposals (A, B, and C) along with a base budget, evaluating their impact on profitability and break-even points (BEP). The report meticulously calculates changes in profit, BEP in units, and sales revenue for each proposal. It examines the effects of fixed and variable costs, contribution margins, and the influence of factors like sales commissions and advertising. The analysis includes detailed interpretations of financial data, working notes, and a contribution margin analysis based on opportunity cost and revenues. The report concludes with recommendations, highlighting Proposal C as the most profitable, and considers non-financial issues like advertising, human resources, and marketing. It provides a deep dive into financial decision-making, considering fixed costs and their impact on profit margins, and provides a detailed look at how changes in sales prices and costs affect the overall financial performance, offering a practical guide to cost accounting principles.

COST ACCOUNTING
Secure Best Marks with AI Grader
Need help grading? Try our AI Grader for instant feedback on your assignments.

TABLE OF CONTENTS
PART 1............................................................................................................................................3
3.1 Changing in profit (proposal A)............................................................................................5
3.2 Calculating BEP in units and sales revenue (proposal A).....................................................5
4.1 Change in profit (proposal B)...............................................................................................6
4.2 Calculating BEP in units and sales revenue (proposal B).....................................................6
5.1 Change in profit (proposal C)...............................................................................................7
5.2 Calculating BEP in units and sales revenue (proposal C).....................................................7
6. Recommendations...................................................................................................................8
7. Non financial issues to be considered before taking decision making....................................8
PART 3............................................................................................................................................8
8. Contribution margin analysis on basis of opportunity cost and revenues...............................8
9. Report on basis of new export order.......................................................................................9
REFERENCES..............................................................................................................................10

PART 1
(million) Per unit price
units sold
(million)
Sales revenue 960 300 3.2
Cost of sales
variable assembly materials 249.6 78 3.2
Variable labor 128 40 3.2
Factory overheads – variable 115.2 36 3.2
- fixed 43 -782.2 13.4375 3.2
Gross profit 177.8
selling overhead –
commission (variable) 38.4 12 3.2
- fixed 108 33.75 3.2
Administration overhead –
fixed 20 -166.4
Net profit 11.4
Total Contribution margin
Total sales –
total variable
costs 428.8
Contribution margin per unit
sales price –
variable cost
per unit 134
BEP (units)
Fixed cost /
contribution
margin per unit 1.27

BEP (sales)
Break even
point in units *
sales price 382.83
(million) cost unit
Sales revenue 720 300 300 2.4
Cost of sales
variable
assembly
materials 187.2 78 2.4
Variable
labour 96 40 2.4
Factory
overheads –
variable 86.4 36 2.4
- fixed 43 597.4
Gross profit 122.6 720
selling
overhead –
commission
(variable) 38.4 16 2.4
- fixed 108 45 2.4
Administration
overhead –
fixed 20 166.4
Net profit -43.8
Secure Best Marks with AI Grader
Need help grading? Try our AI Grader for instant feedback on your assignments.

Total Contribution
margin
Total sales – total
variable costs 312
Contribution margin per
unit
sales price – variable
cost per unit 146
BEP (units)
Fixed cost /
contribution margin
per unit 1.17
BEP (sales)
Break even point in
units * sales price 351.36
The profit of budget which is drafted is depicting profit of 11.4 million and proposal A is
giving net loss of 48.15 million as they had involved campaign of marketing in very aggressive
manner which had incurred cost to organization of 14 million and even commission payment of
63.36 million. From this aggressive strategy, their level of sales were increased but not in equal
proportion to the cost of company (Kim & et. al., 2017).
Effect on fixed cost
Fixed cost Per unit Units sold
108 33.75 3.2
108 45 2.4
Interpretation: The above table is representing effect on fixed cost if planned sales are
expected to be less, as fixed costs are also inversely proportional to volume of sales. It can be
replicated as when unit fixed cost increases along with volume due to spread of fixed cost over
fewer units. On its contrary, if there is decrement in unit fixed cost when there is rise in volume
due to spread of cost over more units. While calculating contribution margin commission
variable is also included as each variable expense is considered.
Working note
1. (3.2 – (3.2 * 25%)) * 300

2. 3.2 is an assumption which is more than 3 for showing adjustment (c)
3.1 Changing in profit (proposal A)
Proposal 1 (million) Price
units sold
(million)
Sales revenue 1056 300 3.52
Cost of sales 1056
variable assembly materials 411.84 117 3.52
Variable labour 211.2 60 3.52
Factory overheads – variable 190.08 54 3.52
fixed 43 856.12 3.52
Gross profit 199.88
Sales commission 63.36 18 3.52
- fixed 108 30.68 3.52
Advertising 14
Administration overhead – fixed 20
Net profit 205.36
Interpretation: Usually profit is interlinked with growth of managing costs and sales
which consist of variable and fixed cost. If there is absence of sales then also it will incur fixed
cost. Usually cost of fixed expense are constant at certain levels of sales and product. It will be
spreading in units
3.2 Calculating BEP in units and sales revenue (proposal A)
Contribution
Margin Per Unit
Sales Price –
Variable Cost
Per Unit 300 - 249 51
Break Even Point
(Units)
Fixed Cost /
Contribution
Margin Per Unit 175.27 / 69 2.47
Break Even Point
(Sales)
Break Even
Point In Units *
2.47 * 300 743.47

Sales Price
4.1 Change in profit (proposal B)
Proposal 2 (million) price
units sold
(million)
Sales revenue 912 285 3.2
Cost of sales
variable assembly materials 355.68 111.15 3.2
Variable labour 182.4 57 3.2
Factory overheads – variable 164.16 51.3 3.2
- fixed 40.85 -782.2 12.765625 3.2
Gross profit 129.8
selling overhead – commission (variable) 36.48 11.4 3.2
- fixed 108 32.06 3.2
Administration overhead – fixed 20 -164.48
Net profit -34.68
In proposal B, the organisation has decreased unit-selling price by 5% which is directly
affecting finances in context of profit. The drafted budget is depicting profit of 11.4 million and
it shows loss of 36.6 million. As fixed overheads are always constant in nature, it should trace
variable costs along with sales (Vander Bauwhede, De Meyere& Van Cauwenberge, 2015).
Fixed cost per unit Price sold
Proposal A 108 30.68 3.52
Proposal B 108 32.06 3.2
Fixed cost are committed or directional. As every manager has responsibility for
controlling fixed cost, marketing, travel and expenses nut they have very less control on fixed as
it is always constant. It always varies in units.
Paraphrase This Document
Need a fresh take? Get an instant paraphrase of this document with our AI Paraphraser

4.2 Calculating BEP in units and sales revenue (proposal B)
Contribution
Margin Per Unit
Sales Price –
Variable Cost
Per Unit 285 – 219.45 65.55
Break Even Point
(Units)
Fixed Cost /
Contribution
Margin Per Unit 171 / 65.55 2.57
Break Even Point
(Sales)
Break Even
Point In Units *
Sales Price 285 * 2.608 743.13
5.1 Change in profit (proposal C)
Proposal 3 (Million) Price
Units Sold
(Million)
Sales Revenue 1026 270 3.8
Cost Of Sales
Less: Variable
Assembly
Materials 400.14 105.3 3.8
Less: Variable
Labour 205.2 54 3.8
Less: Factory
Overheads –
Variable 184.68 48.6 3.8
Less: - Fixed 43 833.02
Gross Profit 192.98
Less: Selling
Overhead –
Commission
(Variable) 38.4
Less: - Fixed 63
Contribution
Margin Per Unit
Sales Price –
Variable Cost
Per Unit 285 – 219.45 65.55
Break Even Point
(Units)
Fixed Cost /
Contribution
Margin Per Unit 171 / 65.55 2.57
Break Even Point
(Sales)
Break Even
Point In Units *
Sales Price 285 * 2.608 743.13
5.1 Change in profit (proposal C)
Proposal 3 (Million) Price
Units Sold
(Million)
Sales Revenue 1026 270 3.8
Cost Of Sales
Less: Variable
Assembly
Materials 400.14 105.3 3.8
Less: Variable
Labour 205.2 54 3.8
Less: Factory
Overheads –
Variable 184.68 48.6 3.8
Less: - Fixed 43 833.02
Gross Profit 192.98
Less: Selling
Overhead –
Commission
(Variable) 38.4
Less: - Fixed 63

Less:
Administration
Overhead – Fixed 20 121.4
Net Profit 71.58
The above scenario is accepted by observing net profit as it has drastic variation from
drafted budget by reducing 10% (Braswell, Chang & Hsieh, 2017). In each proposal, fixed
overhead was covering huge expenses but in this case it has decreased expense and sales volume
has also increased which is impacting positive in financial.
5.2 Calculating BEP in units and sales revenue (proposal C)
Particulars Formula Outcome
Contribution
Margin Per Unit
Sales Price –
Variable Cost
Per Unit 270 – 207.9 = 62.1
Break Even Point
(Units)
Fixed Cost /
Contribution
Margin Per Unit 126 / 62.1 = 2.03
Break Even Point
(Sales)
Break Even
Point In Units *
Sales Price 270 * 2.02 = 547.83
6. Recommendations
In the context of recommendations from all three proposals which are analysed above,
efforts of proposal C gets converted into profits and rest reflects as negative. The budget that is
drafted has been also turned into profits but proposal A and B is incurring cost to company and
converting it in loss.
7. Non financial issues to be considered before taking decision making
Advertising
Human resource
Marketing

Culture
Trend
PART 3
8. Contribution margin analysis on basis of opportunity cost and revenues
Scenario 1
Particulars
Amount (Material X and
y) Amount (Material X and y)
Selling Price 3
Less: Material X 0.8
Less: Material Y 0.3
Less: Direct Labour 1
Less: Factory Overhead (Variable) 0.9 3
Gross Profit 0
Factory Overhead (Fixed) 0.45
Net Loss -0.45
Total Contribution Margin
Total Sales – Total Variable
Costs 3 – 3 0
Scenario 2
Particulars Amount Amount
Selling Price 3
Add: Sales Of Material Y 0.1
Less: Material X 0.8
Less: Direct Labour 1
Less: Factory Overhead
(Variable) 0.9 2.7
Gross Profit 0.4
Less: Factory Overhead (Fixed) 0.45
Secure Best Marks with AI Grader
Need help grading? Try our AI Grader for instant feedback on your assignments.

Net Loss -0.05
Total Contribution Margin
Total Sales – Total Variable
Costs 3.1 – 2.7 0.4
The above income statement is depicting scenario of an organization by considering a
new export order of selling price of 3 million. The analysis has been performed in context of
contribution margin in both scenarios (Contribution analysis, 2018). The first scenario is
considering both materials but it is reflecting zero as its contribution but on its contrary, scenario
2 is not including material Y which is incurring positive outcome of contribution.
9. Report on basis of new export order
This organization has considered a new export order for three months with context of
selling price of 3 million. As per the contribution analysis, scenario 2 is accepted but further it
considers fixed overheads which cannot be altered as they are mandatory in this specific
organization. Both Scenarios 1 and 2 are not converting operations in profit. While scenario 2 is
acceptable but it should keep a track on variable costs and tries to minimise it. They might find
new export order which gives both materials in its affordable cost or must be able to generate
more sales.
1 out of 11
Related Documents

Your All-in-One AI-Powered Toolkit for Academic Success.
+13062052269
info@desklib.com
Available 24*7 on WhatsApp / Email
Unlock your academic potential
© 2024 | Zucol Services PVT LTD | All rights reserved.