ACC 200 Accounting Systems: Outdoor Adventures Profitability Report

Verified

Added on  2023/06/14

|10
|1056
|343
Report
AI Summary
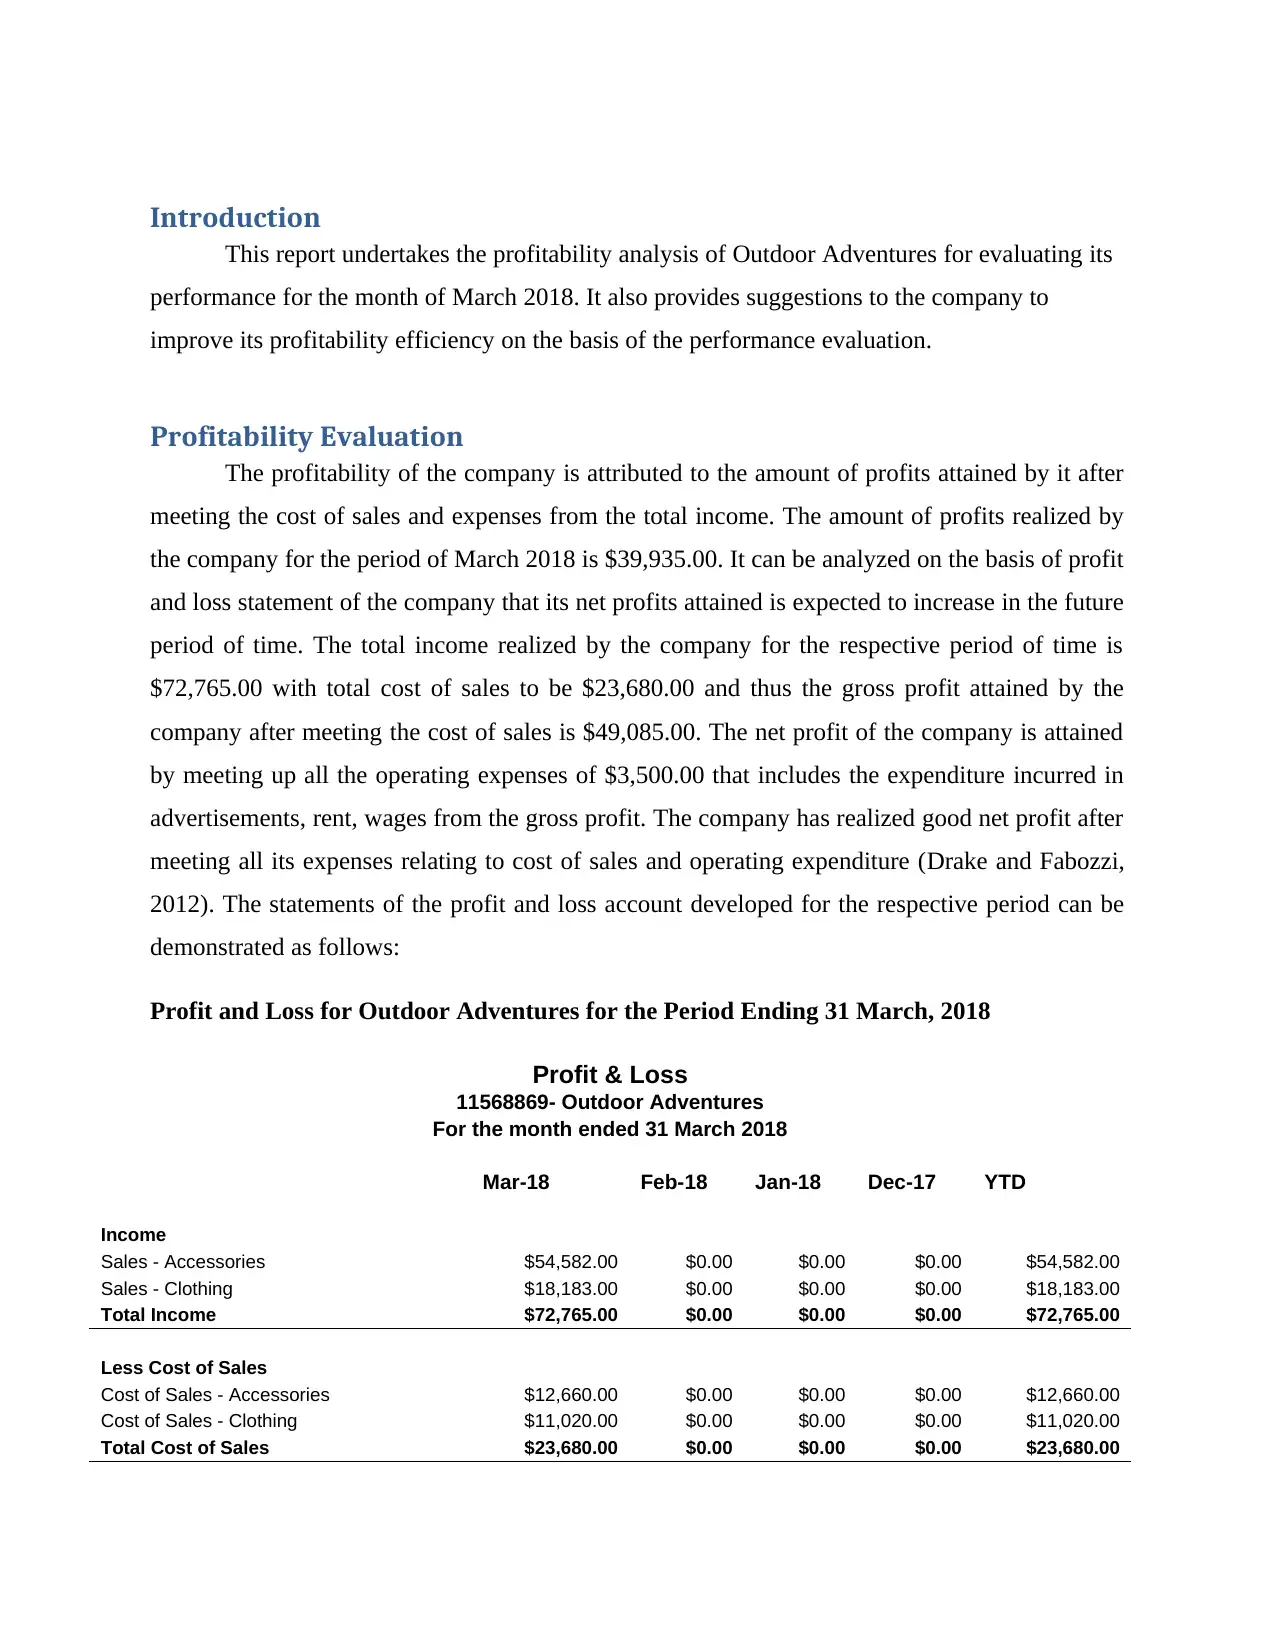
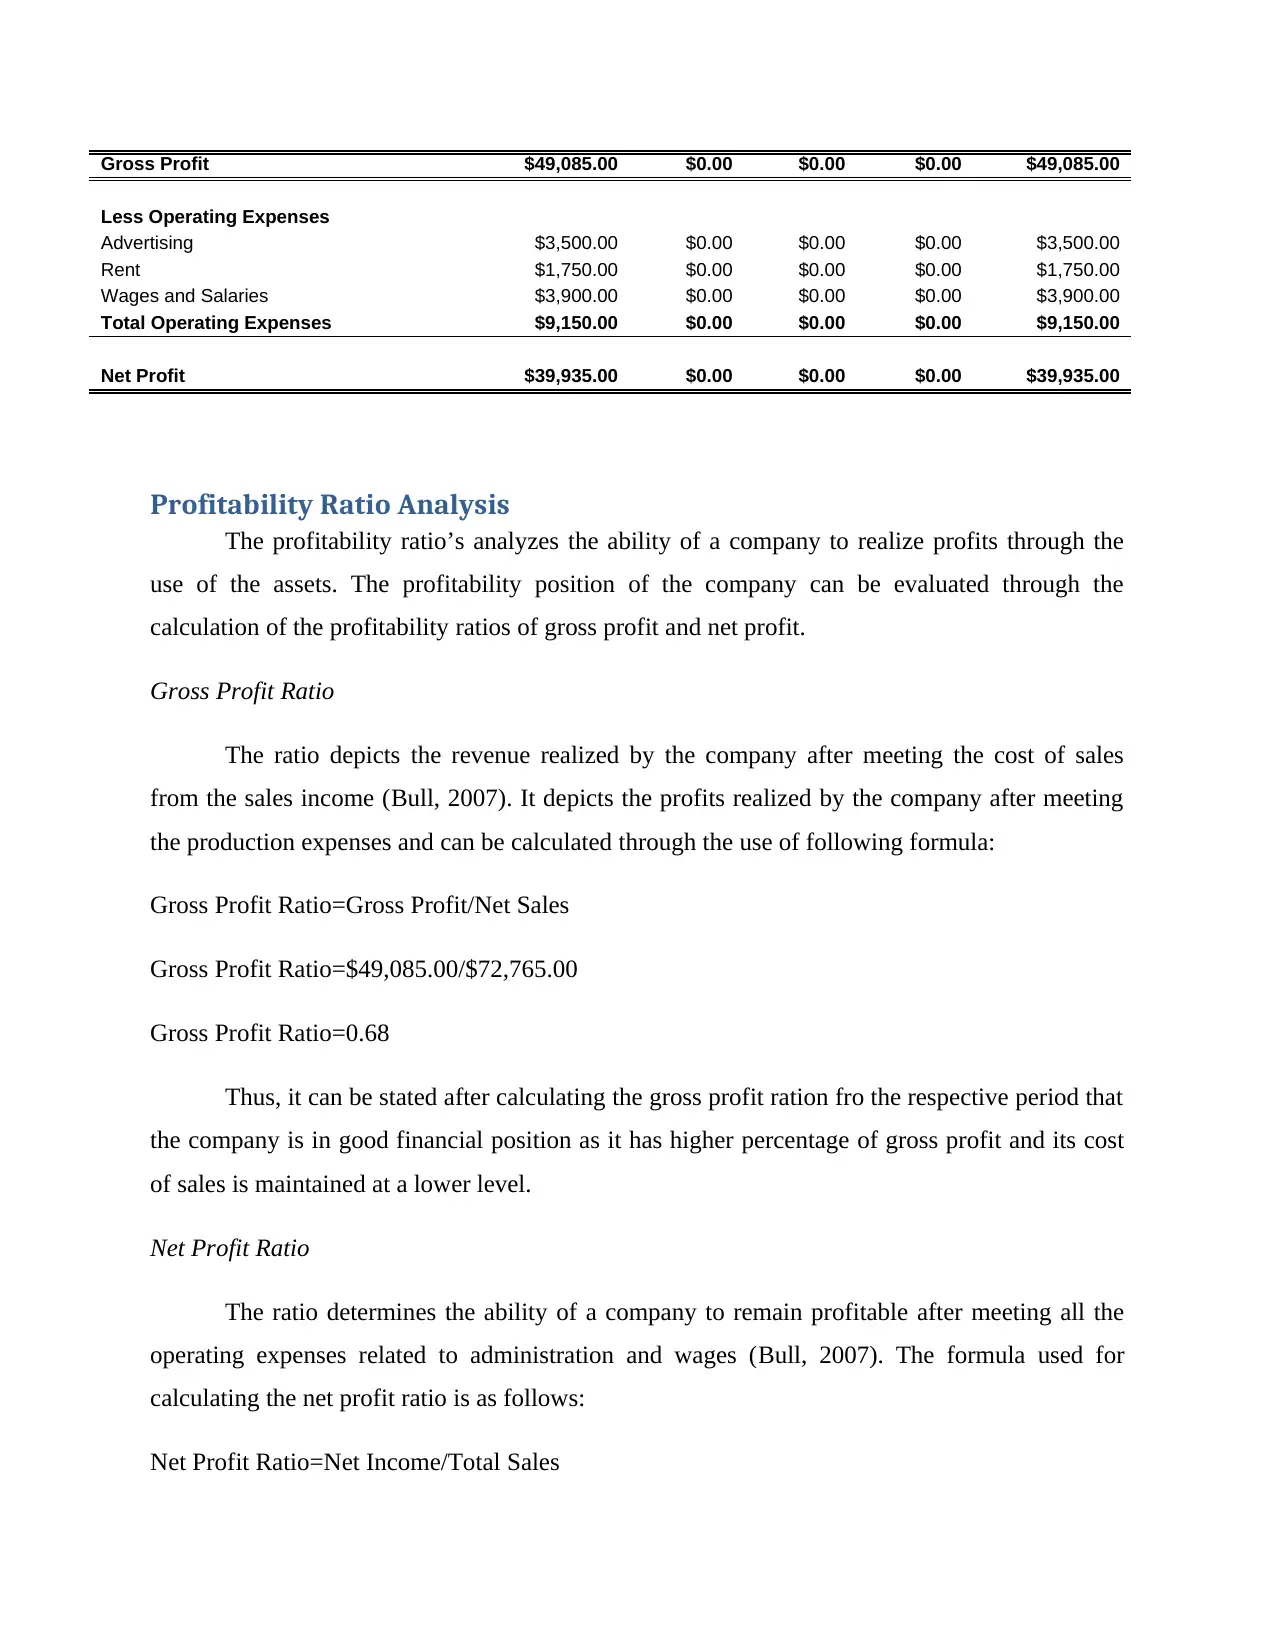
This report provides a profitability analysis of Outdoor Adventures for March 2018, evaluating its financial performance. It examines the company's gross profit and net profit, offering insights into its profitability position. The report calculates and analyzes gross profit and net profit ratios, indicating a healthy state of profitability. Recommendations are made to maintain operational and production expenses at a lower level to further improve profitability. The analysis is based on the company's profit and loss statement, showcasing income, cost of sales, operating expenses, and overall financial health. Desklib provides access to this and other solved assignments for students.
Document Page
Accounting Information Systems
tabler-icon-diamond-filled.svg

Paraphrase This Document

Need a fresh take? Get an instant paraphrase of this document with our AI Paraphraser
Document Page
Executive Summary
This report seeks to analyze and examine the profitability position of the company
‘Outdoor Adventures’ for the month of March 2018. In this context, it has evaluated the gross
profits and net profits attained by the company for the period that is helpful in determining its
present state of profitability. The calculation of the gross profit and net profit ratio for the
company has also depicted that it has maintained a good state of profitability even after meeting
up all its production and operational expenses. It is further recommended to adopt appropriate
financial measures for maintaining its operational and production expenses at a lower level.
Document Page
Contents
Introduction......................................................................................................................................4
Profitability Evaluation....................................................................................................................4
Profitability Ratio Analysis.............................................................................................................5
Recommendations............................................................................................................................6
Conclusion.......................................................................................................................................6
References........................................................................................................................................7
Document Page
Introduction
This report undertakes the profitability analysis of Outdoor Adventures for evaluating its
performance for the month of March 2018. It also provides suggestions to the company to
improve its profitability efficiency on the basis of the performance evaluation.
Profitability Evaluation
The profitability of the company is attributed to the amount of profits attained by it after
meeting the cost of sales and expenses from the total income. The amount of profits realized by
the company for the period of March 2018 is $39,935.00. It can be analyzed on the basis of profit
and loss statement of the company that its net profits attained is expected to increase in the future
period of time. The total income realized by the company for the respective period of time is
$72,765.00 with total cost of sales to be $23,680.00 and thus the gross profit attained by the
company after meeting the cost of sales is $49,085.00. The net profit of the company is attained
by meeting up all the operating expenses of $3,500.00 that includes the expenditure incurred in
advertisements, rent, wages from the gross profit. The company has realized good net profit after
meeting all its expenses relating to cost of sales and operating expenditure (Drake and Fabozzi,
2012). The statements of the profit and loss account developed for the respective period can be
demonstrated as follows:
Profit and Loss for Outdoor Adventures for the Period Ending 31 March, 2018
Profit & Loss
11568869- Outdoor Adventures
For the month ended 31 March 2018
Mar-18 Feb-18 Jan-18 Dec-17 YTD
Income
Sales - Accessories $54,582.00 $0.00 $0.00 $0.00 $54,582.00
Sales - Clothing $18,183.00 $0.00 $0.00 $0.00 $18,183.00
Total Income $72,765.00 $0.00 $0.00 $0.00 $72,765.00
Less Cost of Sales
Cost of Sales - Accessories $12,660.00 $0.00 $0.00 $0.00 $12,660.00
Cost of Sales - Clothing $11,020.00 $0.00 $0.00 $0.00 $11,020.00
Total Cost of Sales $23,680.00 $0.00 $0.00 $0.00 $23,680.00
tabler-icon-diamond-filled.svg

Paraphrase This Document

Need a fresh take? Get an instant paraphrase of this document with our AI Paraphraser
Document Page
Gross Profit $49,085.00 $0.00 $0.00 $0.00 $49,085.00
Less Operating Expenses
Advertising $3,500.00 $0.00 $0.00 $0.00 $3,500.00
Rent $1,750.00 $0.00 $0.00 $0.00 $1,750.00
Wages and Salaries $3,900.00 $0.00 $0.00 $0.00 $3,900.00
Total Operating Expenses $9,150.00 $0.00 $0.00 $0.00 $9,150.00
Net Profit $39,935.00 $0.00 $0.00 $0.00 $39,935.00
Profitability Ratio Analysis
The profitability ratio’s analyzes the ability of a company to realize profits through the
use of the assets. The profitability position of the company can be evaluated through the
calculation of the profitability ratios of gross profit and net profit.
Gross Profit Ratio
The ratio depicts the revenue realized by the company after meeting the cost of sales
from the sales income (Bull, 2007). It depicts the profits realized by the company after meeting
the production expenses and can be calculated through the use of following formula:
Gross Profit Ratio=Gross Profit/Net Sales
Gross Profit Ratio=$49,085.00/$72,765.00
Gross Profit Ratio=0.68
Thus, it can be stated after calculating the gross profit ration fro the respective period that
the company is in good financial position as it has higher percentage of gross profit and its cost
of sales is maintained at a lower level.
Net Profit Ratio
The ratio determines the ability of a company to remain profitable after meeting all the
operating expenses related to administration and wages (Bull, 2007). The formula used for
calculating the net profit ratio is as follows:
Net Profit Ratio=Net Income/Total Sales
Document Page
Net Profit Ratio=$39,935.00/$72,765.00
Net Profit Ratio=0.54%
The company has maintained a good net profit percentage for the respective period after meeting
all its operating expenses successfully.
Recommendations
The company can improve its profitability position through reducing its production cost
incurred in purchase of materials and direct labor.
The company is recommended to maintain a long-term relation with suppliers and labor
for decreeing the production cost (Wild, 2006)
It should also keep a check on its inventory level on a continuous basis to minimize the
inventory holding cost and improving the profitability position
It is also recommended to improve its operational efficiency through reducing the
expenditure related to advertisement and rent
It should also emphasizes on improving its sales position through the use of free add-on-
sales (Bragg, 2012)
Conclusion
It can be stated from the profitability analysis of the company that it is currently in a good
state of financial position as it is able to realize good profits after meeting all its production and
operational expenditures.
Document Page
References
Bragg, S. 2012. Financial Analysis: A Controller's Guide. John Wiley & Sons.
Bull, R. 2007. Financial Ratios: How to use financial ratios to maximise value and success for
your business'. Elsevier.
Drake, P. P. and Fabozzi, F. J. 2012. Analysis of Financial Statements. John Wiley & Sons.
Wild. 2006. Financial Statement Analysis 9E. Tata McGraw-Hill Education.
tabler-icon-diamond-filled.svg

Paraphrase This Document

Need a fresh take? Get an instant paraphrase of this document with our AI Paraphraser
Document Page
Data Flow Diagram of String Private Limited
Document Page
Document Page
chevron_up_icon
1 out of 10
circle_padding
hide_on_mobile
zoom_out_icon
[object Object]