Justifying Capital Investment: Project A or B? A Financial Analysis
VerifiedAdded on 2020/06/04
|13
|3552
|155
Report
AI Summary
This report presents a capital budgeting analysis comparing two mutually exclusive projects, Project A and Project B, for Tissue Co. The analysis employs various investment appraisal techniques, including Net Present Value (NPV), Internal Rate of Return (IRR), payback period, and Accounting Rate of Return (ARR), to determine the more financially viable project. The report includes profit and loss statements, cash flow statements, and calculations for each method. The discounting rate is calculated, and a detailed evaluation of each project is provided, leading to a recommendation for Tissue Co. to invest in Project A due to its higher NPV, IRR, and profitability index, despite the quicker payback period of Project A. The report highlights the importance of capital budgeting techniques in making informed investment decisions, considering the time value of money and the risks associated with each project.

Justify and validate whether or not to
proceed with one of two mutually exclusive
projects (Project A or Project B)
proceed with one of two mutually exclusive
projects (Project A or Project B)
Paraphrase This Document
Need a fresh take? Get an instant paraphrase of this document with our AI Paraphraser
Table of Contents
EXECUTIVE SUMMARY.............................................................................................................1
Business and project overview.....................................................................................................1
P&L statement and cash flow statement......................................................................................2
Discounting rate...........................................................................................................................3
Capital budgeting analysis...........................................................................................................4
CONCLUSION................................................................................................................................9
LIST OF REFERNCES.................................................................................................................10
INDEX OF TABLES
Table 1 Profit and loss statement of Project A...............................................................................2
Table 2Profit and loss statement of Project B................................................................................2
Table 3 Cash flow statement for Project A....................................................................................2
Table 4Cash flow statement for Project B.....................................................................................3
Table 5 Calculation of net present value for project A...................................................................5
Table 6 Calculation of net present value for project B...................................................................5
Table 7 Calulation of payback period for project A.......................................................................6
Table 8 Calulation of payback period for project B.......................................................................6
Table 9 Calculation of internal rate of return for project A............................................................6
Table 10 Calculation of internal rate of return for project for project B........................................7
Table 11 Calculation of accounting rate of return for project A....................................................7
Table 12 Calculation of accounting rate of return for project B.....................................................8
Table 13 Calculation of profitability Index for project A...............................................................8
Table 14 Calculation of profitability Index for project B...............................................................8
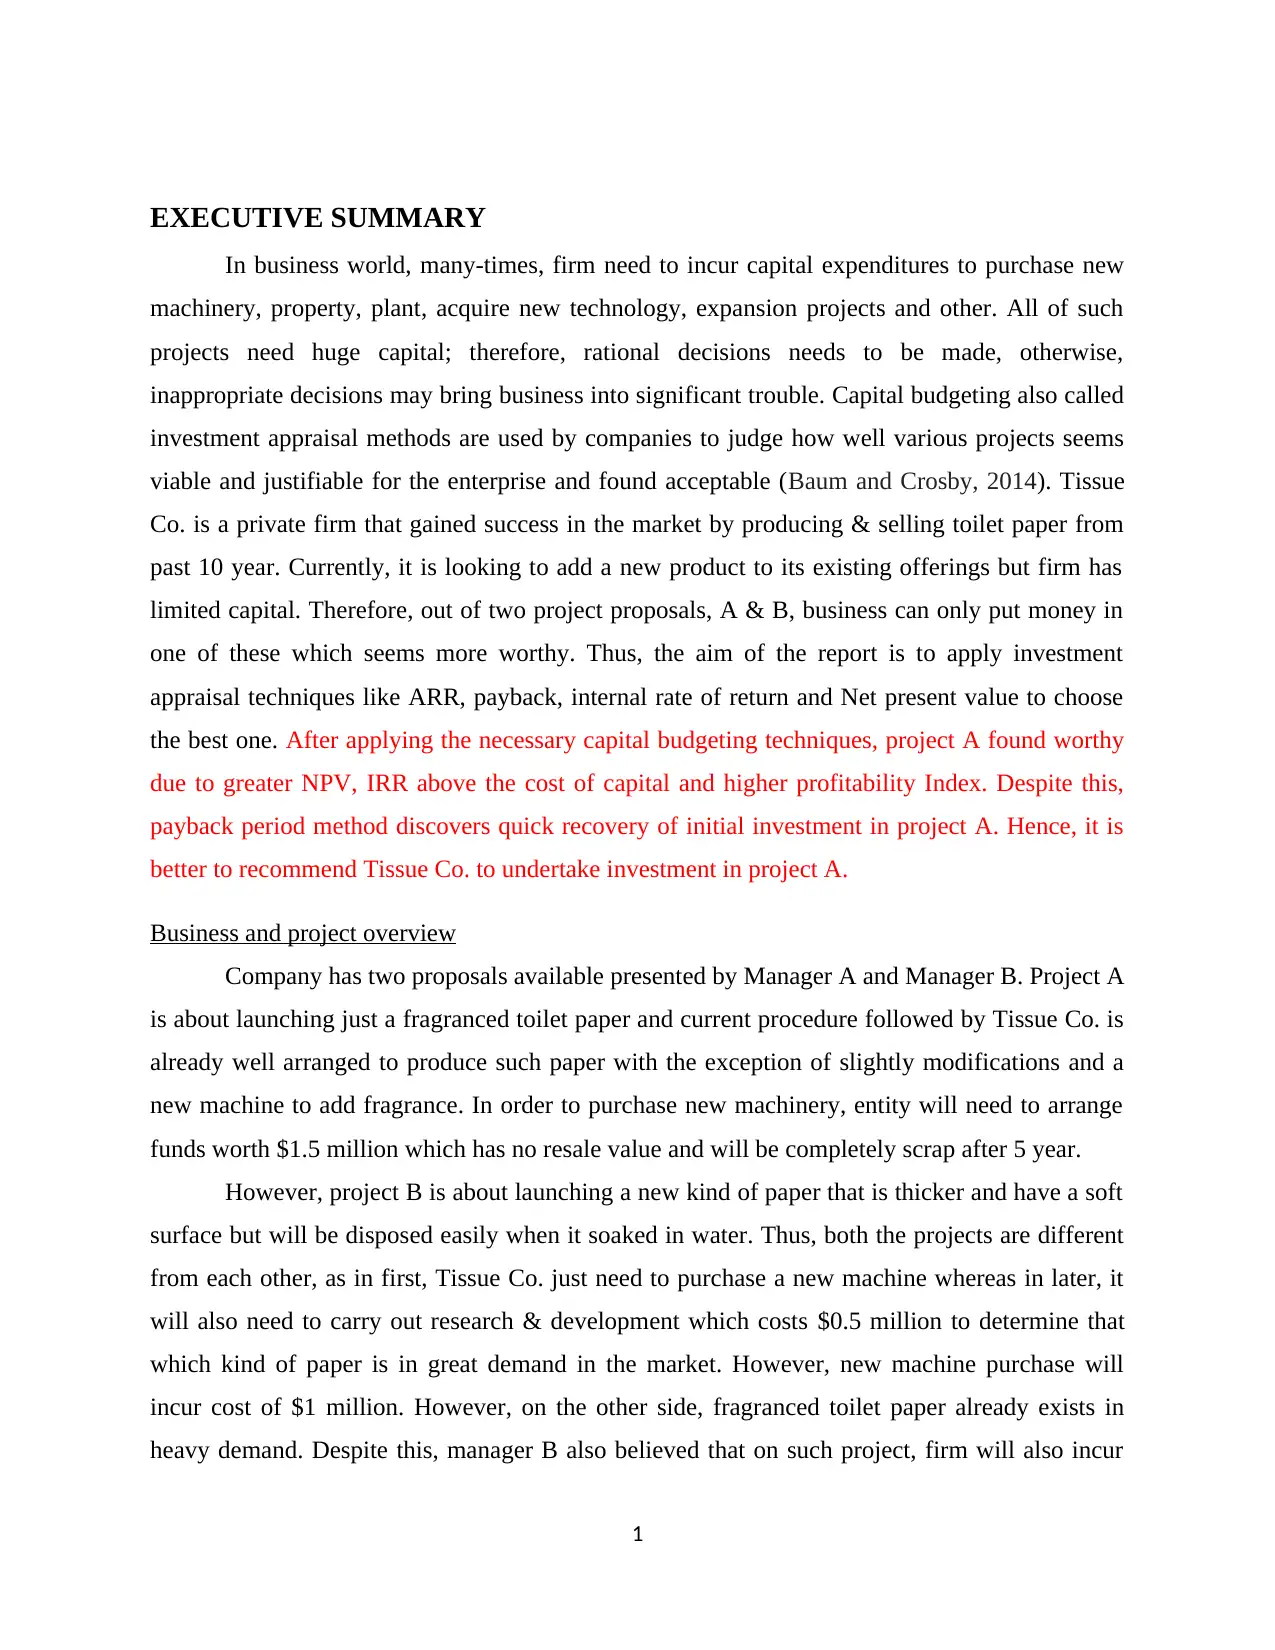
EXECUTIVE SUMMARY
In business world, many-times, firm need to incur capital expenditures to purchase new
machinery, property, plant, acquire new technology, expansion projects and other. All of such
projects need huge capital; therefore, rational decisions needs to be made, otherwise,
inappropriate decisions may bring business into significant trouble. Capital budgeting also called
investment appraisal methods are used by companies to judge how well various projects seems
viable and justifiable for the enterprise and found acceptable (Baum and Crosby, 2014). Tissue
Co. is a private firm that gained success in the market by producing & selling toilet paper from
past 10 year. Currently, it is looking to add a new product to its existing offerings but firm has
limited capital. Therefore, out of two project proposals, A & B, business can only put money in
one of these which seems more worthy. Thus, the aim of the report is to apply investment
appraisal techniques like ARR, payback, internal rate of return and Net present value to choose
the best one. After applying the necessary capital budgeting techniques, project A found worthy
due to greater NPV, IRR above the cost of capital and higher profitability Index. Despite this,
payback period method discovers quick recovery of initial investment in project A. Hence, it is
better to recommend Tissue Co. to undertake investment in project A.
Business and project overview
Company has two proposals available presented by Manager A and Manager B. Project A
is about launching just a fragranced toilet paper and current procedure followed by Tissue Co. is
already well arranged to produce such paper with the exception of slightly modifications and a
new machine to add fragrance. In order to purchase new machinery, entity will need to arrange
funds worth $1.5 million which has no resale value and will be completely scrap after 5 year.
However, project B is about launching a new kind of paper that is thicker and have a soft
surface but will be disposed easily when it soaked in water. Thus, both the projects are different
from each other, as in first, Tissue Co. just need to purchase a new machine whereas in later, it
will also need to carry out research & development which costs $0.5 million to determine that
which kind of paper is in great demand in the market. However, new machine purchase will
incur cost of $1 million. However, on the other side, fragranced toilet paper already exists in
heavy demand. Despite this, manager B also believed that on such project, firm will also incur
1
⊘ This is a preview!⊘
Do you want full access?
Subscribe today to unlock all pages.
Trusted by 1+ million students worldwide
considerable expense on product marketing to aware customers, as a result, in first two years, it
will generate lesser EBIT but after gaining reach in the market, it will become the first mover
and enjoy the benefits of strong sales.
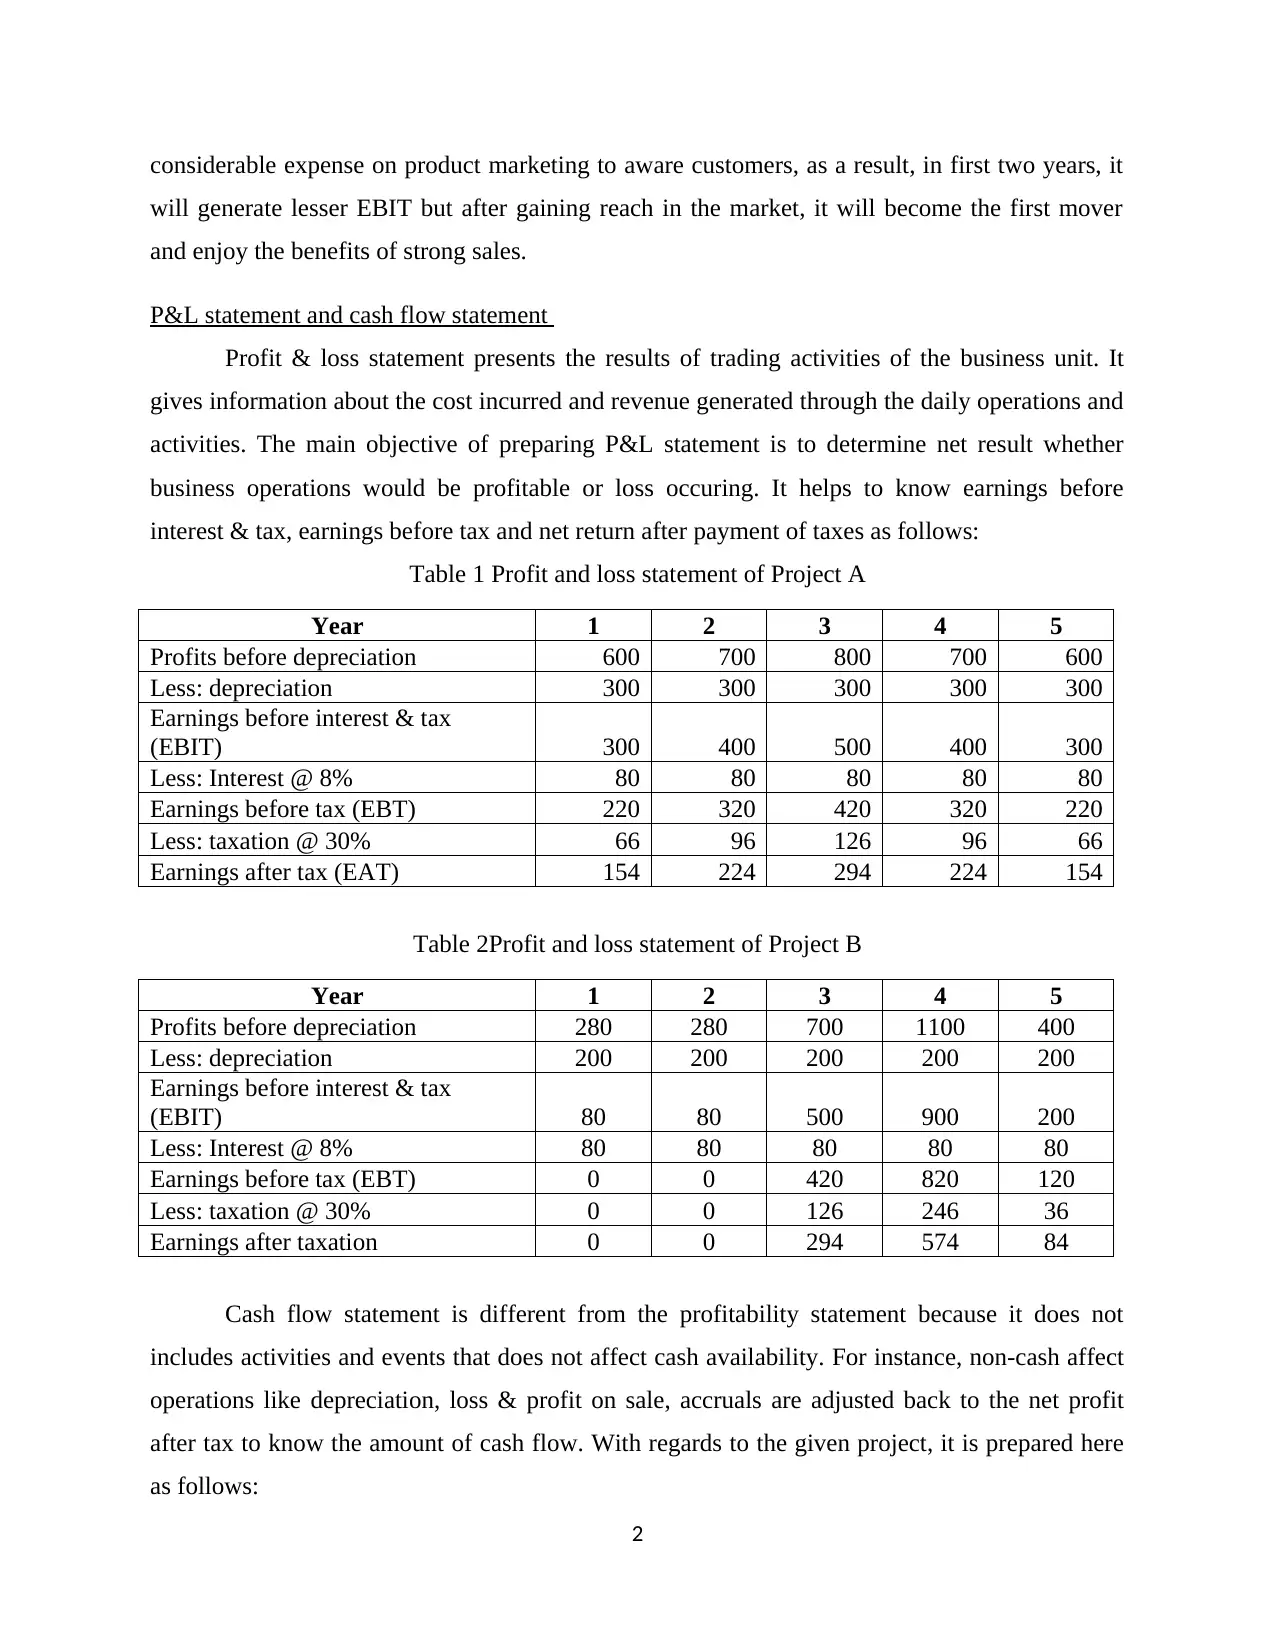
P&L statement and cash flow statement
Profit & loss statement presents the results of trading activities of the business unit. It
gives information about the cost incurred and revenue generated through the daily operations and
activities. The main objective of preparing P&L statement is to determine net result whether
business operations would be profitable or loss occuring. It helps to know earnings before
interest & tax, earnings before tax and net return after payment of taxes as follows:
Table 1 Profit and loss statement of Project A
Year 1 2 3 4 5
Profits before depreciation 600 700 800 700 600
Less: depreciation 300 300 300 300 300
Earnings before interest & tax
(EBIT) 300 400 500 400 300
Less: Interest @ 8% 80 80 80 80 80
Earnings before tax (EBT) 220 320 420 320 220
Less: taxation @ 30% 66 96 126 96 66
Earnings after tax (EAT) 154 224 294 224 154
Table 2Profit and loss statement of Project B
Year 1 2 3 4 5
Profits before depreciation 280 280 700 1100 400
Less: depreciation 200 200 200 200 200
Earnings before interest & tax
(EBIT) 80 80 500 900 200
Less: Interest @ 8% 80 80 80 80 80
Earnings before tax (EBT) 0 0 420 820 120
Less: taxation @ 30% 0 0 126 246 36
Earnings after taxation 0 0 294 574 84
Cash flow statement is different from the profitability statement because it does not
includes activities and events that does not affect cash availability. For instance, non-cash affect
operations like depreciation, loss & profit on sale, accruals are adjusted back to the net profit
after tax to know the amount of cash flow. With regards to the given project, it is prepared here
as follows:
2
will generate lesser EBIT but after gaining reach in the market, it will become the first mover
and enjoy the benefits of strong sales.
P&L statement and cash flow statement
Profit & loss statement presents the results of trading activities of the business unit. It
gives information about the cost incurred and revenue generated through the daily operations and
activities. The main objective of preparing P&L statement is to determine net result whether
business operations would be profitable or loss occuring. It helps to know earnings before
interest & tax, earnings before tax and net return after payment of taxes as follows:
Table 1 Profit and loss statement of Project A
Year 1 2 3 4 5
Profits before depreciation 600 700 800 700 600
Less: depreciation 300 300 300 300 300
Earnings before interest & tax
(EBIT) 300 400 500 400 300
Less: Interest @ 8% 80 80 80 80 80
Earnings before tax (EBT) 220 320 420 320 220
Less: taxation @ 30% 66 96 126 96 66
Earnings after tax (EAT) 154 224 294 224 154
Table 2Profit and loss statement of Project B
Year 1 2 3 4 5
Profits before depreciation 280 280 700 1100 400
Less: depreciation 200 200 200 200 200
Earnings before interest & tax
(EBIT) 80 80 500 900 200
Less: Interest @ 8% 80 80 80 80 80
Earnings before tax (EBT) 0 0 420 820 120
Less: taxation @ 30% 0 0 126 246 36
Earnings after taxation 0 0 294 574 84
Cash flow statement is different from the profitability statement because it does not
includes activities and events that does not affect cash availability. For instance, non-cash affect
operations like depreciation, loss & profit on sale, accruals are adjusted back to the net profit
after tax to know the amount of cash flow. With regards to the given project, it is prepared here
as follows:
2
Paraphrase This Document
Need a fresh take? Get an instant paraphrase of this document with our AI Paraphraser
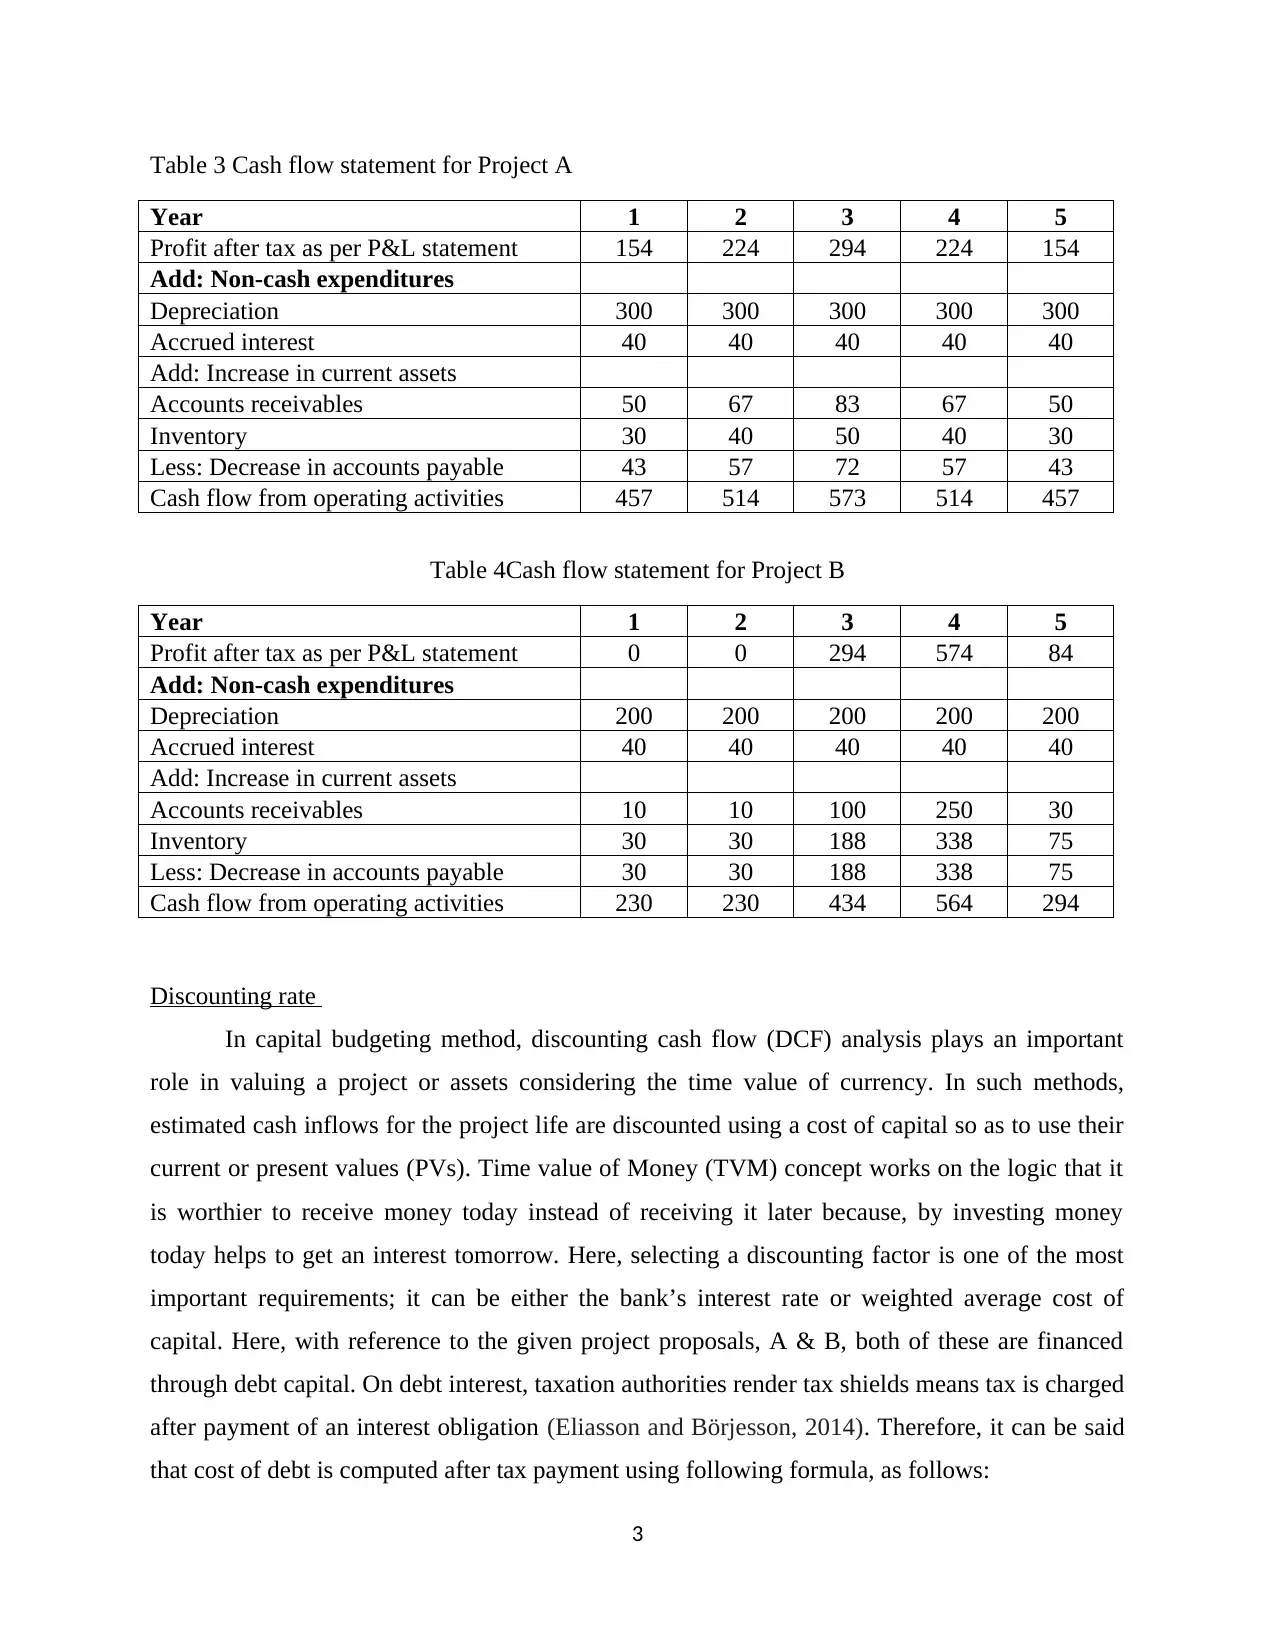
Table 3 Cash flow statement for Project A
Year 1 2 3 4 5
Profit after tax as per P&L statement 154 224 294 224 154
Add: Non-cash expenditures
Depreciation 300 300 300 300 300
Accrued interest 40 40 40 40 40
Add: Increase in current assets
Accounts receivables 50 67 83 67 50
Inventory 30 40 50 40 30
Less: Decrease in accounts payable 43 57 72 57 43
Cash flow from operating activities 457 514 573 514 457
Table 4Cash flow statement for Project B
Year 1 2 3 4 5
Profit after tax as per P&L statement 0 0 294 574 84
Add: Non-cash expenditures
Depreciation 200 200 200 200 200
Accrued interest 40 40 40 40 40
Add: Increase in current assets
Accounts receivables 10 10 100 250 30
Inventory 30 30 188 338 75
Less: Decrease in accounts payable 30 30 188 338 75
Cash flow from operating activities 230 230 434 564 294
Discounting rate
In capital budgeting method, discounting cash flow (DCF) analysis plays an important
role in valuing a project or assets considering the time value of currency. In such methods,
estimated cash inflows for the project life are discounted using a cost of capital so as to use their
current or present values (PVs). Time value of Money (TVM) concept works on the logic that it
is worthier to receive money today instead of receiving it later because, by investing money
today helps to get an interest tomorrow. Here, selecting a discounting factor is one of the most
important requirements; it can be either the bank’s interest rate or weighted average cost of
capital. Here, with reference to the given project proposals, A & B, both of these are financed
through debt capital. On debt interest, taxation authorities render tax shields means tax is charged
after payment of an interest obligation (Eliasson and Börjesson, 2014). Therefore, it can be said
that cost of debt is computed after tax payment using following formula, as follows:
3
Year 1 2 3 4 5
Profit after tax as per P&L statement 154 224 294 224 154
Add: Non-cash expenditures
Depreciation 300 300 300 300 300
Accrued interest 40 40 40 40 40
Add: Increase in current assets
Accounts receivables 50 67 83 67 50
Inventory 30 40 50 40 30
Less: Decrease in accounts payable 43 57 72 57 43
Cash flow from operating activities 457 514 573 514 457
Table 4Cash flow statement for Project B
Year 1 2 3 4 5
Profit after tax as per P&L statement 0 0 294 574 84
Add: Non-cash expenditures
Depreciation 200 200 200 200 200
Accrued interest 40 40 40 40 40
Add: Increase in current assets
Accounts receivables 10 10 100 250 30
Inventory 30 30 188 338 75
Less: Decrease in accounts payable 30 30 188 338 75
Cash flow from operating activities 230 230 434 564 294
Discounting rate
In capital budgeting method, discounting cash flow (DCF) analysis plays an important
role in valuing a project or assets considering the time value of currency. In such methods,
estimated cash inflows for the project life are discounted using a cost of capital so as to use their
current or present values (PVs). Time value of Money (TVM) concept works on the logic that it
is worthier to receive money today instead of receiving it later because, by investing money
today helps to get an interest tomorrow. Here, selecting a discounting factor is one of the most
important requirements; it can be either the bank’s interest rate or weighted average cost of
capital. Here, with reference to the given project proposals, A & B, both of these are financed
through debt capital. On debt interest, taxation authorities render tax shields means tax is charged
after payment of an interest obligation (Eliasson and Börjesson, 2014). Therefore, it can be said
that cost of debt is computed after tax payment using following formula, as follows:
3
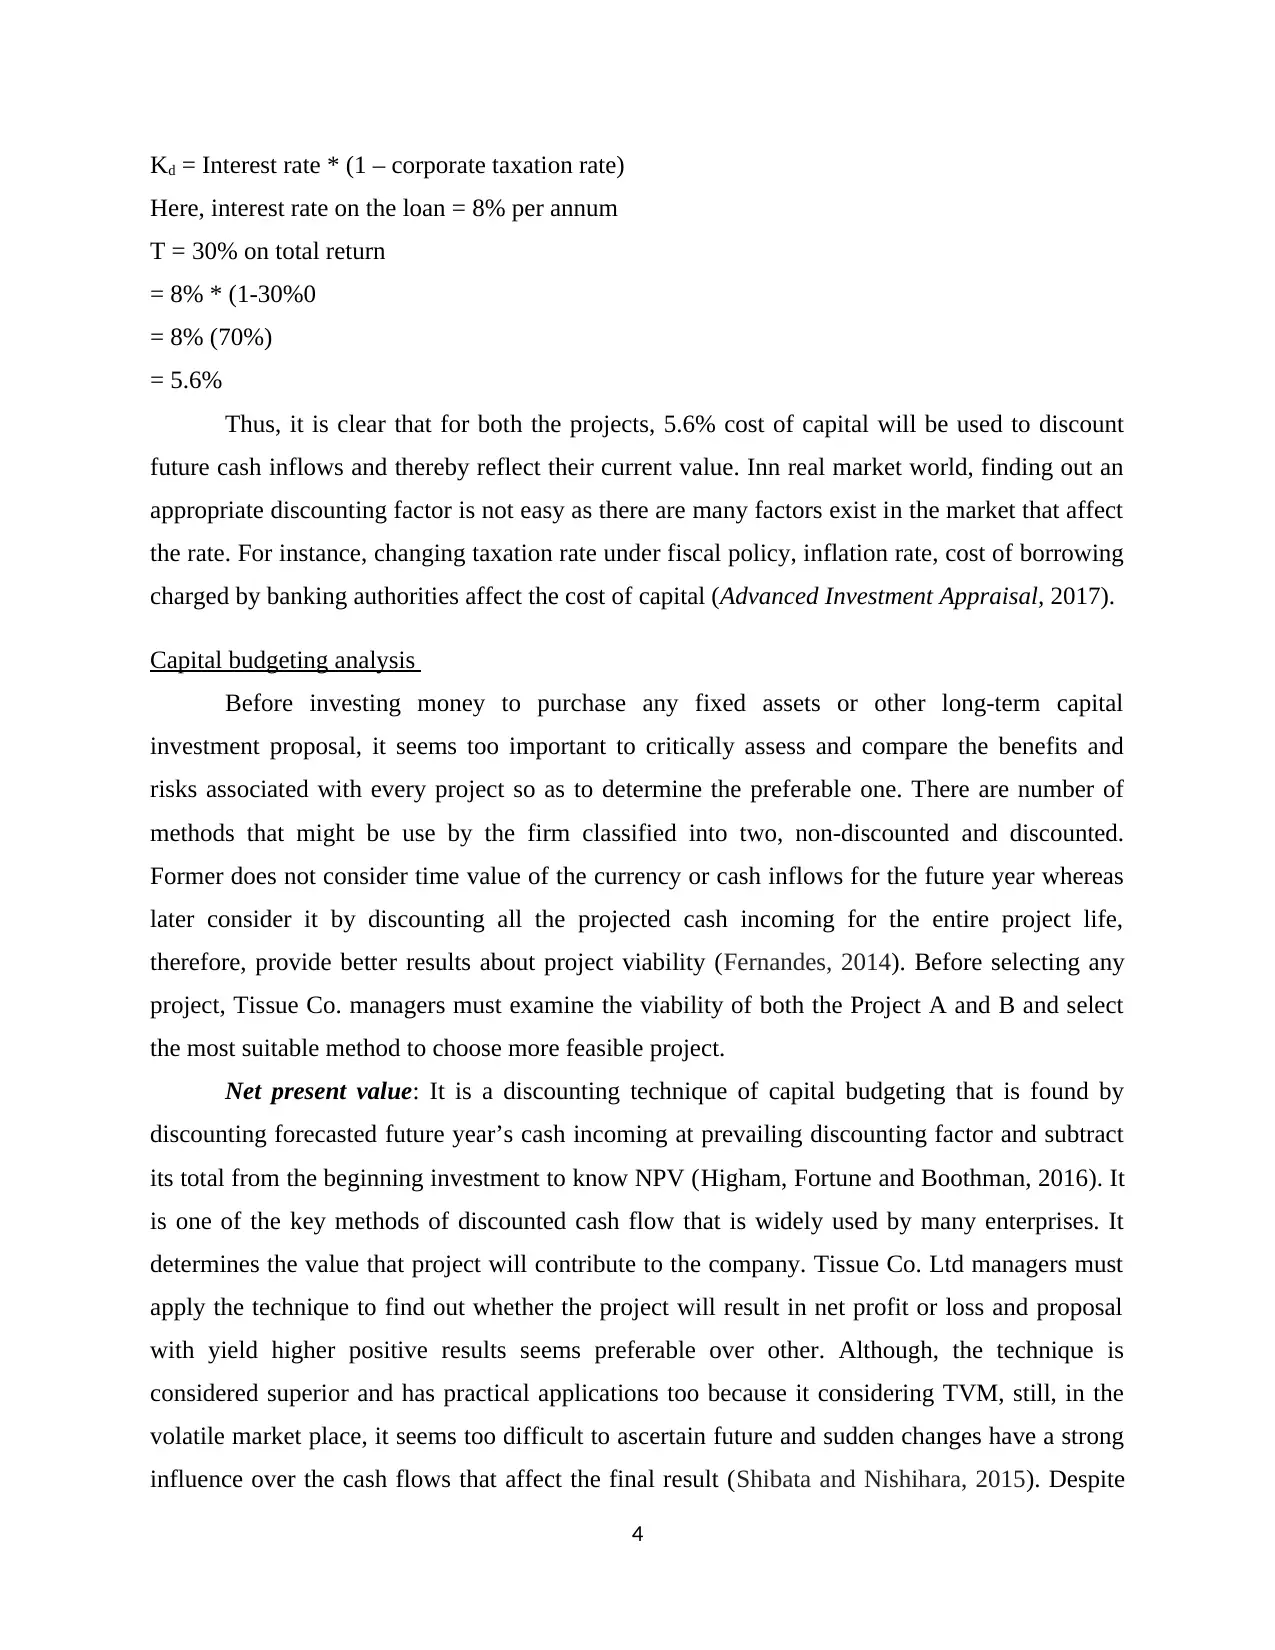
Kd = Interest rate * (1 – corporate taxation rate)
Here, interest rate on the loan = 8% per annum
T = 30% on total return
= 8% * (1-30%0
= 8% (70%)
= 5.6%
Thus, it is clear that for both the projects, 5.6% cost of capital will be used to discount
future cash inflows and thereby reflect their current value. Inn real market world, finding out an
appropriate discounting factor is not easy as there are many factors exist in the market that affect
the rate. For instance, changing taxation rate under fiscal policy, inflation rate, cost of borrowing
charged by banking authorities affect the cost of capital (Advanced Investment Appraisal, 2017).
Capital budgeting analysis
Before investing money to purchase any fixed assets or other long-term capital
investment proposal, it seems too important to critically assess and compare the benefits and
risks associated with every project so as to determine the preferable one. There are number of
methods that might be use by the firm classified into two, non-discounted and discounted.
Former does not consider time value of the currency or cash inflows for the future year whereas
later consider it by discounting all the projected cash incoming for the entire project life,
therefore, provide better results about project viability (Fernandes, 2014). Before selecting any
project, Tissue Co. managers must examine the viability of both the Project A and B and select
the most suitable method to choose more feasible project.
Net present value: It is a discounting technique of capital budgeting that is found by
discounting forecasted future year’s cash incoming at prevailing discounting factor and subtract
its total from the beginning investment to know NPV (Higham, Fortune and Boothman, 2016). It
is one of the key methods of discounted cash flow that is widely used by many enterprises. It
determines the value that project will contribute to the company. Tissue Co. Ltd managers must
apply the technique to find out whether the project will result in net profit or loss and proposal
with yield higher positive results seems preferable over other. Although, the technique is
considered superior and has practical applications too because it considering TVM, still, in the
volatile market place, it seems too difficult to ascertain future and sudden changes have a strong
influence over the cash flows that affect the final result (Shibata and Nishihara, 2015). Despite
4
⊘ This is a preview!⊘
Do you want full access?
Subscribe today to unlock all pages.
Trusted by 1+ million students worldwide
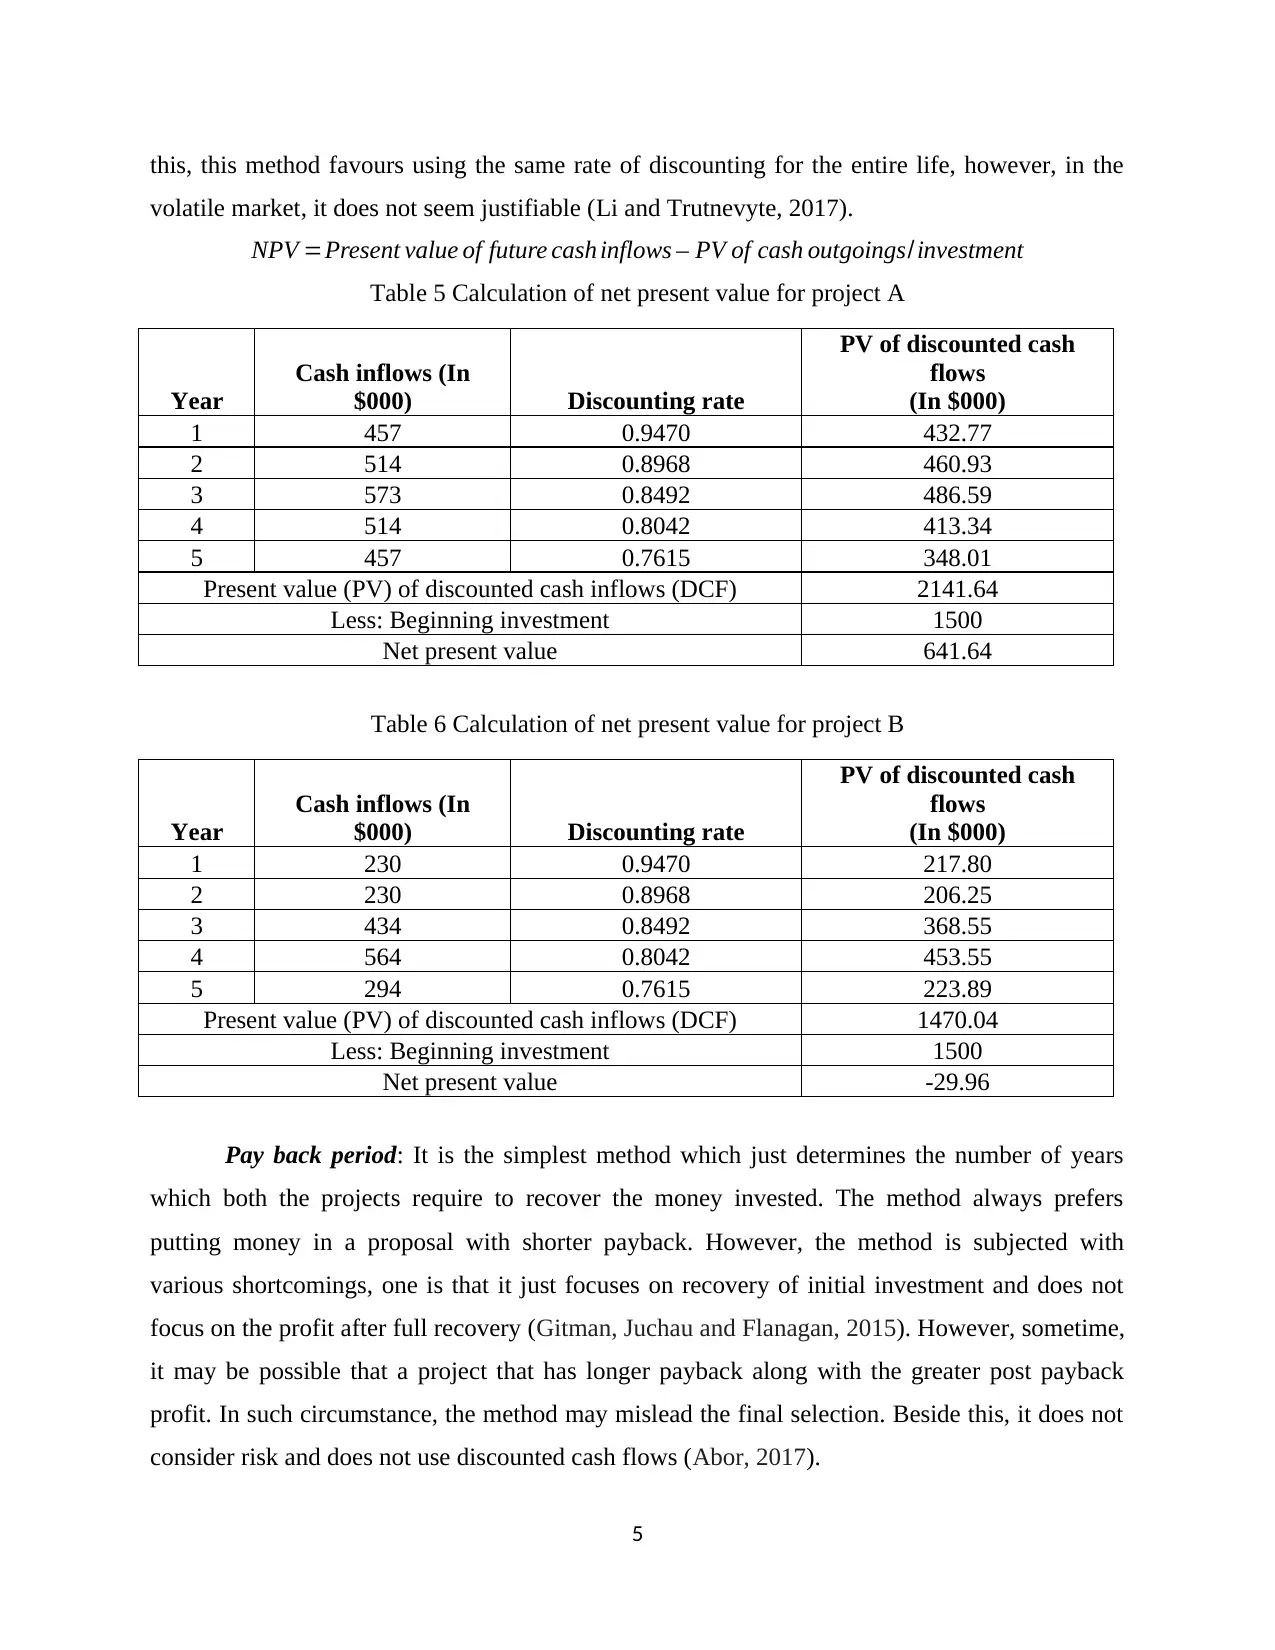
this, this method favours using the same rate of discounting for the entire life, however, in the
volatile market, it does not seem justifiable (Li and Trutnevyte, 2017).
NPV =Present value of future cash inflows – PV of cash outgoings/investment
Table 5 Calculation of net present value for project A
Year
Cash inflows (In
$000) Discounting rate
PV of discounted cash
flows
(In $000)
1 457 0.9470 432.77
2 514 0.8968 460.93
3 573 0.8492 486.59
4 514 0.8042 413.34
5 457 0.7615 348.01
Present value (PV) of discounted cash inflows (DCF) 2141.64
Less: Beginning investment 1500
Net present value 641.64
Table 6 Calculation of net present value for project B
Year
Cash inflows (In
$000) Discounting rate
PV of discounted cash
flows
(In $000)
1 230 0.9470 217.80
2 230 0.8968 206.25
3 434 0.8492 368.55
4 564 0.8042 453.55
5 294 0.7615 223.89
Present value (PV) of discounted cash inflows (DCF) 1470.04
Less: Beginning investment 1500
Net present value -29.96
Pay back period: It is the simplest method which just determines the number of years
which both the projects require to recover the money invested. The method always prefers
putting money in a proposal with shorter payback. However, the method is subjected with
various shortcomings, one is that it just focuses on recovery of initial investment and does not
focus on the profit after full recovery (Gitman, Juchau and Flanagan, 2015). However, sometime,
it may be possible that a project that has longer payback along with the greater post payback
profit. In such circumstance, the method may mislead the final selection. Beside this, it does not
consider risk and does not use discounted cash flows (Abor, 2017).
5
Paraphrase This Document
Need a fresh take? Get an instant paraphrase of this document with our AI Paraphraser
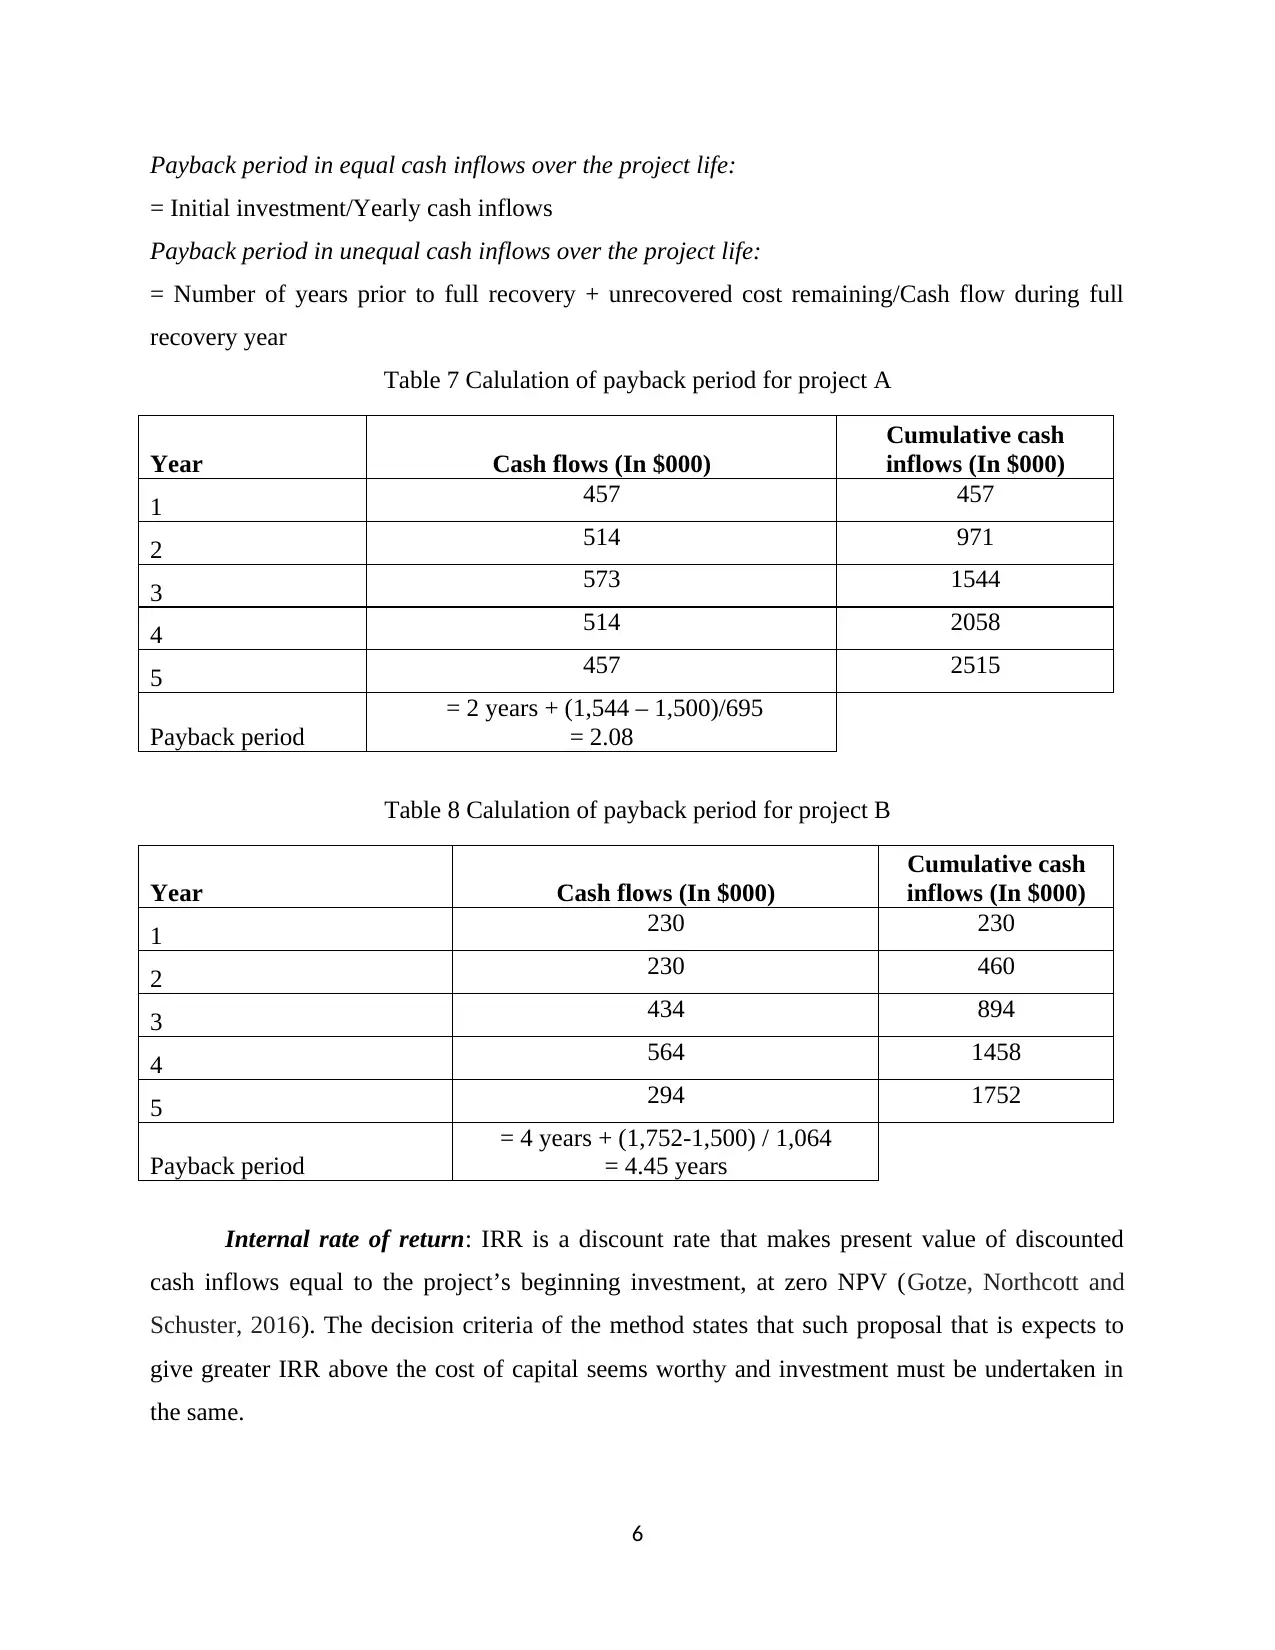
Payback period in equal cash inflows over the project life:
= Initial investment/Yearly cash inflows
Payback period in unequal cash inflows over the project life:
= Number of years prior to full recovery + unrecovered cost remaining/Cash flow during full
recovery year
Table 7 Calulation of payback period for project A
Year Cash flows (In $000)
Cumulative cash
inflows (In $000)
1 457 457
2 514 971
3 573 1544
4 514 2058
5 457 2515
Payback period
= 2 years + (1,544 – 1,500)/695
= 2.08
Table 8 Calulation of payback period for project B
Year Cash flows (In $000)
Cumulative cash
inflows (In $000)
1 230 230
2 230 460
3 434 894
4 564 1458
5 294 1752
Payback period
= 4 years + (1,752-1,500) / 1,064
= 4.45 years
Internal rate of return: IRR is a discount rate that makes present value of discounted
cash inflows equal to the project’s beginning investment, at zero NPV (Gotze, Northcott and
Schuster, 2016). The decision criteria of the method states that such proposal that is expects to
give greater IRR above the cost of capital seems worthy and investment must be undertaken in
the same.
6
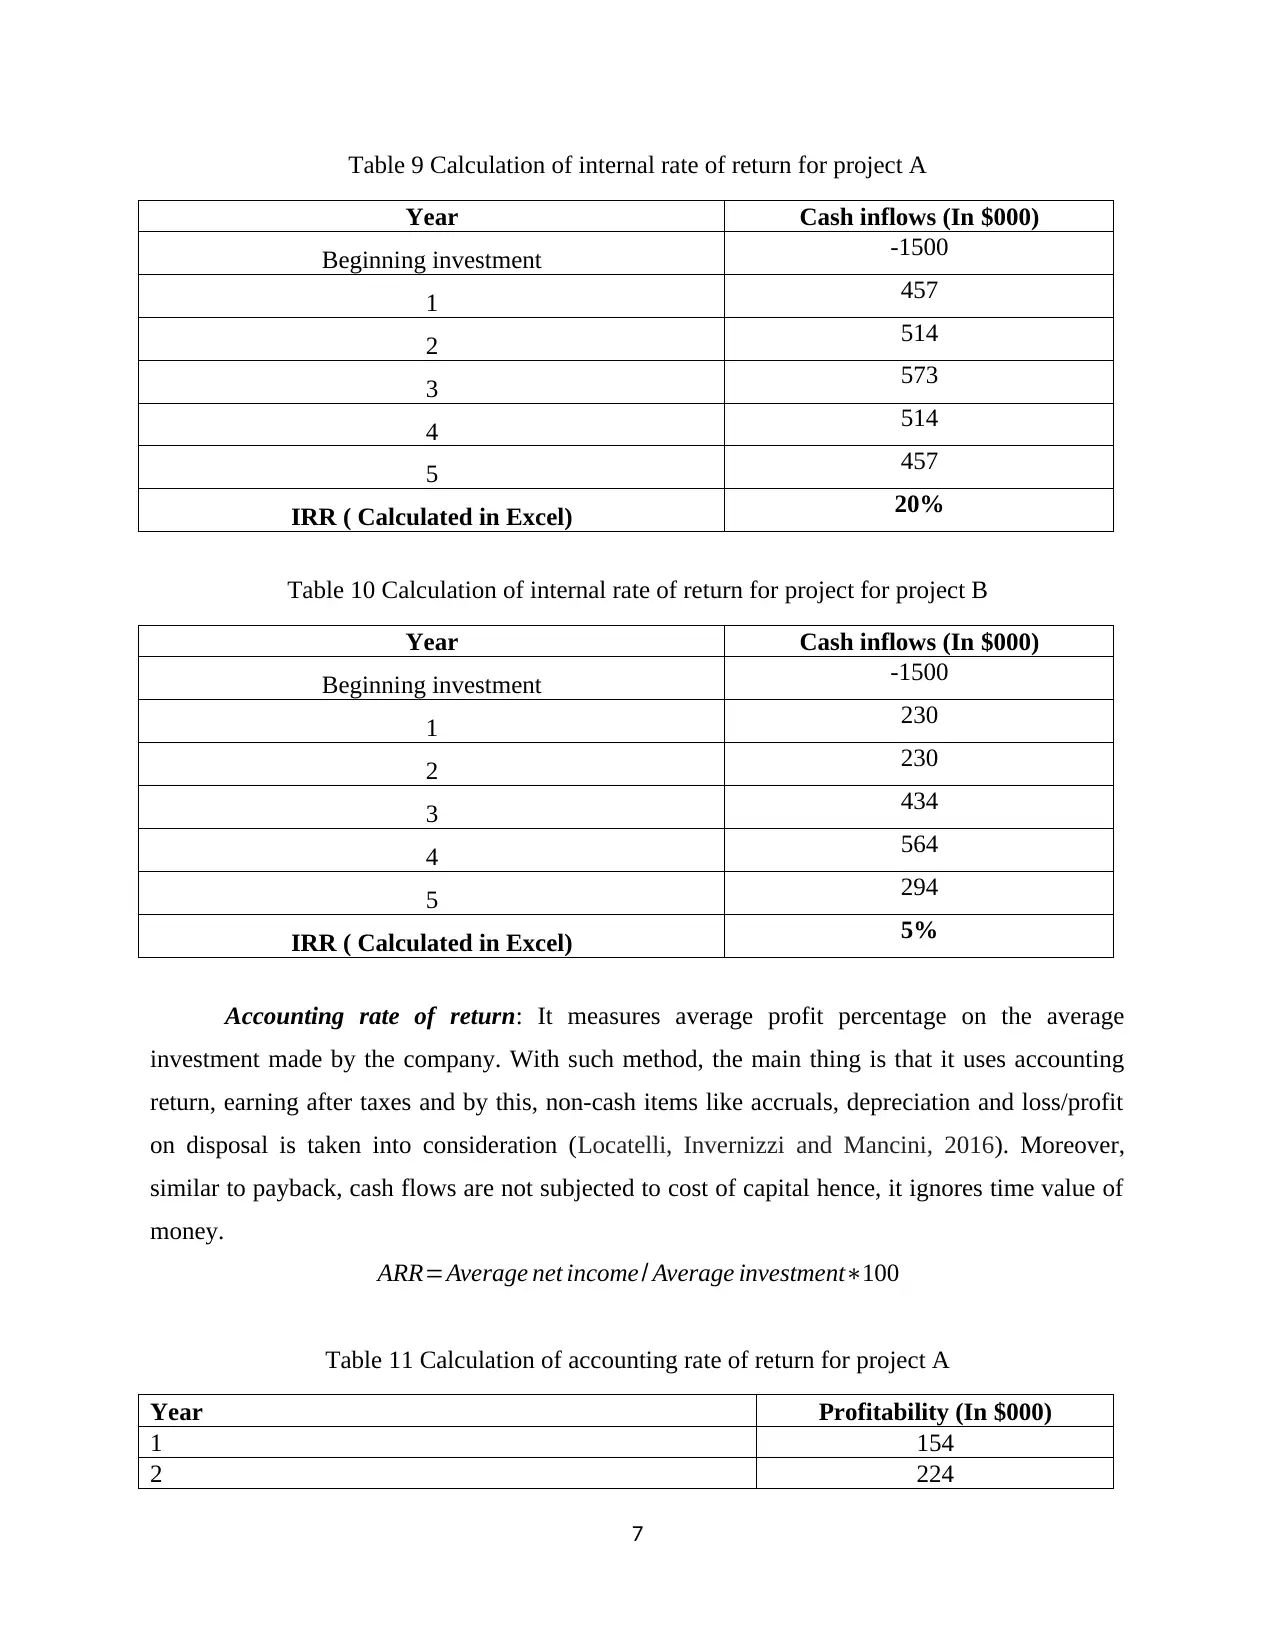
Table 9 Calculation of internal rate of return for project A
Year Cash inflows (In $000)
Beginning investment -1500
1 457
2 514
3 573
4 514
5 457
IRR ( Calculated in Excel) 20%
Table 10 Calculation of internal rate of return for project for project B
Year Cash inflows (In $000)
Beginning investment -1500
1 230
2 230
3 434
4 564
5 294
IRR ( Calculated in Excel) 5%
Accounting rate of return: It measures average profit percentage on the average
investment made by the company. With such method, the main thing is that it uses accounting
return, earning after taxes and by this, non-cash items like accruals, depreciation and loss/profit
on disposal is taken into consideration (Locatelli, Invernizzi and Mancini, 2016). Moreover,
similar to payback, cash flows are not subjected to cost of capital hence, it ignores time value of
money.
ARR=Average net income / Average investment∗100
Table 11 Calculation of accounting rate of return for project A
Year Profitability (In $000)
1 154
2 224
7
Year Cash inflows (In $000)
Beginning investment -1500
1 457
2 514
3 573
4 514
5 457
IRR ( Calculated in Excel) 20%
Table 10 Calculation of internal rate of return for project for project B
Year Cash inflows (In $000)
Beginning investment -1500
1 230
2 230
3 434
4 564
5 294
IRR ( Calculated in Excel) 5%
Accounting rate of return: It measures average profit percentage on the average
investment made by the company. With such method, the main thing is that it uses accounting
return, earning after taxes and by this, non-cash items like accruals, depreciation and loss/profit
on disposal is taken into consideration (Locatelli, Invernizzi and Mancini, 2016). Moreover,
similar to payback, cash flows are not subjected to cost of capital hence, it ignores time value of
money.
ARR=Average net income / Average investment∗100
Table 11 Calculation of accounting rate of return for project A
Year Profitability (In $000)
1 154
2 224
7
⊘ This is a preview!⊘
Do you want full access?
Subscribe today to unlock all pages.
Trusted by 1+ million students worldwide
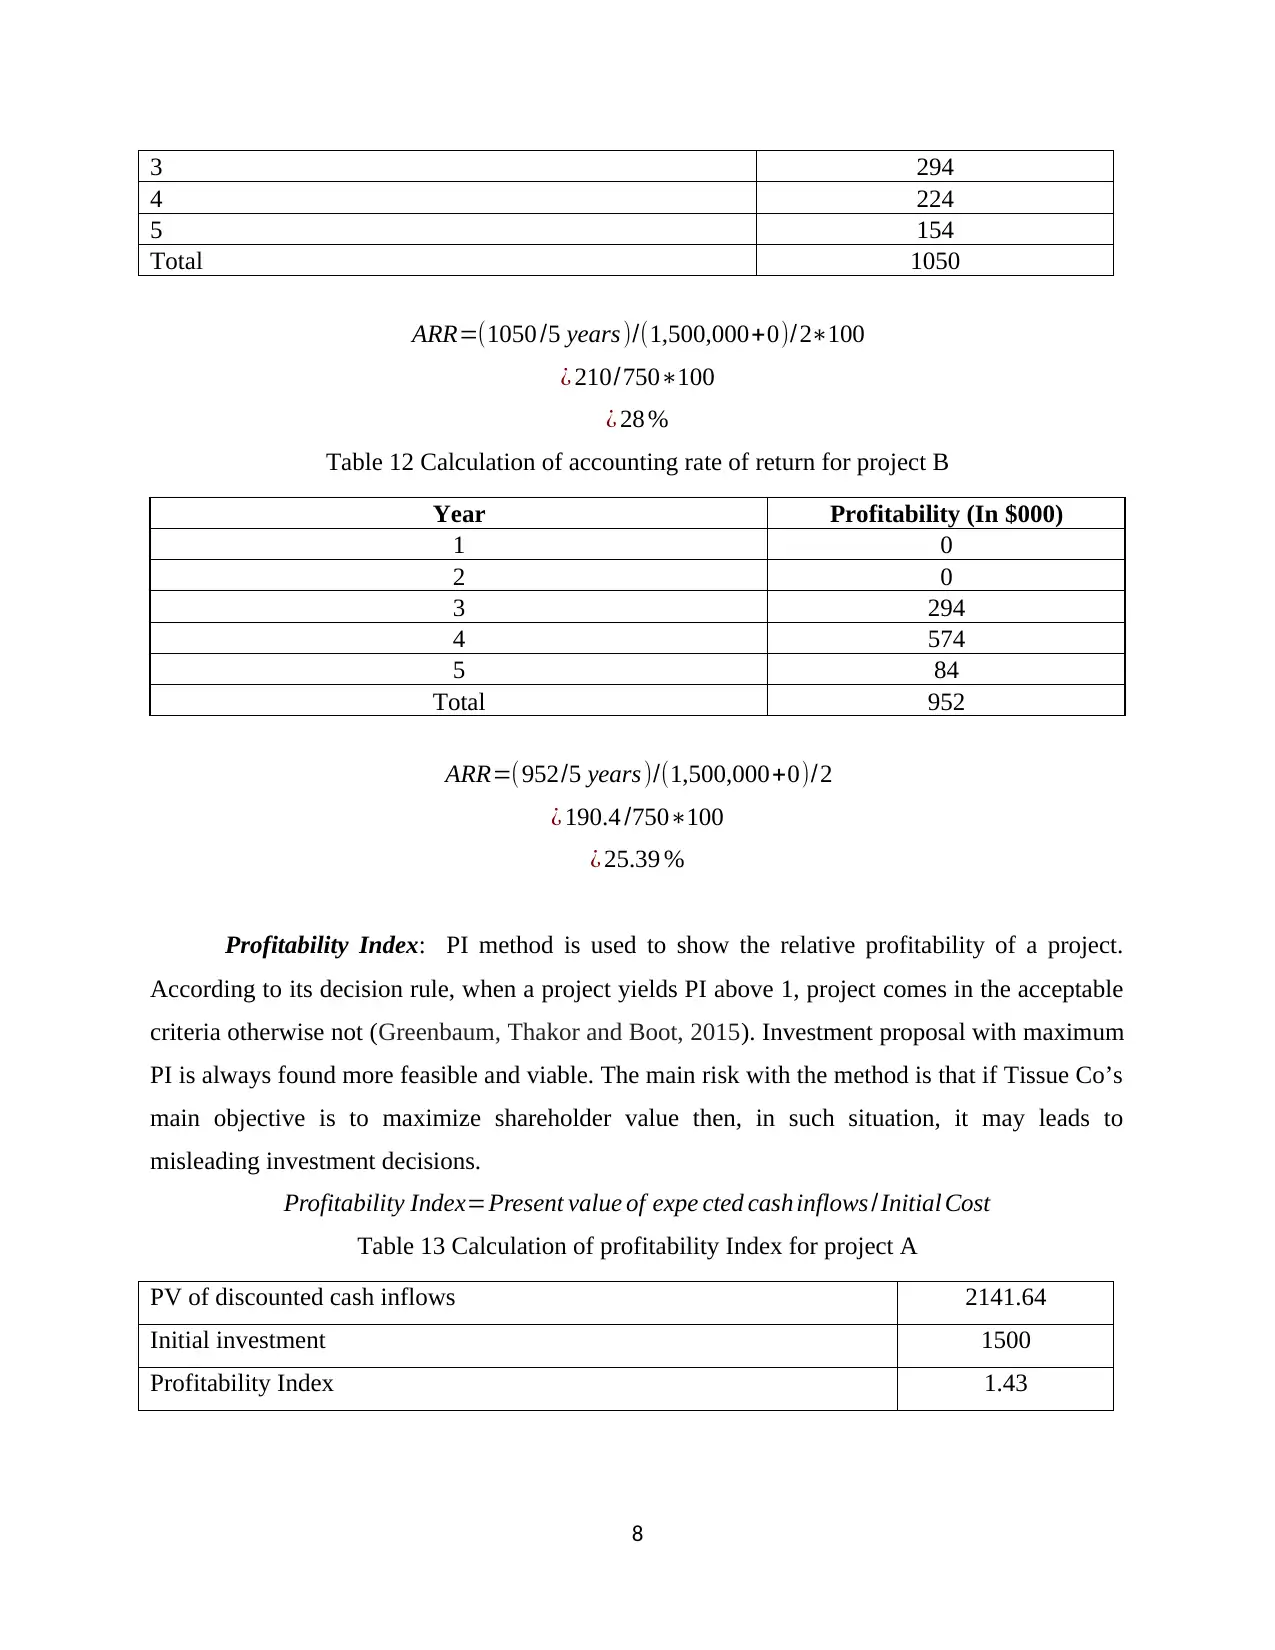
3 294
4 224
5 154
Total 1050
ARR=(1050 /5 years )/(1,500,000+0)/2∗100
¿ 210/750∗100
¿ 28 %
Table 12 Calculation of accounting rate of return for project B
Year Profitability (In $000)
1 0
2 0
3 294
4 574
5 84
Total 952
ARR=(952/5 years)/(1,500,000+0)/2
¿ 190.4 /750∗100
¿ 25.39 %
Profitability Index: PI method is used to show the relative profitability of a project.
According to its decision rule, when a project yields PI above 1, project comes in the acceptable
criteria otherwise not (Greenbaum, Thakor and Boot, 2015). Investment proposal with maximum
PI is always found more feasible and viable. The main risk with the method is that if Tissue Co’s
main objective is to maximize shareholder value then, in such situation, it may leads to
misleading investment decisions.
Profitability Index=Present value of expe cted cash inflows /Initial Cost
Table 13 Calculation of profitability Index for project A
PV of discounted cash inflows 2141.64
Initial investment 1500
Profitability Index 1.43
8
Paraphrase This Document
Need a fresh take? Get an instant paraphrase of this document with our AI Paraphraser
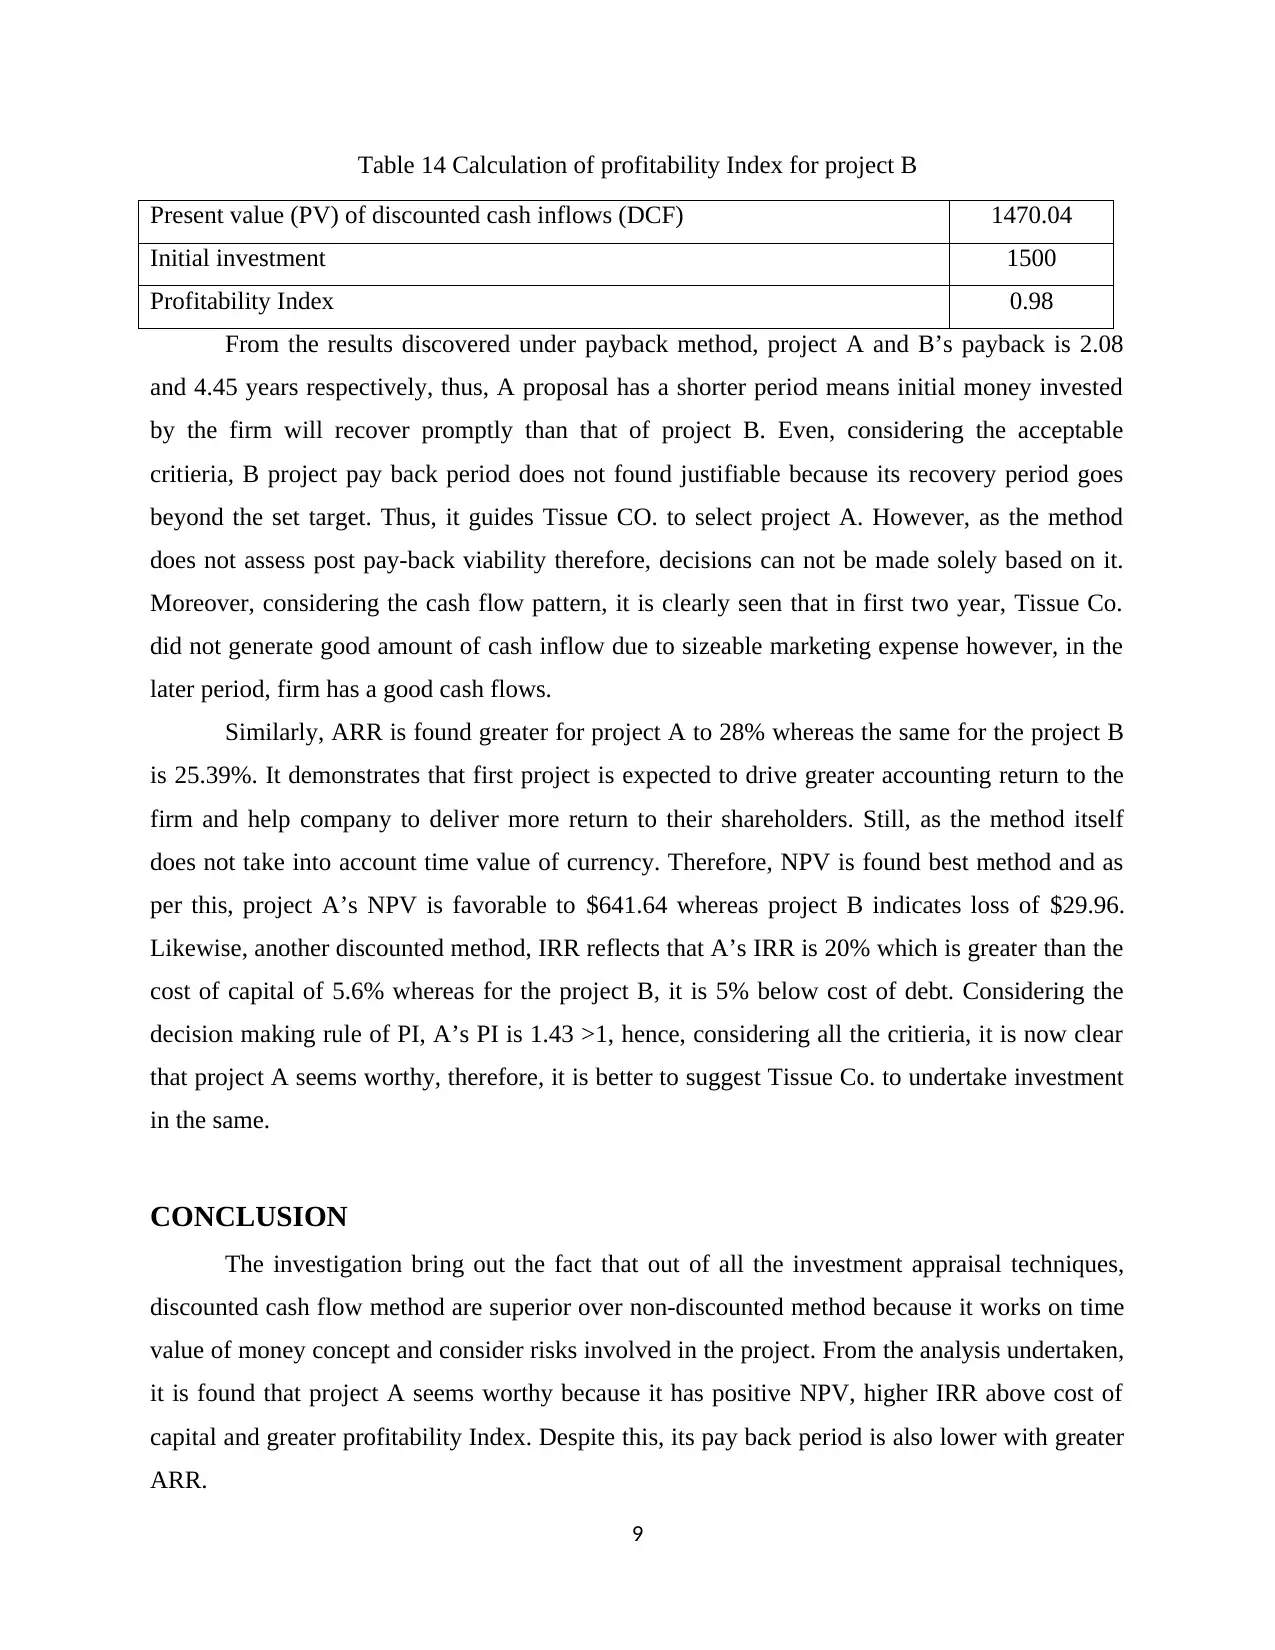
Table 14 Calculation of profitability Index for project B
Present value (PV) of discounted cash inflows (DCF) 1470.04
Initial investment 1500
Profitability Index 0.98
From the results discovered under payback method, project A and B’s payback is 2.08
and 4.45 years respectively, thus, A proposal has a shorter period means initial money invested
by the firm will recover promptly than that of project B. Even, considering the acceptable
critieria, B project pay back period does not found justifiable because its recovery period goes
beyond the set target. Thus, it guides Tissue CO. to select project A. However, as the method
does not assess post pay-back viability therefore, decisions can not be made solely based on it.
Moreover, considering the cash flow pattern, it is clearly seen that in first two year, Tissue Co.
did not generate good amount of cash inflow due to sizeable marketing expense however, in the
later period, firm has a good cash flows.
Similarly, ARR is found greater for project A to 28% whereas the same for the project B
is 25.39%. It demonstrates that first project is expected to drive greater accounting return to the
firm and help company to deliver more return to their shareholders. Still, as the method itself
does not take into account time value of currency. Therefore, NPV is found best method and as
per this, project A’s NPV is favorable to $641.64 whereas project B indicates loss of $29.96.
Likewise, another discounted method, IRR reflects that A’s IRR is 20% which is greater than the
cost of capital of 5.6% whereas for the project B, it is 5% below cost of debt. Considering the
decision making rule of PI, A’s PI is 1.43 >1, hence, considering all the critieria, it is now clear
that project A seems worthy, therefore, it is better to suggest Tissue Co. to undertake investment
in the same.
CONCLUSION
The investigation bring out the fact that out of all the investment appraisal techniques,
discounted cash flow method are superior over non-discounted method because it works on time
value of money concept and consider risks involved in the project. From the analysis undertaken,
it is found that project A seems worthy because it has positive NPV, higher IRR above cost of
capital and greater profitability Index. Despite this, its pay back period is also lower with greater
ARR.
9

10
⊘ This is a preview!⊘
Do you want full access?
Subscribe today to unlock all pages.
Trusted by 1+ million students worldwide
1 out of 13
Related Documents


Your All-in-One AI-Powered Toolkit for Academic Success.
+13062052269
info@desklib.com
Available 24*7 on WhatsApp / Email
![[object Object]](/_next/static/media/star-bottom.7253800d.svg)
Unlock your academic potential
Copyright © 2020–2026 A2Z Services. All Rights Reserved. Developed and managed by ZUCOL.