Project B: Strategic Management Analysis for Car Manufacturing Firm
VerifiedAdded on 2023/06/10
|22
|7323
|146
Project
AI Summary
This project report analyzes the strategic management decisions of a car manufacturing company aiming to enter the European hybrid and electric automobile market. The project evaluates the company's performance over four rounds, focusing on key performance indicators (KPIs) such as net profit, strike rate, CO2 emissions, and market share. The report details the decision-making processes in each round, including pricing strategies, workforce management, and R&D investments. It examines the forecasts and actual results, highlighting successes and failures in achieving the company's objectives. The analysis covers financial decisions, marketing strategies, operational decisions, and human resource management, providing a comprehensive overview of the company's competitive advantage. The report concludes with an evaluation of team performance and a personal reflection on the author's role within the team.

Project B Strategic Management for
Competitive Advantage
Competitive Advantage
Paraphrase This Document
Need a fresh take? Get an instant paraphrase of this document with our AI Paraphraser
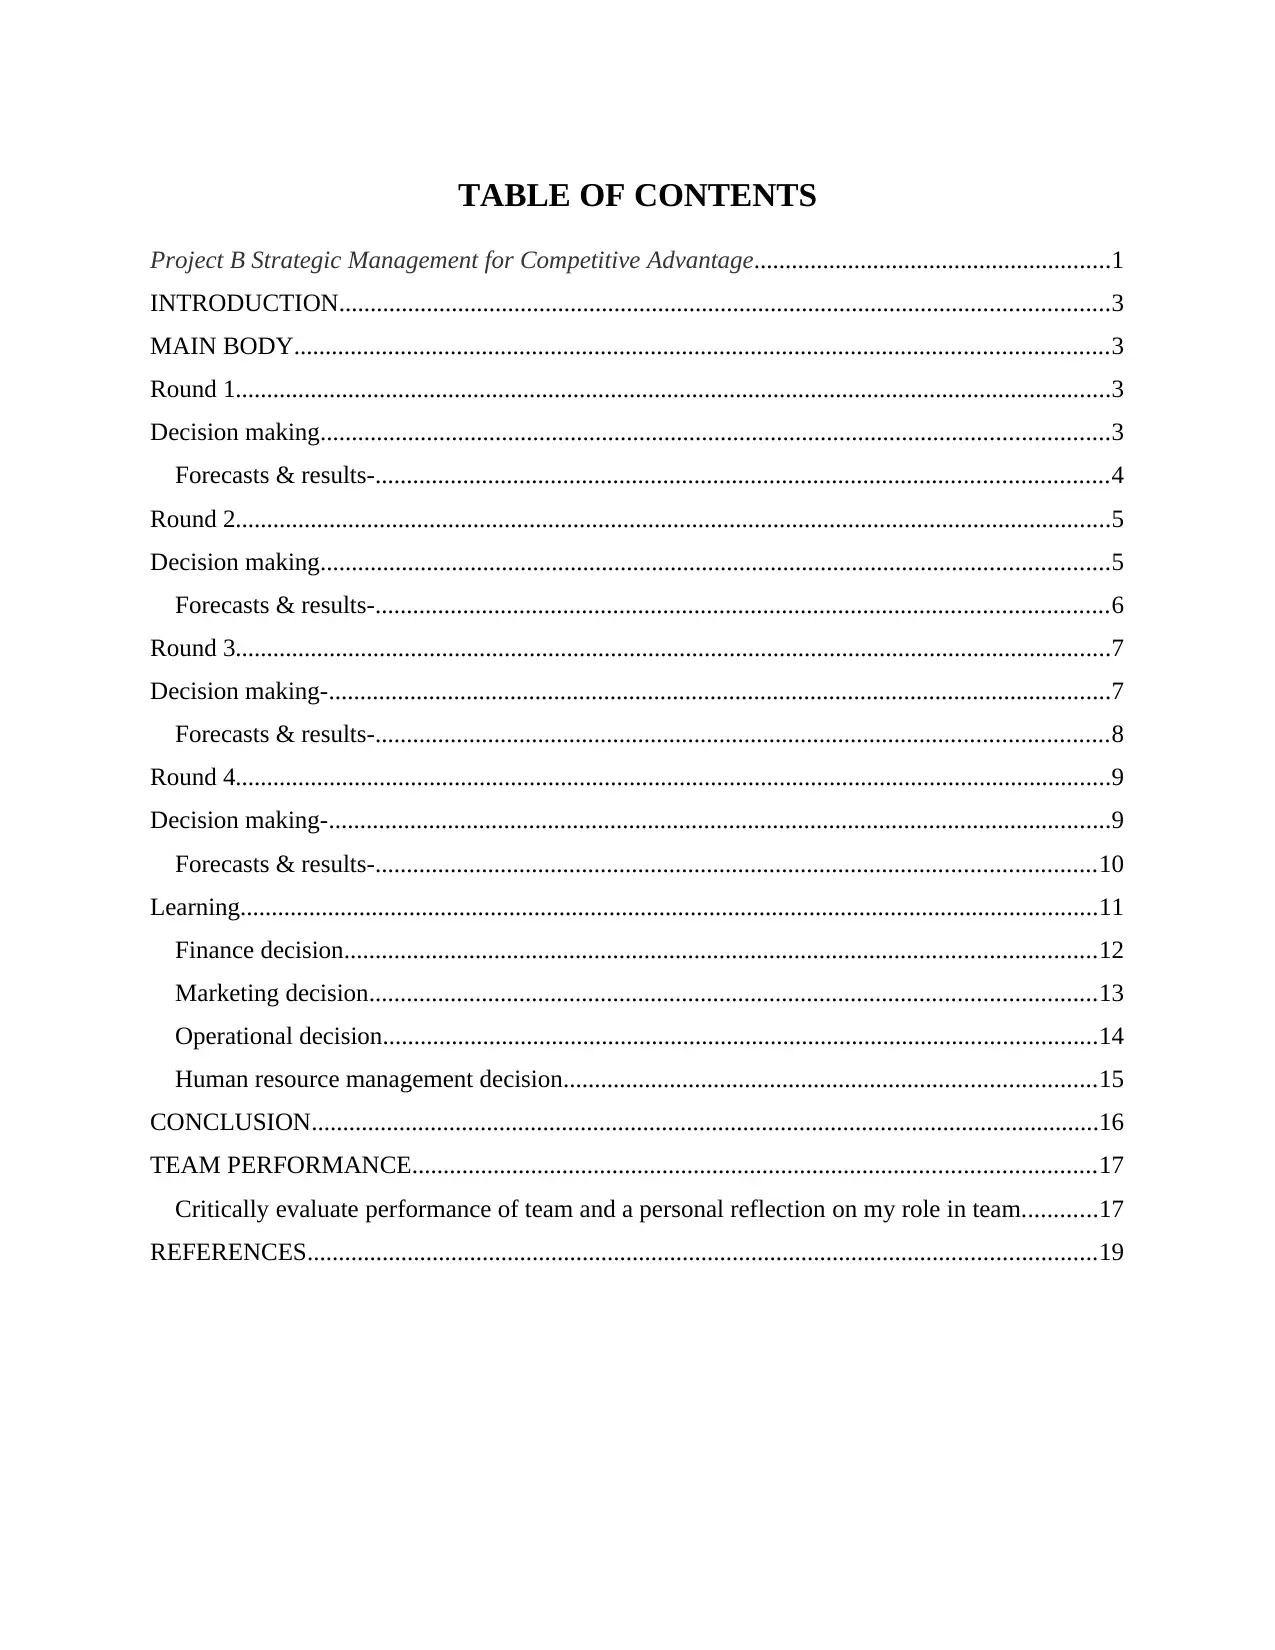
TABLE OF CONTENTS
Project B Strategic Management for Competitive Advantage.........................................................1
INTRODUCTION...........................................................................................................................3
MAIN BODY..................................................................................................................................3
Round 1............................................................................................................................................3
Decision making..............................................................................................................................3
Forecasts & results-.....................................................................................................................4
Round 2............................................................................................................................................5
Decision making..............................................................................................................................5
Forecasts & results-.....................................................................................................................6
Round 3............................................................................................................................................7
Decision making-.............................................................................................................................7
Forecasts & results-.....................................................................................................................8
Round 4............................................................................................................................................9
Decision making-.............................................................................................................................9
Forecasts & results-...................................................................................................................10
Learning.........................................................................................................................................11
Finance decision........................................................................................................................12
Marketing decision....................................................................................................................13
Operational decision..................................................................................................................14
Human resource management decision.....................................................................................15
CONCLUSION..............................................................................................................................16
TEAM PERFORMANCE.............................................................................................................17
Critically evaluate performance of team and a personal reflection on my role in team............17
REFERENCES..............................................................................................................................19
INTRODUCTION
In this study, an organization which is a car manufacturing organization aimed to enter in
the European hybrid and electric automobile market. The major business objectives are
associated with the increasing the net profit, reducing the strike rate, reducing the Co2 emission
and increasing the market share.
In the four years, organization has mainly achieved the most of the potential objectives.
However, with respect to the emission of CO2 there was no KPI measure has been performed.
The company has earned effective profit in the four years excluding the first year. The total sales
of the organization have been effectively increased that has provided the higher value to the
shareholders of the firm. Furthermore, the company has sold its cars without having any stock.
Overall, the company has been proven effective enough in terms of achieving its objectives
within holding the effective cash position and within refunding the total loan at the end of the
round four.
Rounds Total sales
(£m)
Total unsold
stock
(£m)
Round 1 2408.96 0
Round 2 3809.25 0
Round 3 3809.25 0
Round 4 5112.85 0
MAIN BODY
Round 1
Decision making
The organization is a car manufacturing entity so for the first round in-depth attention have
been paid in order to make the plan successful and feasible. For the first round there were two
models of car were decided. For City model the name of car was Galore and for Large model
Xpress.
⊘ This is a preview!⊘
Do you want full access?
Subscribe today to unlock all pages.
Trusted by 1+ million students worldwide
The work force was decided to be 1500 and 1000, at the same time for hiking sales in the
market the selling price was decided to be 16224 and 28295 so can attract the customers.
Since the entity is coming in the market very first time, keeping this point in mind the target
was decided in a range. For the Galore car 25-40 and for Xpress car 41-50 units were decided.
The decision with respect to finance the entity paid attention to the prevailing circumstance of
the market and raised around 180 million funds as loan Faria, et al. (2021)
If see some other realm where it was essential to fabricate proper plan so can guide the
business, such as expenditures in R&D, training cost etc. the main aim behind these decision was
brining competency in the organization so can give tough completion to the competitors in the
market.
Forecasts & results-
The entity had taken some decision and along with it forecasted KPMs, in order to make the
plan feasible. With this regard as it has forecasted target units and selling amount, these
components had been same as intended. The selling price was 16224 and 28295 for both cars
which was pre-decided.
But one of the biggest failure for the entity was its market share, it has planned to keep share
around 1.43% and 1.95% for Galore and Xpress cars but in reality they just found it 1.34% and
1.83%, this is a serious matter of contemplation.
Some other Key Performance Measures for instance salary, strike days were as same as
forecasted. But there was a bit shuffle in Gross Margin. For Galore, it surged to 35.68% whereas
it was planned to be 35%, and for Xpress car it came down to 24.63% in reality whereas it was
forecasted to be 28% so this was one of the salient jeopardy Brundage, et al. (2018, June)
The entity has forecasted its R&D expenditures to be around 20 million but resulted to
18.45% which is a severe issue since the market is very competitive and with less share of
market it is not possible to performance better with less investments in R&D.
At the end the warranty claim cost surged to 31.69 million in reality wears intended to be
28.02 but the profitability of the round 1 is admirable. Operating profits had been 195.15 million
in actual rather planned to be 190 million, on the other hands the Post Tax Profit was 139.8
million which was forecasted to 130 million. So altogether it can be concluded that the
performance had been satisfactory.
Paraphrase This Document
Need a fresh take? Get an instant paraphrase of this document with our AI Paraphraser

Round 1
Forecast Result
Model City Large City Large
Car Name Galore Xpress Galore Xpress
Target 25-40 41-50 25-40 41-50
Workforce 1500 1000 1500 1000
Automation Allocation 60 40 60 40
Effective Workforce 1560 1040 1560 1040
Productivity 46.67 45 46.67 45
Unsold Stock 0 0 0 0
Selling Price(£) 16224 28295 16224 28295
Market Share(%) 1.43 1.95 1.34 1.83
Salary 500 500
Stike Days 4 4
Gross Margine(%) 35 28 35.68 27.63
Sale Income (£m) 2408.96 2408.96
Net Cash Position(£m) 1652.03 1652.03
Fixed Overheads(£m) 156.63 156.63
Promotion(£m) 261 261
R&D(£m) 20 18.45
Training Cost(£m) 5 5
Automation Investment(£m) 20 20
Warranty Claim Cost(£m) 28.02 31.69
Depreciation(£m) 69 69
Operating Profit(£m) 190 195.15
Post Tax Profit(£m) 130 139.8
Loan(£m) 180
Round 2
Decision making
Keeping performance and trends of KPMs into focus, some radical decisions were made in
order to enhance performance of the organization and also hiking its profitability capacity.
Seeing better performance in the market it was decided that Galore cars would be kept
below 25 units and Xpress cars would be more than 55, it might have decided to raise market
share. Along with change in target unit the decision was made about price, in the first round the
prices were kept to 16224 and 28295 but this time it has been 18000 and 27990.
This time the aim of grabbing market share was also hiked so can guide the entity to attain
its potential. With this regard the market share for Galore was decided to be 1.95% and for
⊘ This is a preview!⊘
Do you want full access?
Subscribe today to unlock all pages.
Trusted by 1+ million students worldwide
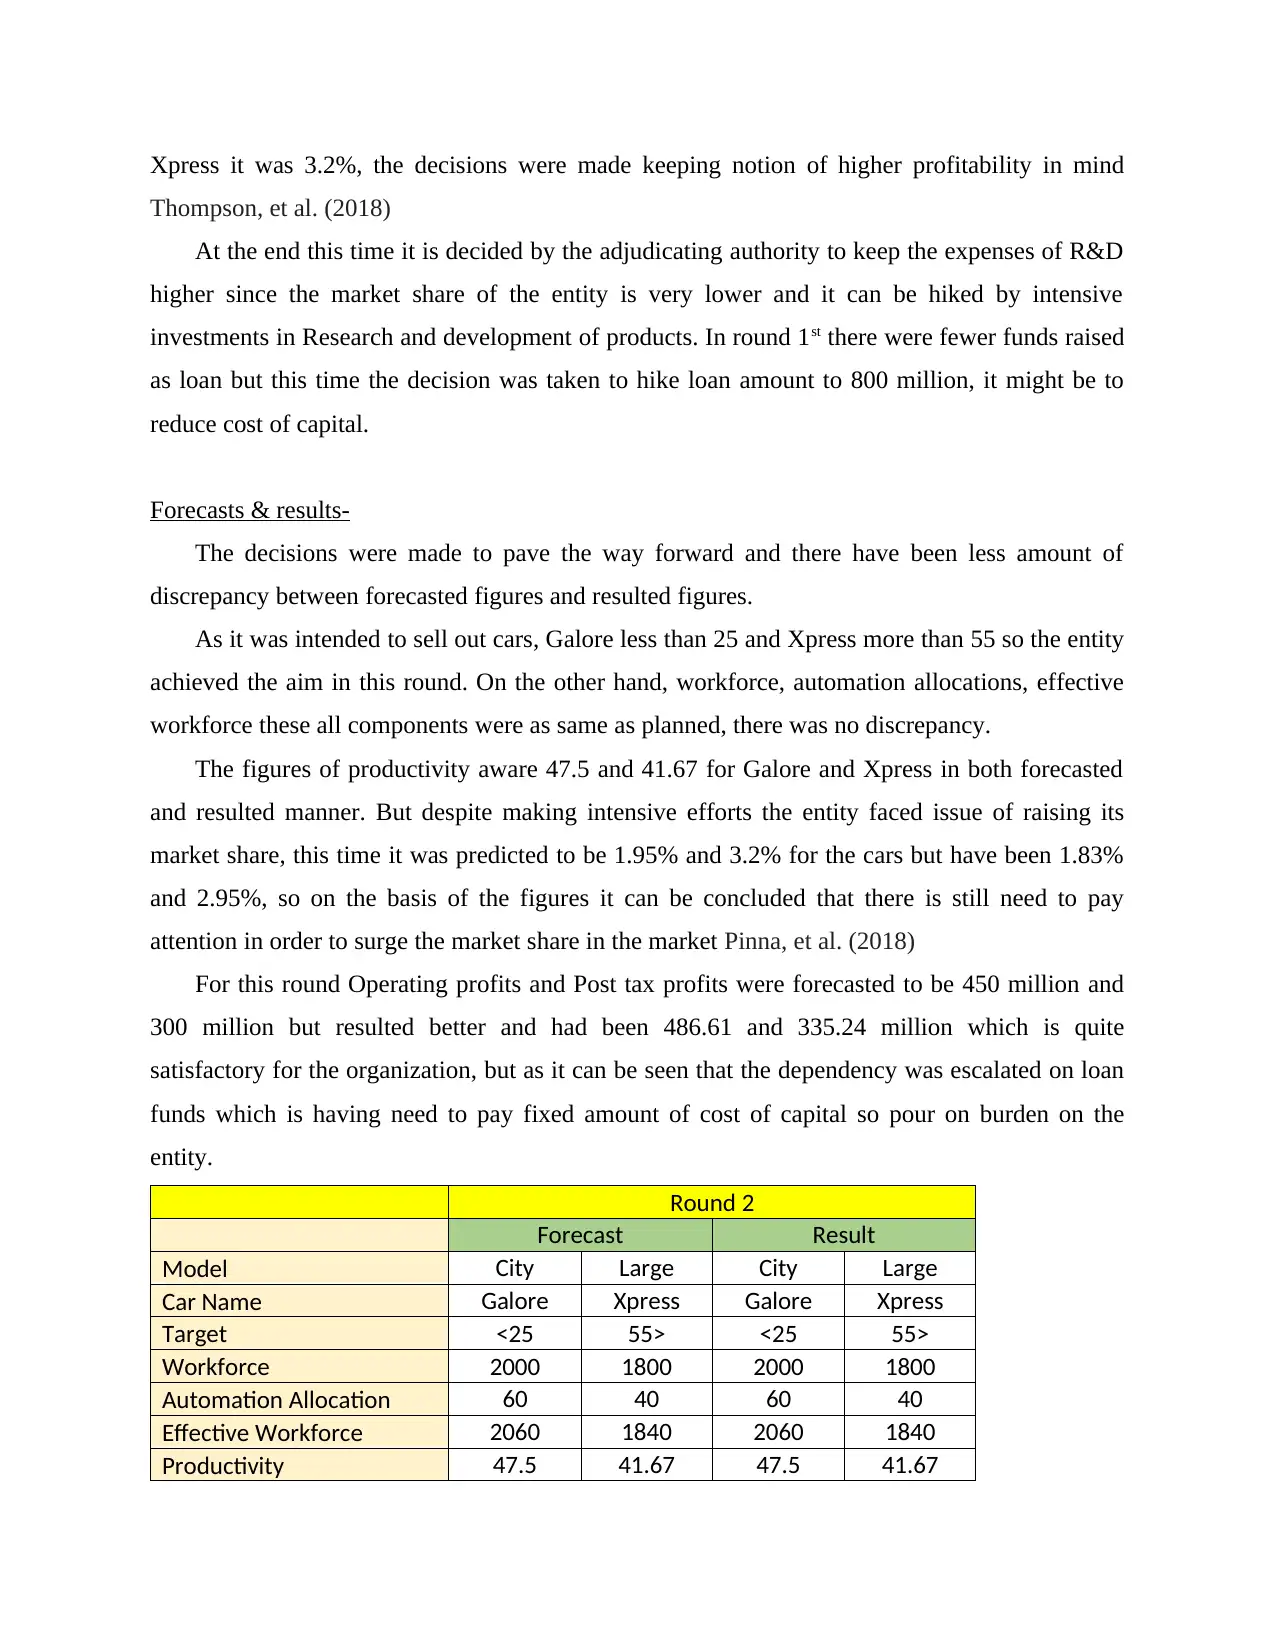
Xpress it was 3.2%, the decisions were made keeping notion of higher profitability in mind
Thompson, et al. (2018)
At the end this time it is decided by the adjudicating authority to keep the expenses of R&D
higher since the market share of the entity is very lower and it can be hiked by intensive
investments in Research and development of products. In round 1st there were fewer funds raised
as loan but this time the decision was taken to hike loan amount to 800 million, it might be to
reduce cost of capital.
Forecasts & results-
The decisions were made to pave the way forward and there have been less amount of
discrepancy between forecasted figures and resulted figures.
As it was intended to sell out cars, Galore less than 25 and Xpress more than 55 so the entity
achieved the aim in this round. On the other hand, workforce, automation allocations, effective
workforce these all components were as same as planned, there was no discrepancy.
The figures of productivity aware 47.5 and 41.67 for Galore and Xpress in both forecasted
and resulted manner. But despite making intensive efforts the entity faced issue of raising its
market share, this time it was predicted to be 1.95% and 3.2% for the cars but have been 1.83%
and 2.95%, so on the basis of the figures it can be concluded that there is still need to pay
attention in order to surge the market share in the market Pinna, et al. (2018)
For this round Operating profits and Post tax profits were forecasted to be 450 million and
300 million but resulted better and had been 486.61 and 335.24 million which is quite
satisfactory for the organization, but as it can be seen that the dependency was escalated on loan
funds which is having need to pay fixed amount of cost of capital so pour on burden on the
entity.
Round 2
Forecast Result
Model City Large City Large
Car Name Galore Xpress Galore Xpress
Target <25 55> <25 55>
Workforce 2000 1800 2000 1800
Automation Allocation 60 40 60 40
Effective Workforce 2060 1840 2060 1840
Productivity 47.5 41.67 47.5 41.67
Paraphrase This Document
Need a fresh take? Get an instant paraphrase of this document with our AI Paraphraser
Unsold Stock 0 0 0 0
Selling Price(£) 18000 27990 18000 27990
Market Share(%) 1.95 3.2 1.83 2.95
Salary 550 550
Stike Days 3 2
Gross Margine(%) 38.7 25 40.25 18.73
Sale Income (£m) 3809.25 3809.25
Net Cash Position(£m) 2727.86 2727.86
Fixed Overheads(£m) 236.05 236.05
Promotion(£m) 199 199
R&D(£m) 30 32.87
Training Cost(£m) 5 5
Automation
Investment(£m) 20 20
Warranty Claim Cost(£m) 30 36.99
Depreciation(£m) -133 133.1
Operating Profit(£m) 450 486.61
Post Tax Profit(£m) 300 335.24
Loan(£m) 800
Round 3
Decision making-
In the round 2nd, the overall performance of the organization was admirable, and they have
enhanced their diaspora in the market by making some drastic decisions. So for this round they
made couple of new decisions in order to eradicate all potential trouble makers and paving way
for higher performance.
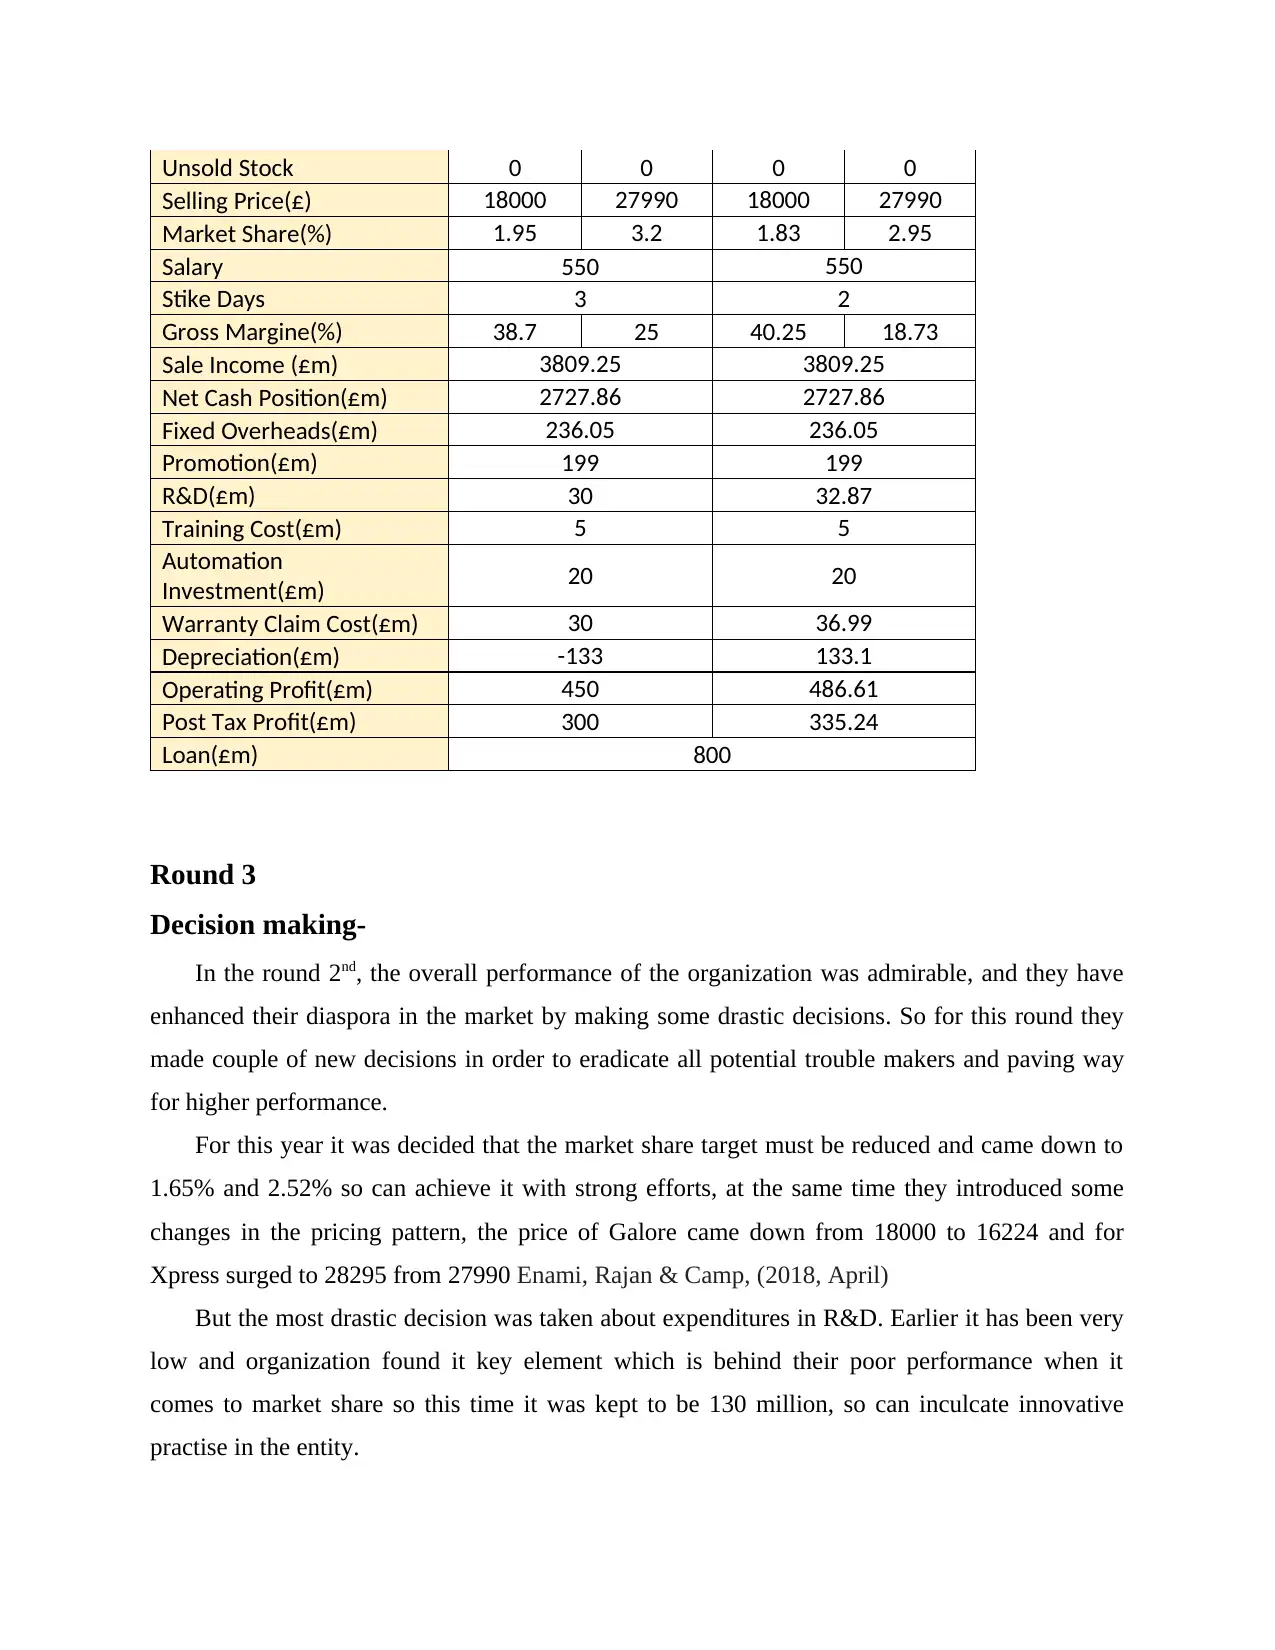
For this year it was decided that the market share target must be reduced and came down to
1.65% and 2.52% so can achieve it with strong efforts, at the same time they introduced some
changes in the pricing pattern, the price of Galore came down from 18000 to 16224 and for
Xpress surged to 28295 from 27990 Enami, Rajan & Camp, (2018, April)
But the most drastic decision was taken about expenditures in R&D. Earlier it has been very
low and organization found it key element which is behind their poor performance when it
comes to market share so this time it was kept to be 130 million, so can inculcate innovative
practise in the entity.
Selling Price(£) 18000 27990 18000 27990
Market Share(%) 1.95 3.2 1.83 2.95
Salary 550 550
Stike Days 3 2
Gross Margine(%) 38.7 25 40.25 18.73
Sale Income (£m) 3809.25 3809.25
Net Cash Position(£m) 2727.86 2727.86
Fixed Overheads(£m) 236.05 236.05
Promotion(£m) 199 199
R&D(£m) 30 32.87
Training Cost(£m) 5 5
Automation
Investment(£m) 20 20
Warranty Claim Cost(£m) 30 36.99
Depreciation(£m) -133 133.1
Operating Profit(£m) 450 486.61
Post Tax Profit(£m) 300 335.24
Loan(£m) 800
Round 3
Decision making-
In the round 2nd, the overall performance of the organization was admirable, and they have
enhanced their diaspora in the market by making some drastic decisions. So for this round they
made couple of new decisions in order to eradicate all potential trouble makers and paving way
for higher performance.
For this year it was decided that the market share target must be reduced and came down to
1.65% and 2.52% so can achieve it with strong efforts, at the same time they introduced some
changes in the pricing pattern, the price of Galore came down from 18000 to 16224 and for
Xpress surged to 28295 from 27990 Enami, Rajan & Camp, (2018, April)
But the most drastic decision was taken about expenditures in R&D. Earlier it has been very
low and organization found it key element which is behind their poor performance when it
comes to market share so this time it was kept to be 130 million, so can inculcate innovative
practise in the entity.
At the end the financial position got changed, the entity was making sufficient profit so there
was need felt to reduce share of debt funds, and they kept loans down from 800 million to 600
million for the round 3rd.
Forecasts & results-
In the round as it has been seen that some drastic decisions were made to make the aims of
organization feasible.
Some major KPMs had been as same as forecasted, such as target units, workforce,
automation allocation, effective workforce etc. which is indicating that the entity worked with
proper efficiency in the third round.
Due to some market circumstances there were changes seen in price of products. For Galore
the planned price was 16224 and for Xpress 28295 but in actuality these were 18000 and 27990,
this is clear evidence that the forecasting did not go well. Charging higher prices for Galore may
be kept a side but for Xpress cars reducing prices had been a bit radical aspect.
Learning from previous rounds, in the 3rd round the estimation for market share was toppled,
and due to exact estimation has achieved it. Now for Galore the market share was 1.65% which
was as expected, on the other side for Xpress it went to 2.72% which was intended to be 2.52%,
so due to reduction in the selling price the entity hiked market share Pfaffel, et al. (2019,
October)
The R&D expenditures which had been severe issue for the entity form last two rounds so
this time surged its R&D estimation which was 130 million, but resulted 132.01 million. In
contrast, did not perform good when it comes to warranty claim cost.
At the end the operating profit for the round was higher than expectations, it was supposed
to be 256.3 million but in reality was 286.34 million, Post tax profit for the round was intended
to be 200.93 million, and in reality had been 212.93 million.
From the comparison above it can be concluded that the final outcomes of the entity in term
of profit were not as high as they have been in last two rounds but some KPMs such as market
share, R&D are looking in favour which can be taken as positive outcomes.
Round 3
Forecast Result
Model City Large City Large
Car Name Galore Xpress Galore Xpress
⊘ This is a preview!⊘
Do you want full access?
Subscribe today to unlock all pages.
Trusted by 1+ million students worldwide
Target <25 41-55 <25 41-55
Workforce 2000 1800 2000 1800
Automation Allocation 60 40 60 40
Effective Workforce 2060 1840 2060 1840
Productivity 47.5 41.67 47.5 41.67
Unsold Stock 0 0 0 0
Selling Price(£) 16224 28295 18000 27990
Market Share(%) 1.65 2.52 1.65 2.72
Salary 550 550
Stike Days 3 4
Gross Margine(%) 35 20 38.83 15.67
Sale Income (£m) 3809.25 3809.25
Net Cash Position(£m) 2816.3 2816.3
Fixed Overheads(£m) 240 244.3
Promotion(£m) 190 199
R&D(£m) 130 132.01
Training Cost(£m) 5 5
Automation Investment(£m) 0 0
Warranty Claim Cost(£m) 35 37.66
Depreciation(£m) 200.79 200.79
Operating Profit(£m) 256.3 286.34
Post Tax Profit(£m) 200.93 212.93
Loan(£m) 600
Round 4
Decision making-
The last three rounds taught a lot to the management and this time it became rigours
requirement to go with something new in order to escalate market position and hiking outcomes
of all KPMs.
This time one of the biggest decision was about introduction of a new product in order to
change the market dynamics and fulfil demands of customers, also adding up new groups of
people in order to surge all KPMs. The decision of coming up with new product may be justified
considering performance of last three rounds where it not only impressed with its profit making
ability but also attracted the customers which was the biggest reason of their achieved market
share target Shawahna, (2020)
Paraphrase This Document
Need a fresh take? Get an instant paraphrase of this document with our AI Paraphraser
With this regard, the entity introduced a new Medium car, named GX Eco, and it was
targeted between 25-40. For this car the need was felt to deploy more 1800 workers and even for
Galore the workforce was hiked to 2200.
The company felt useless to allocate higher amount for R&D, so with this regard they
reduced the funds for R&D, it came down to 49.12 million which is not even half of the final
round. The entity is striving to come up with new idea, so they have planned lower generation of
profit for the year so can pave the way and get stabled in the market Chandra & Kumar, (2018)
Forecasts & results-
This time the entity introduced a new predict so there was strong need to make proper
forecast in order to make the plan feasible and achieving higher than the last three round, with
this respect last three rounds were taken into consideration.
For this round it was forecasted that new car GX eco would be sold around 25 to 40 units,
and along with previous two models the organization sold this one too. Some KPMs such as
target, workforce, automation allocation and effective workforce had been same as intended.
On the other hands price of predicts, productivity was performed as intended but this is the
first time when the market share performance have been as same as it was predicted, in last three
rounds the entity was facing the biggest challenge to grab the market so this time with three
products they have nailed it Tur & Bayindir, (2019)
For the cars Galore, Xpress and GX eco the market share was 1.08%, 2.57% and 1.07%
which was as equal as forecasted. The strike days for the round were forecasted to be 3 but had
been 2 which is a positive symbol for the organization.
Sales income which was intended to be 5112.85 million and resulted the same. On the other
hands some other KPMs for instance Net cash position, fixed overhead, Promotion, R&D,
Training cost, Automation investments all performed equal as they were fabricated while making
prediction.
At the end the operational profit for the entity was intended around 230.5 million but
actually reverted 236.04 million, Post tax profit for the organization was predicted around 230.5
million and turned out 170.15 million, which is actually less than the previous round yet it is
satisfactory since the entity got success with their third car Witkowski, Plummer & Dale, (2022)
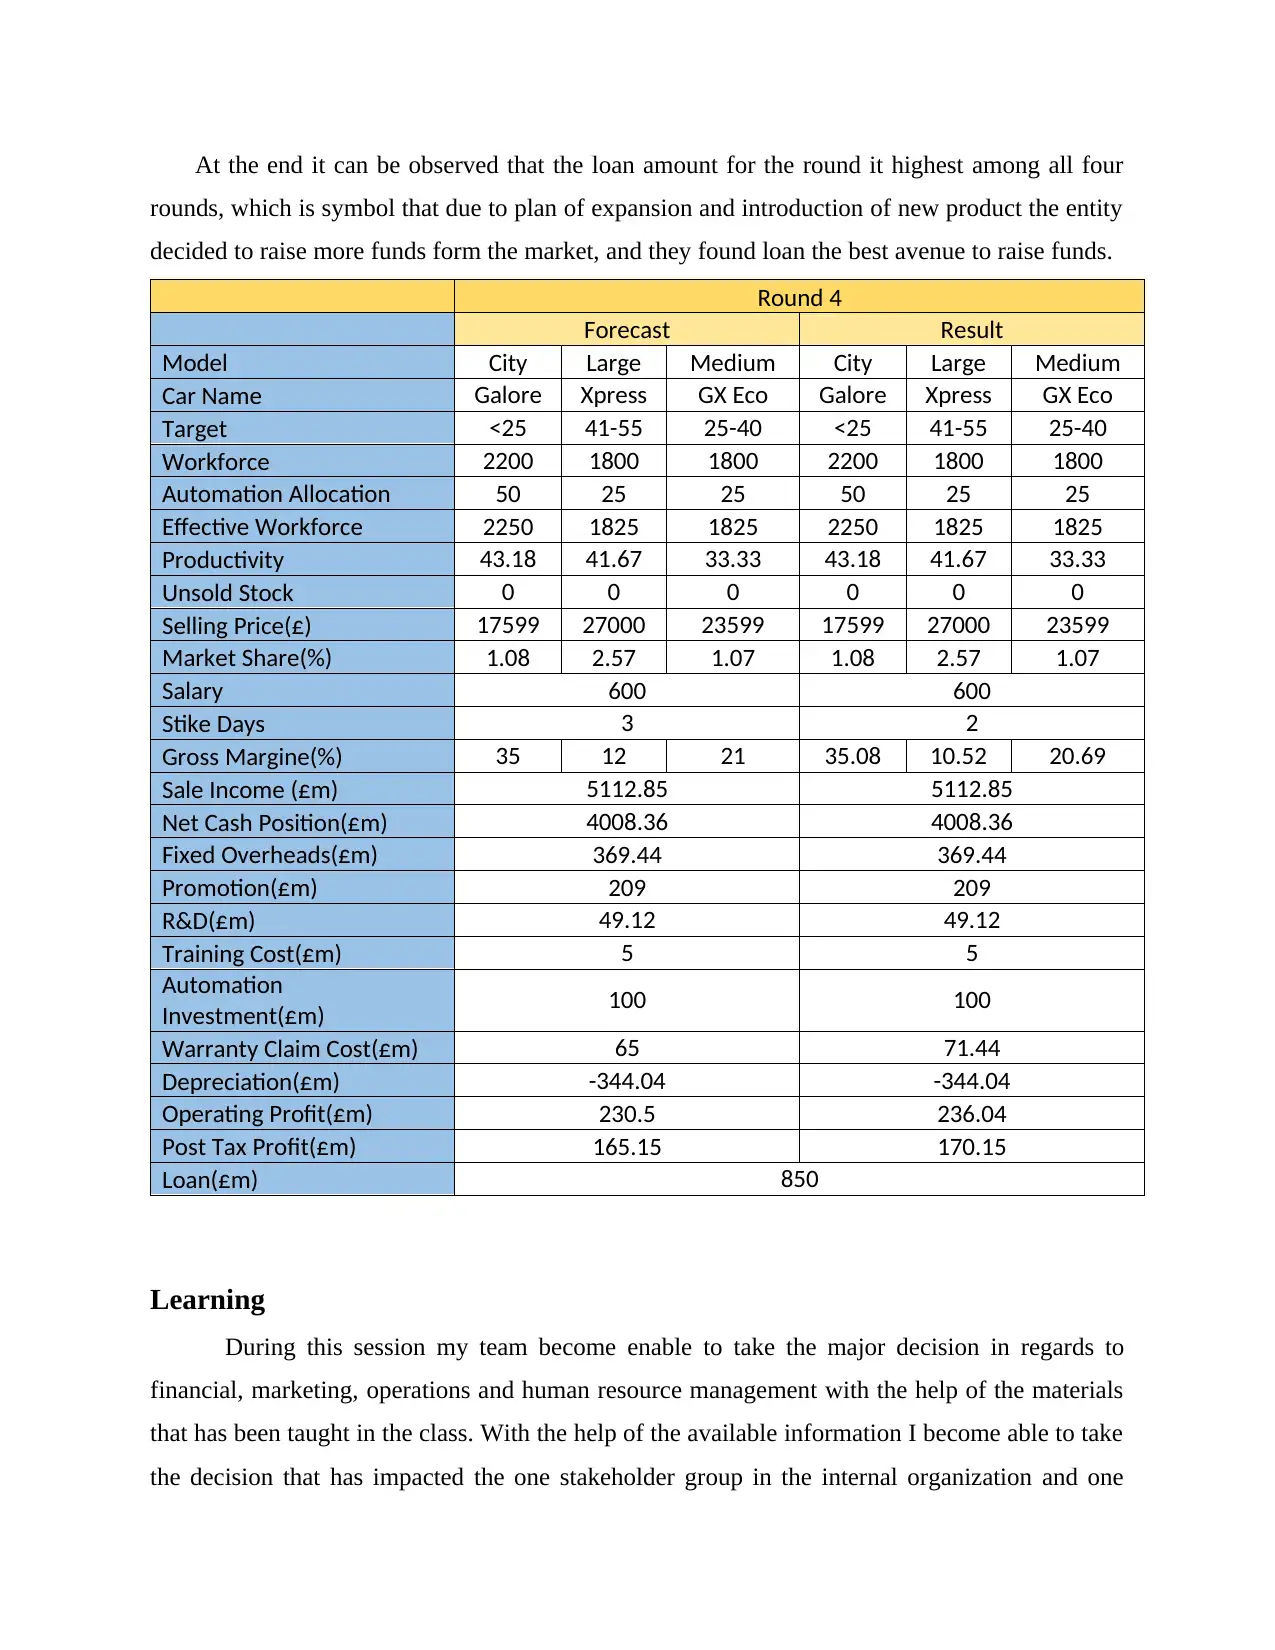
At the end it can be observed that the loan amount for the round it highest among all four
rounds, which is symbol that due to plan of expansion and introduction of new product the entity
decided to raise more funds form the market, and they found loan the best avenue to raise funds.
Round 4
Forecast Result
Model City Large Medium City Large Medium
Car Name Galore Xpress GX Eco Galore Xpress GX Eco
Target <25 41-55 25-40 <25 41-55 25-40
Workforce 2200 1800 1800 2200 1800 1800
Automation Allocation 50 25 25 50 25 25
Effective Workforce 2250 1825 1825 2250 1825 1825
Productivity 43.18 41.67 33.33 43.18 41.67 33.33
Unsold Stock 0 0 0 0 0 0
Selling Price(£) 17599 27000 23599 17599 27000 23599
Market Share(%) 1.08 2.57 1.07 1.08 2.57 1.07
Salary 600 600
Stike Days 3 2
Gross Margine(%) 35 12 21 35.08 10.52 20.69
Sale Income (£m) 5112.85 5112.85
Net Cash Position(£m) 4008.36 4008.36
Fixed Overheads(£m) 369.44 369.44
Promotion(£m) 209 209
R&D(£m) 49.12 49.12
Training Cost(£m) 5 5
Automation
Investment(£m) 100 100
Warranty Claim Cost(£m) 65 71.44
Depreciation(£m) -344.04 -344.04
Operating Profit(£m) 230.5 236.04
Post Tax Profit(£m) 165.15 170.15
Loan(£m) 850
Learning
During this session my team become enable to take the major decision in regards to
financial, marketing, operations and human resource management with the help of the materials
that has been taught in the class. With the help of the available information I become able to take
the decision that has impacted the one stakeholder group in the internal organization and one
⊘ This is a preview!⊘
Do you want full access?
Subscribe today to unlock all pages.
Trusted by 1+ million students worldwide
1 out of 22
Related Documents


Your All-in-One AI-Powered Toolkit for Academic Success.
+13062052269
info@desklib.com
Available 24*7 on WhatsApp / Email
![[object Object]](/_next/static/media/star-bottom.7253800d.svg)
Unlock your academic potential
Copyright © 2020–2026 A2Z Services. All Rights Reserved. Developed and managed by ZUCOL.