Finance for Business – Masters Project: Cash Flow and NPV Analysis
VerifiedAdded on 2020/04/07
|19
|3817
|140
Project
AI Summary
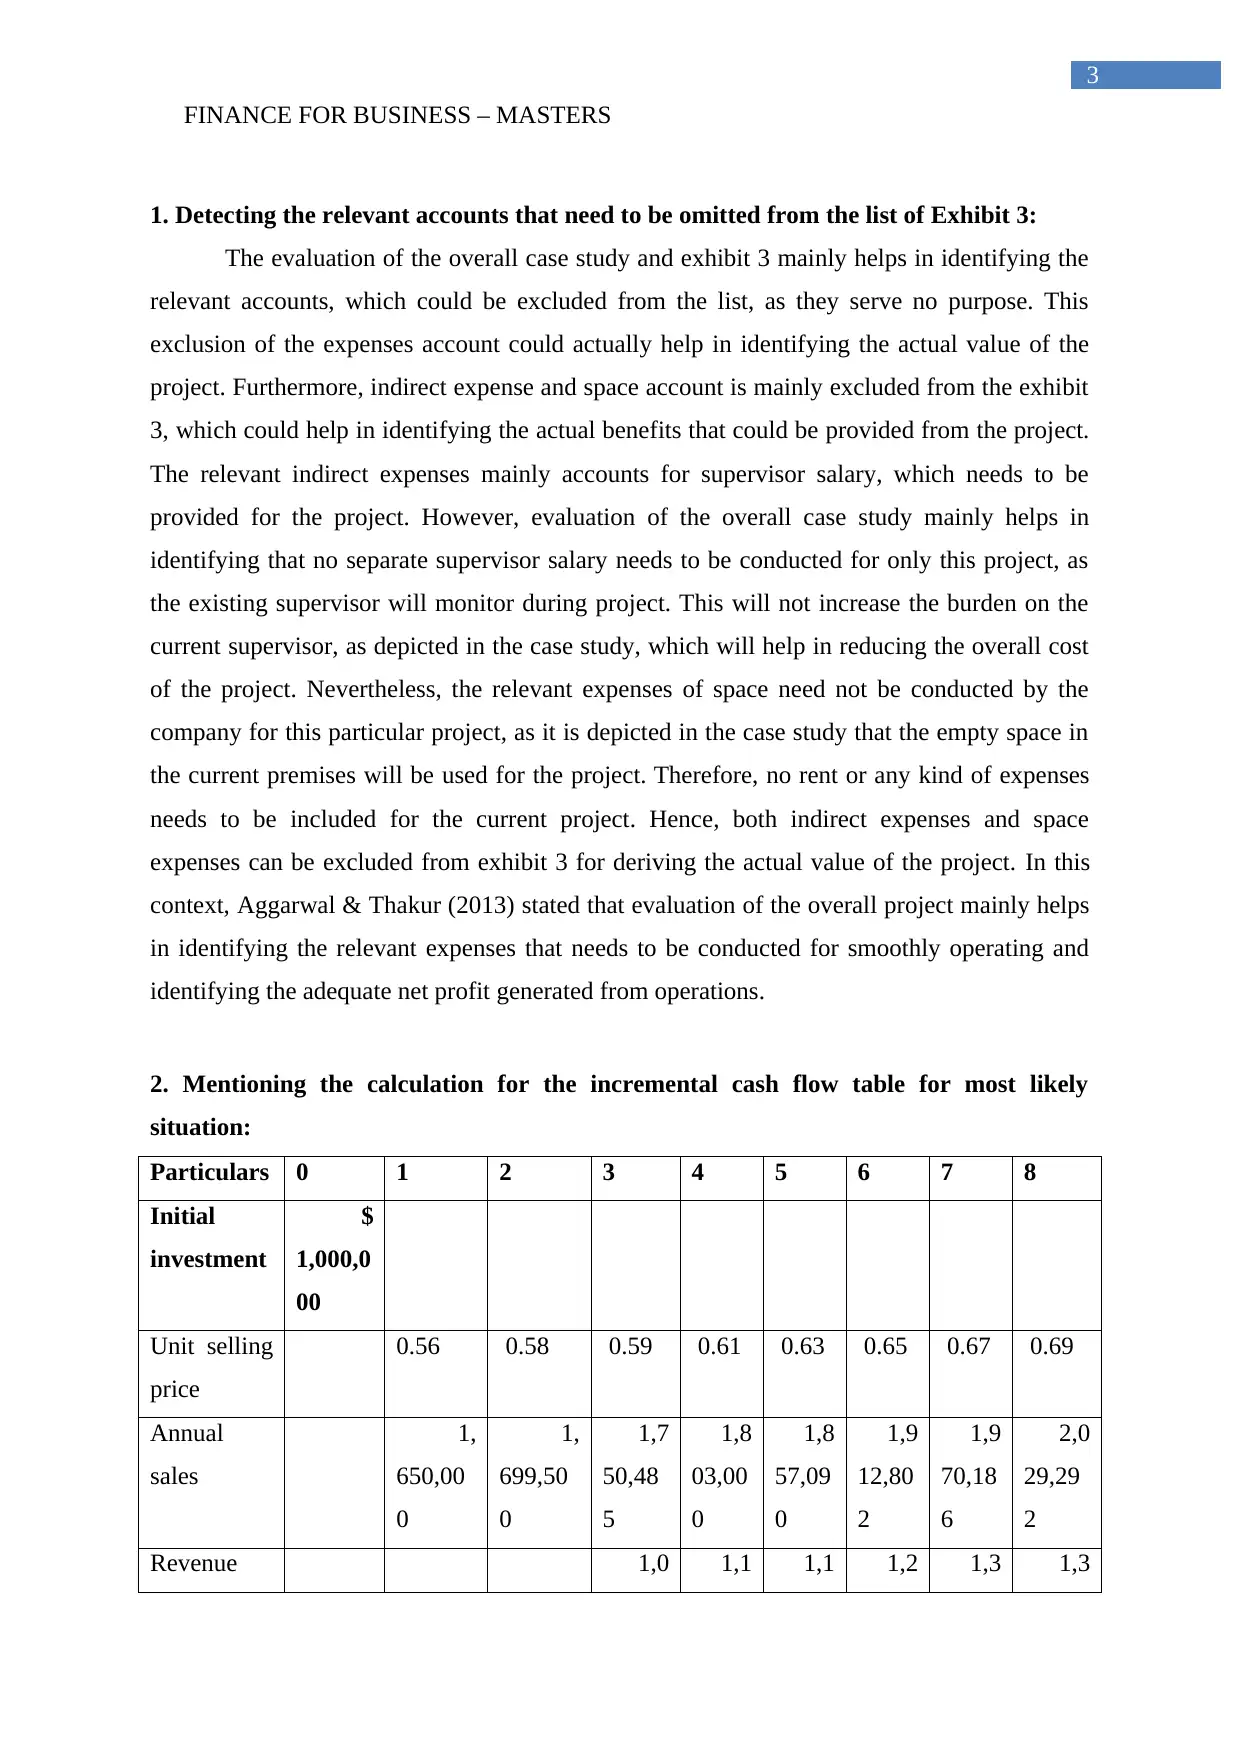
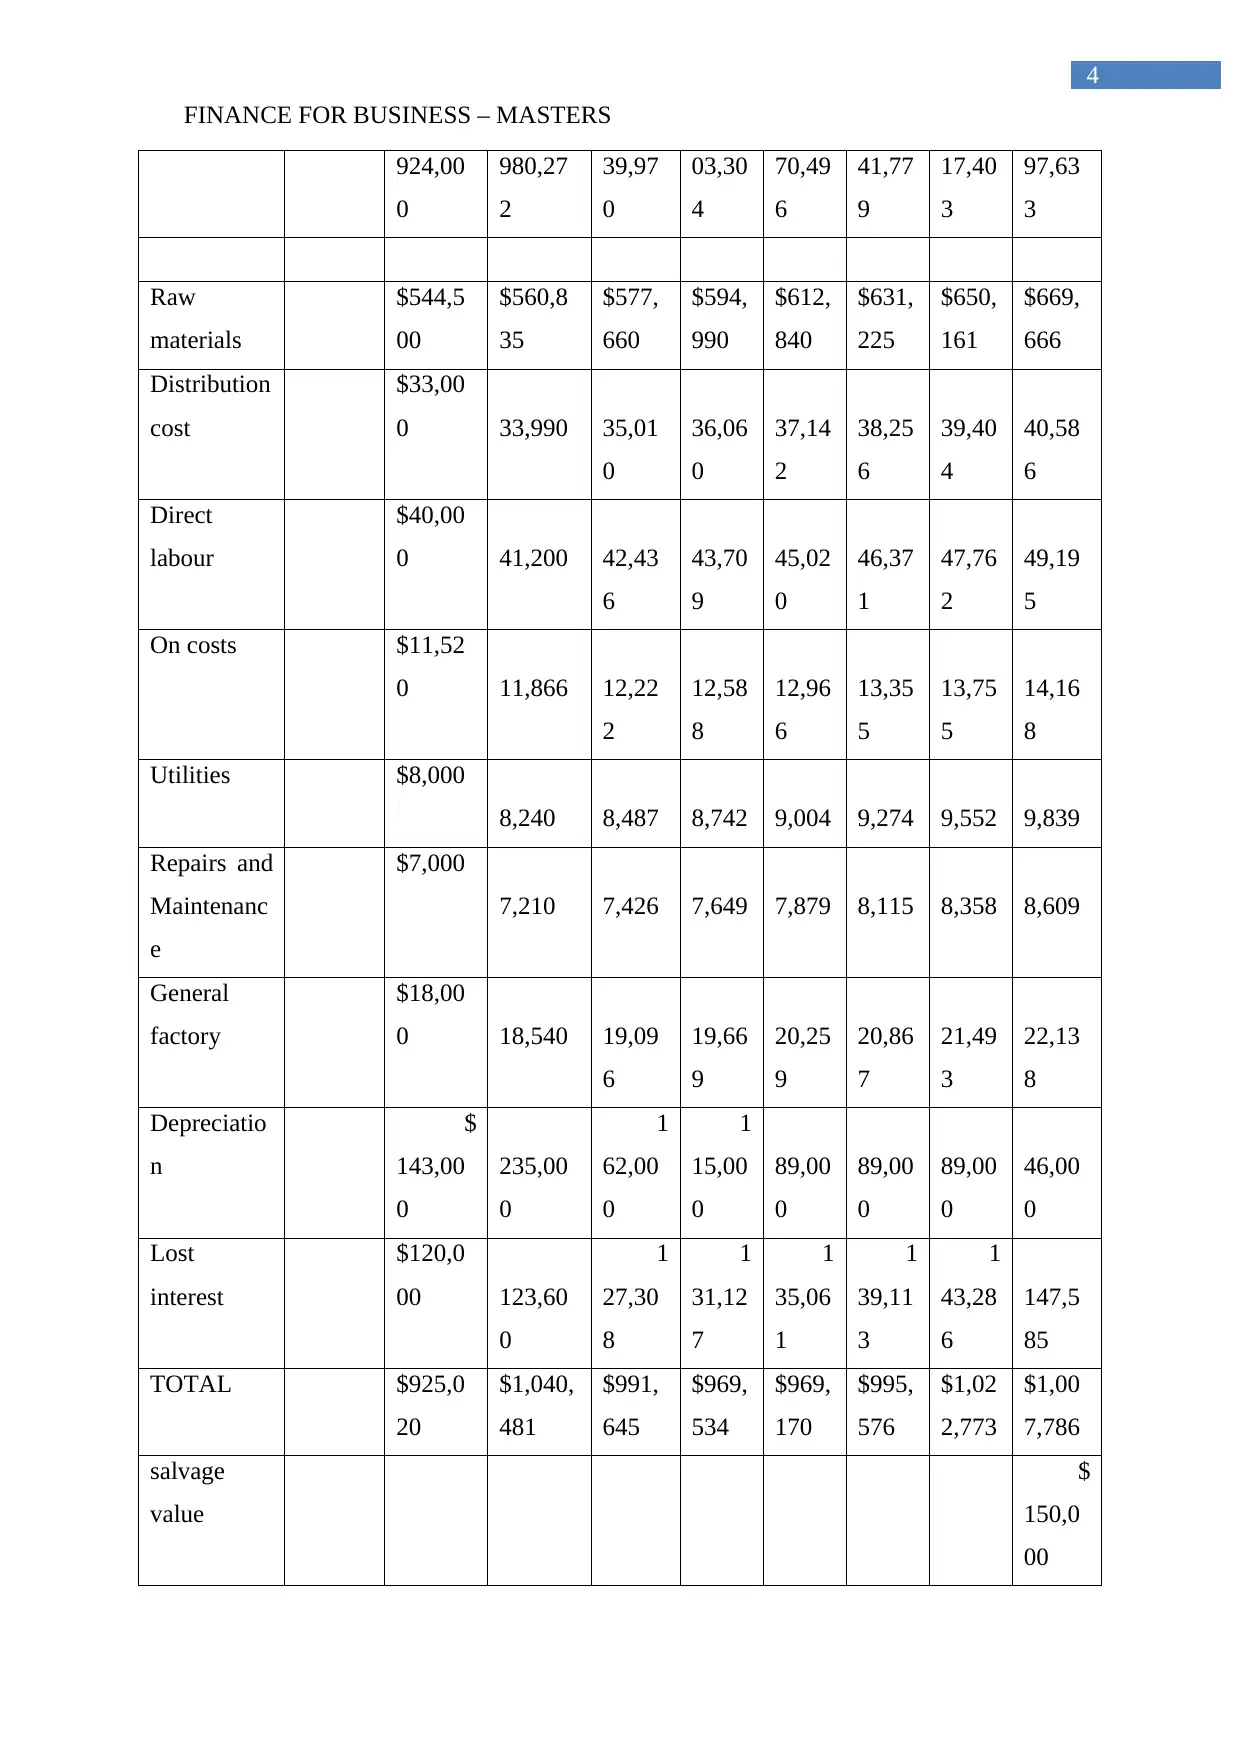
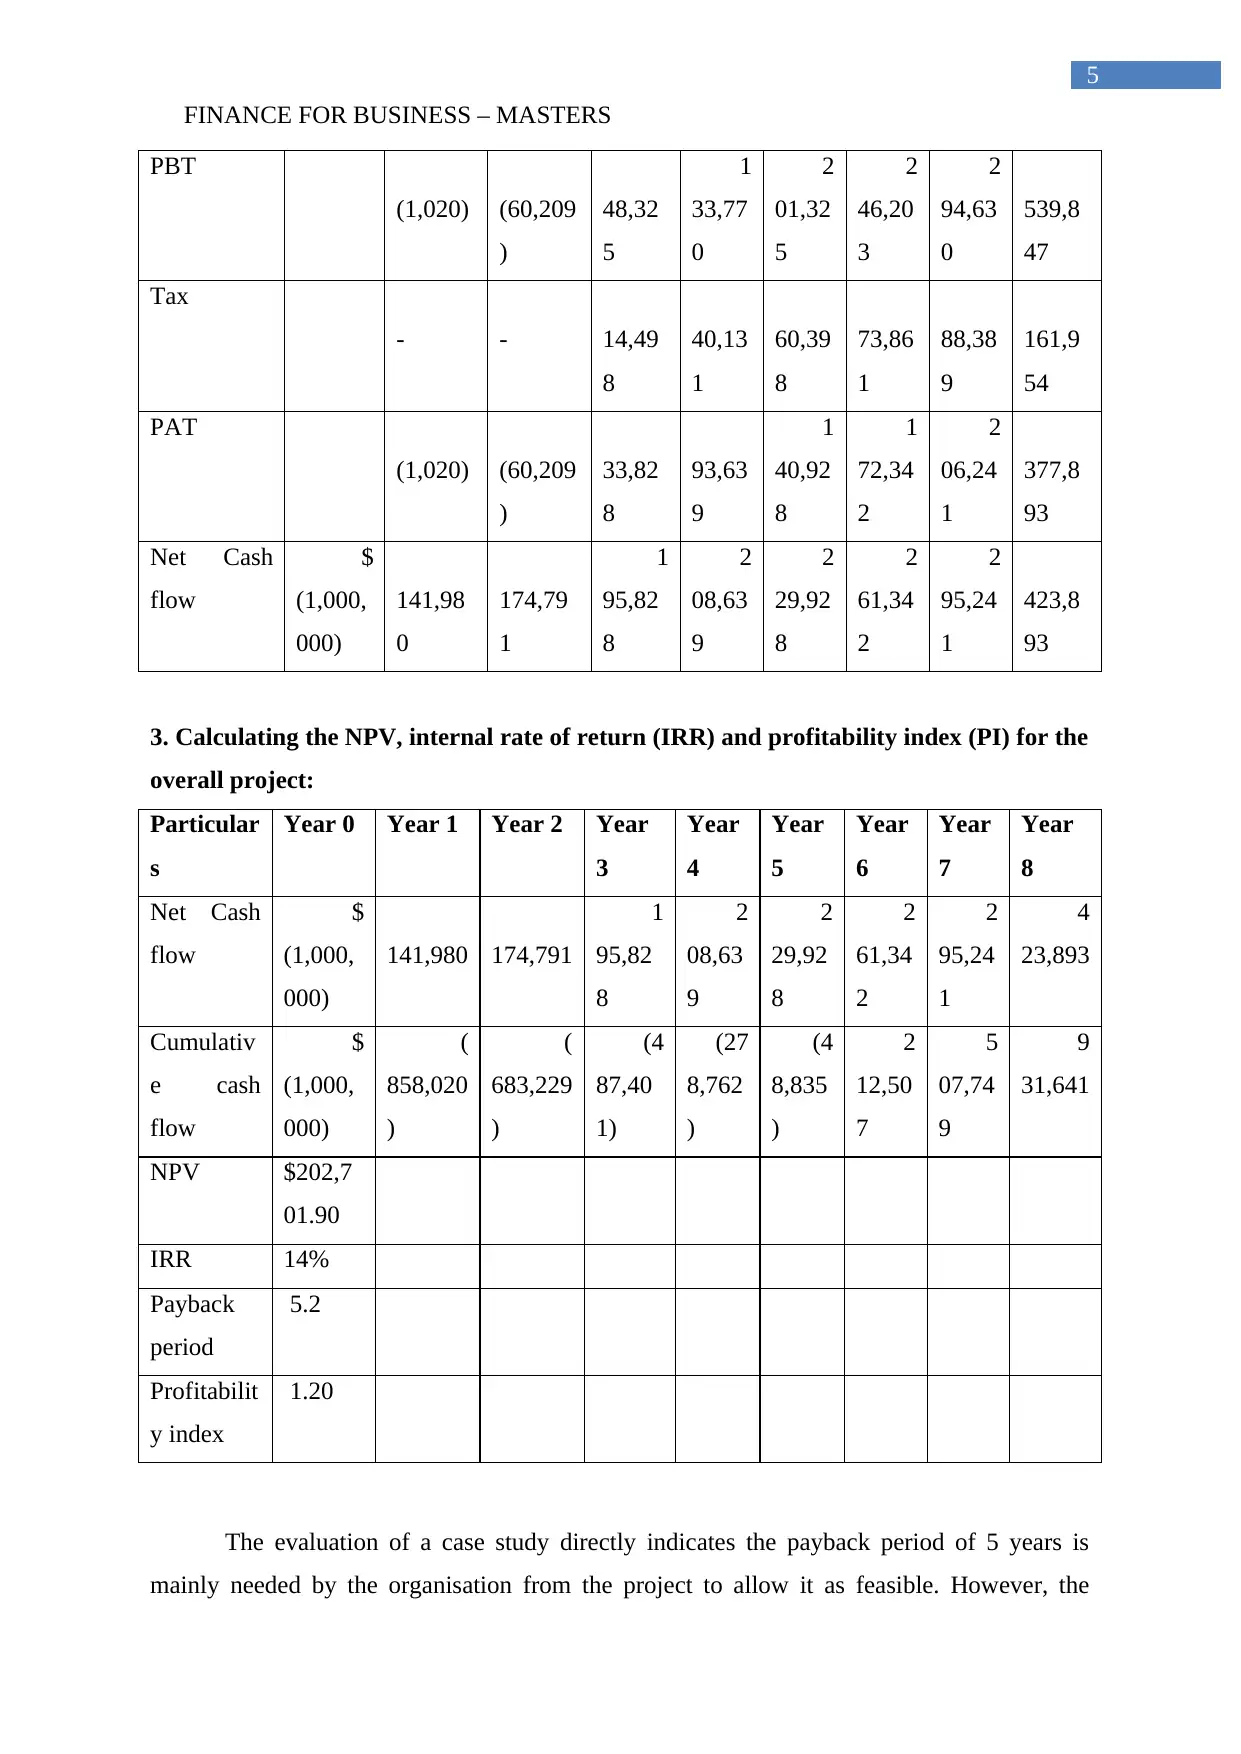
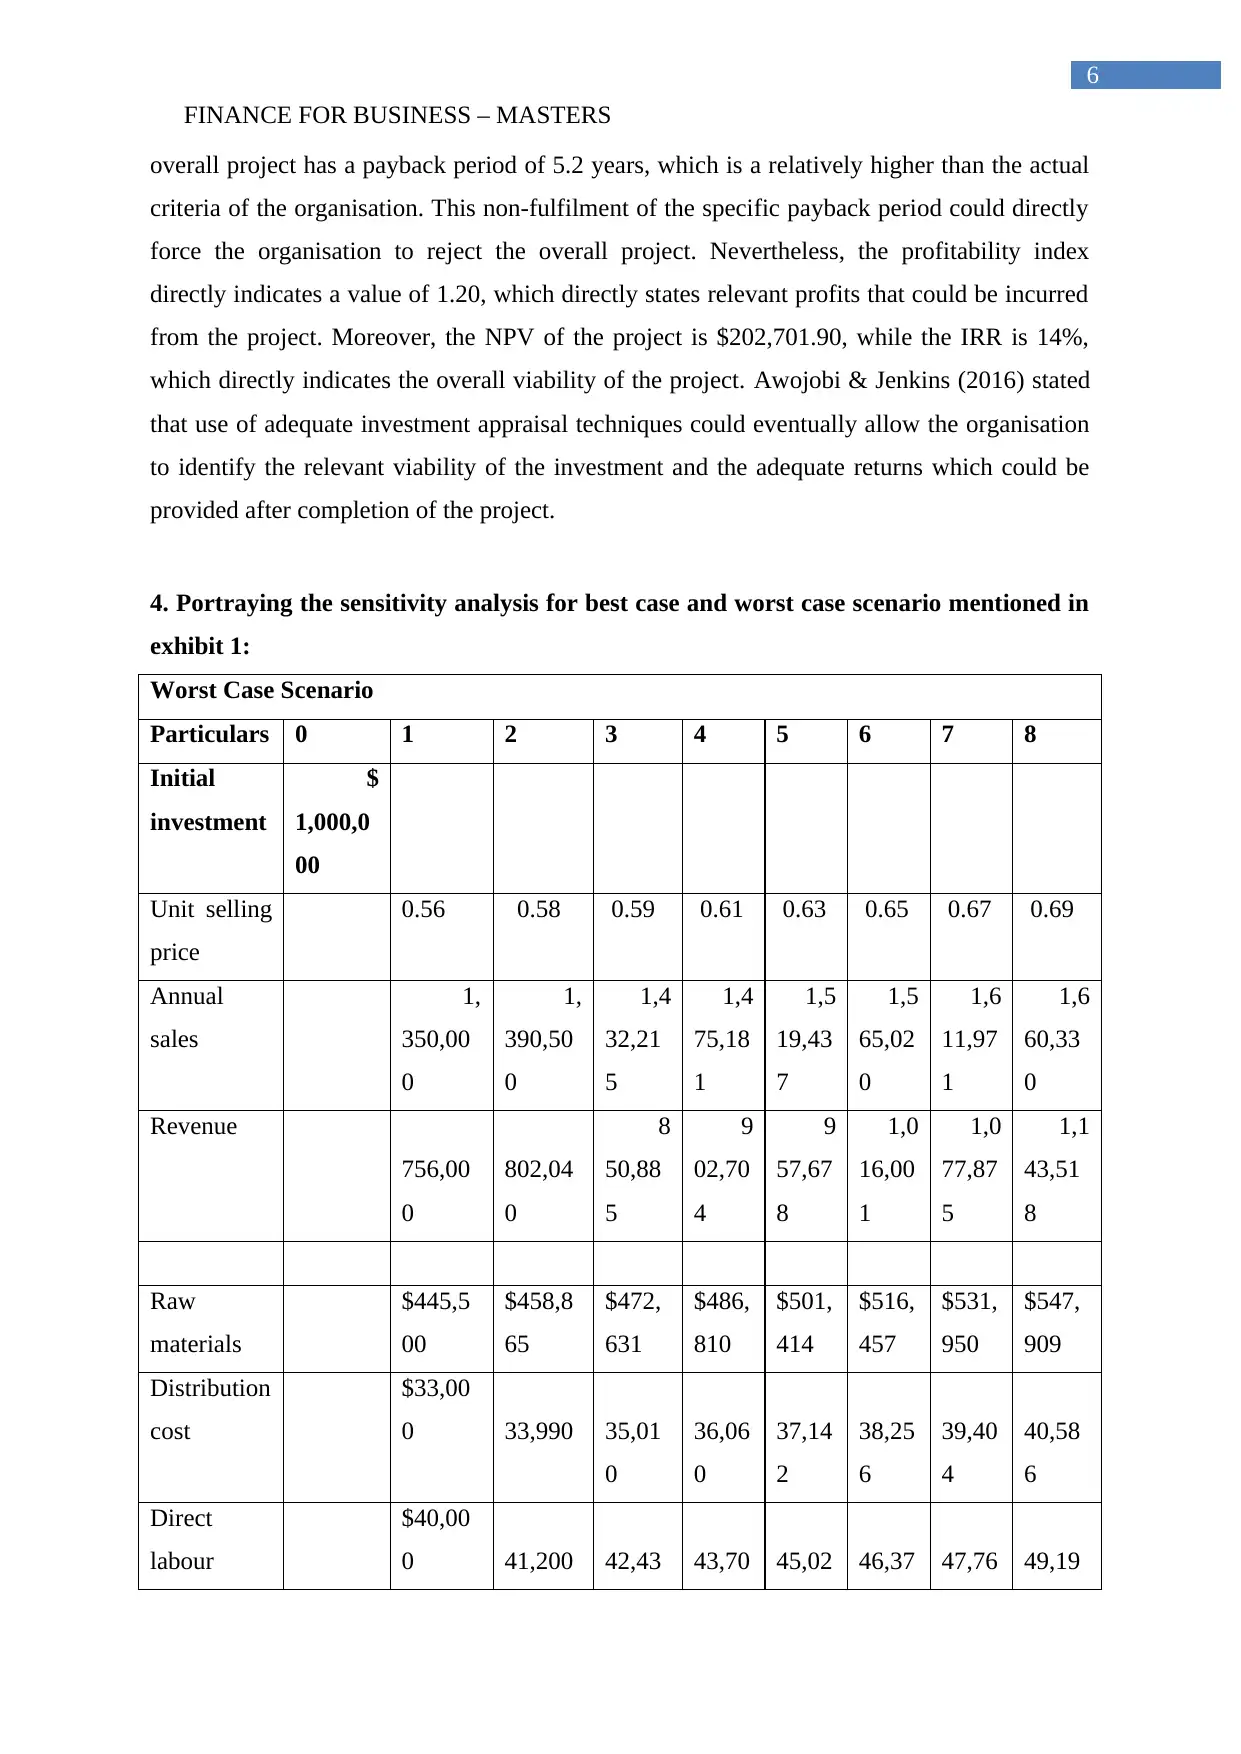
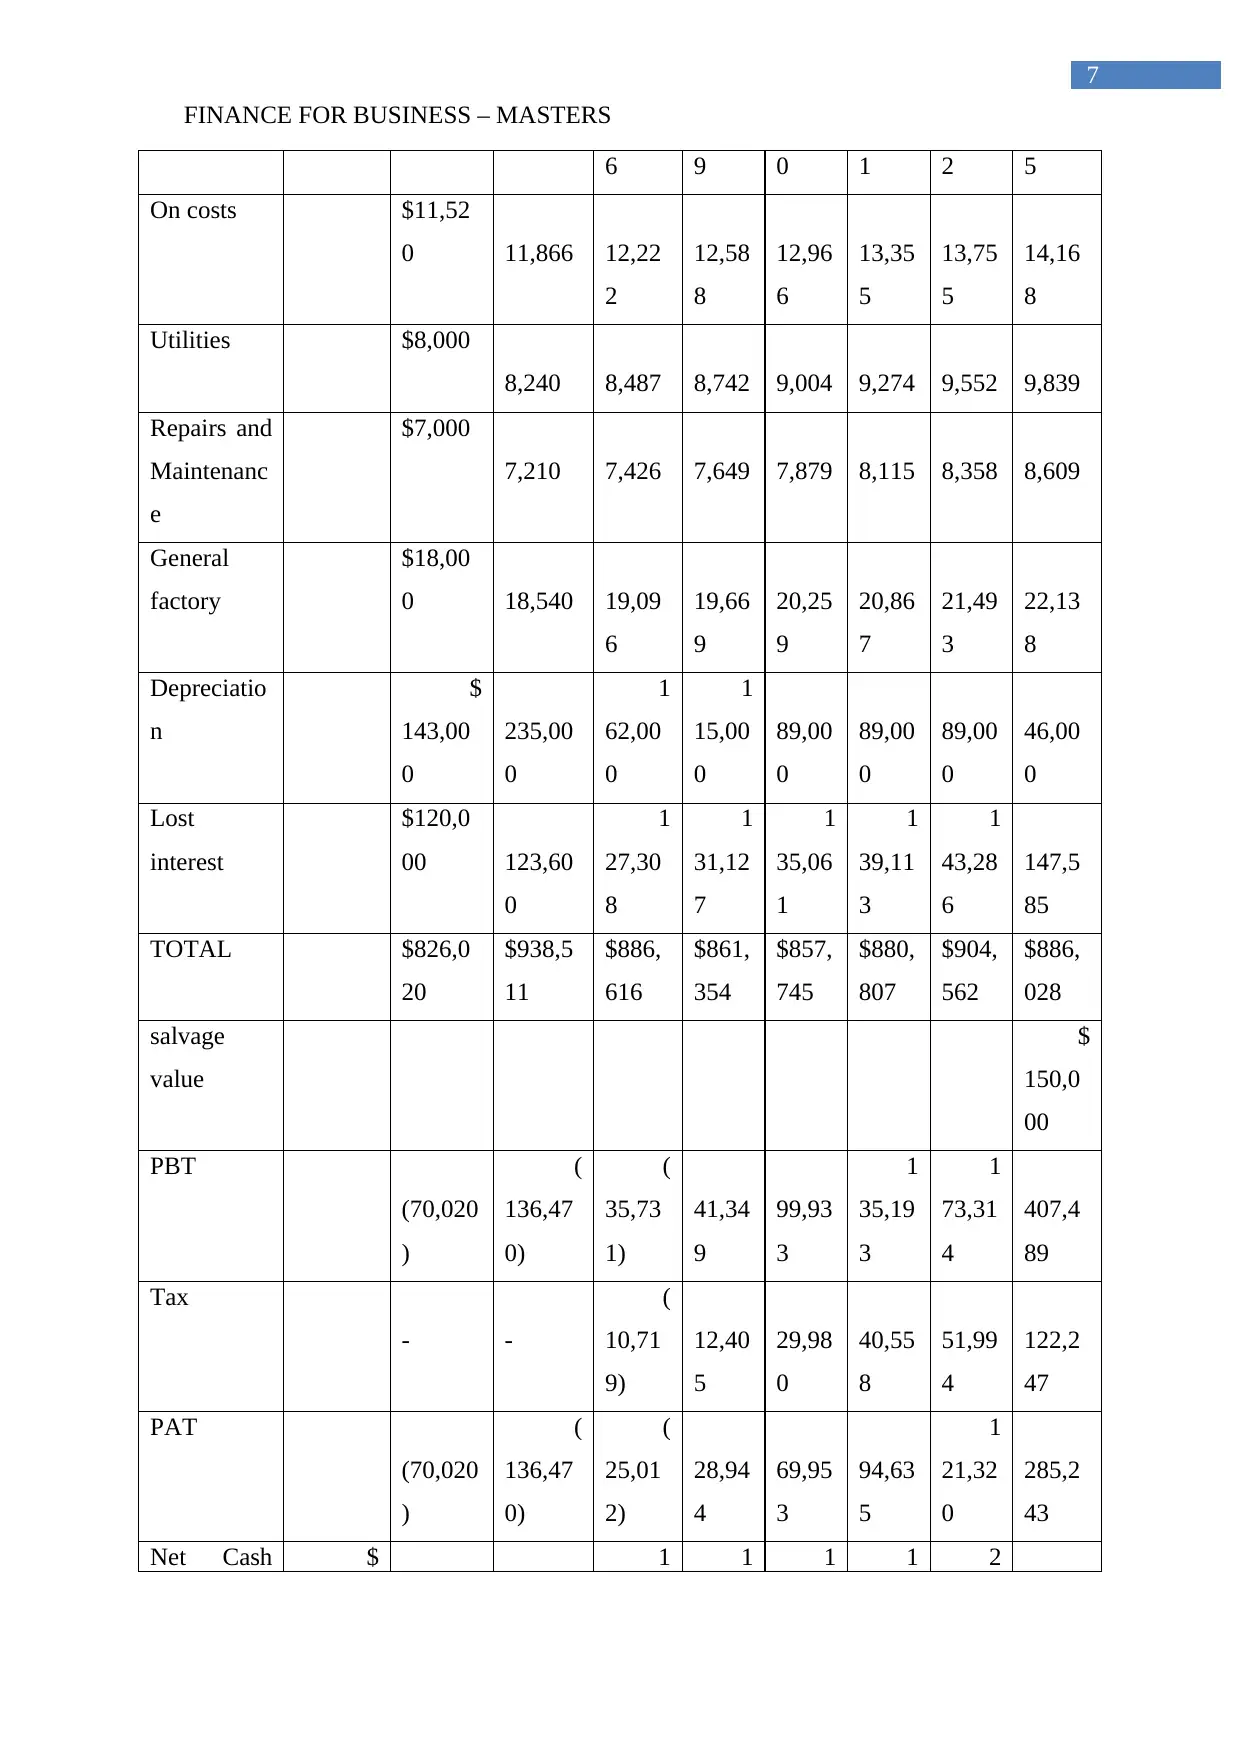
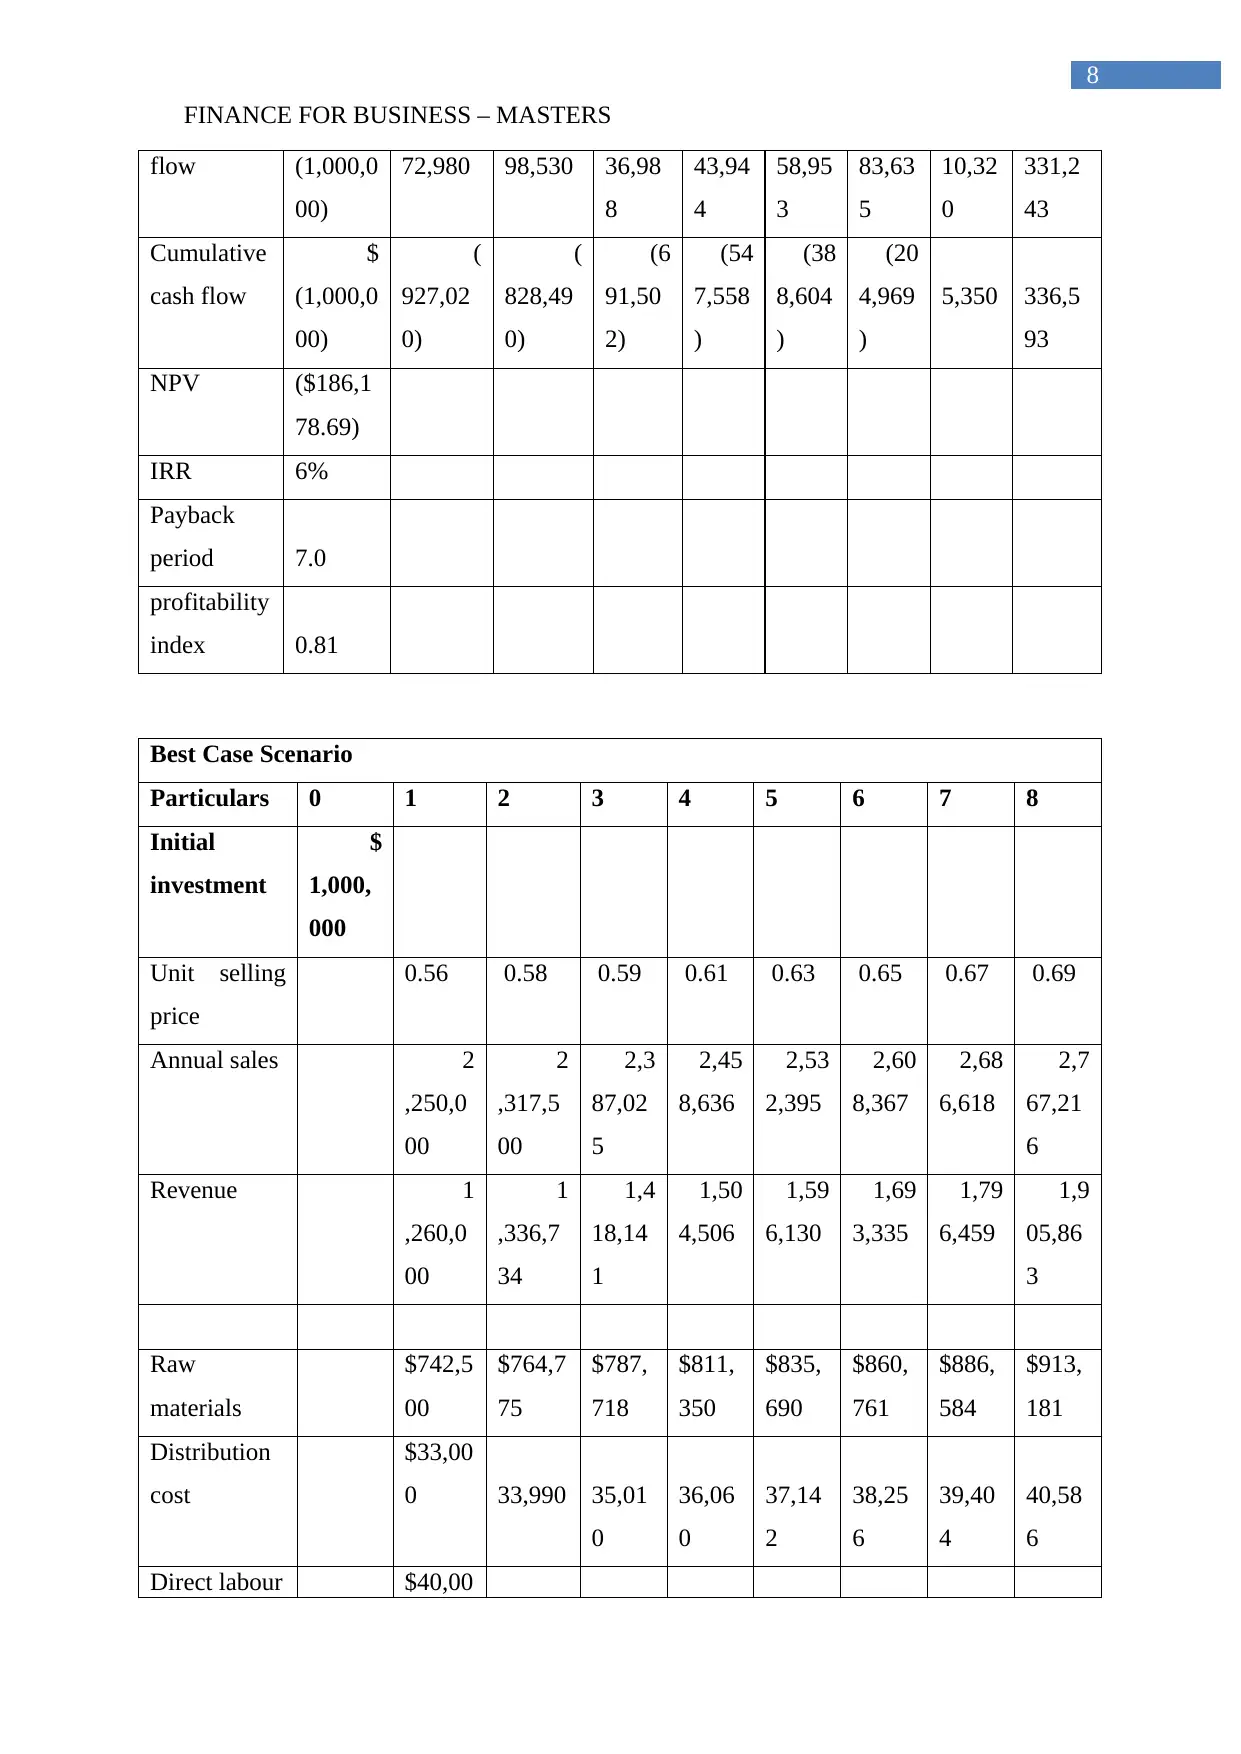
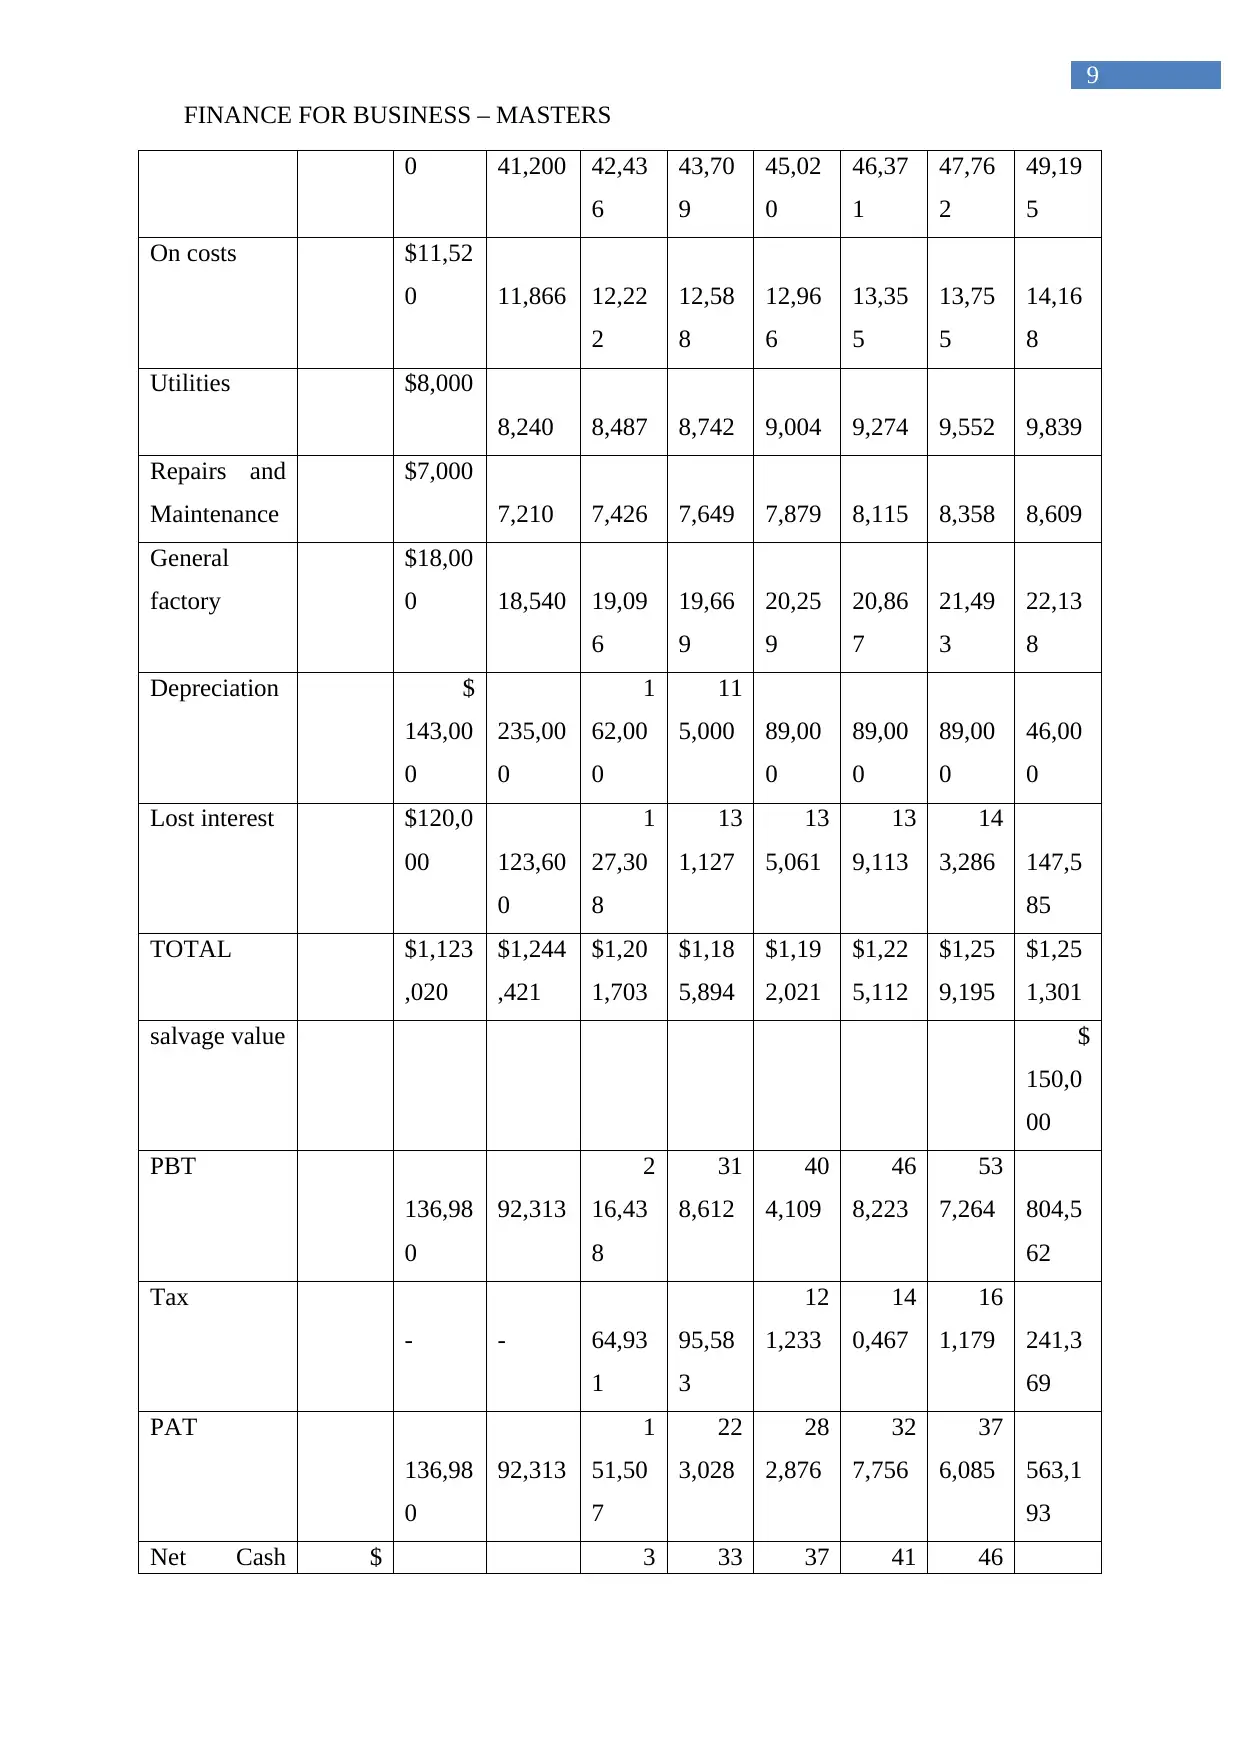
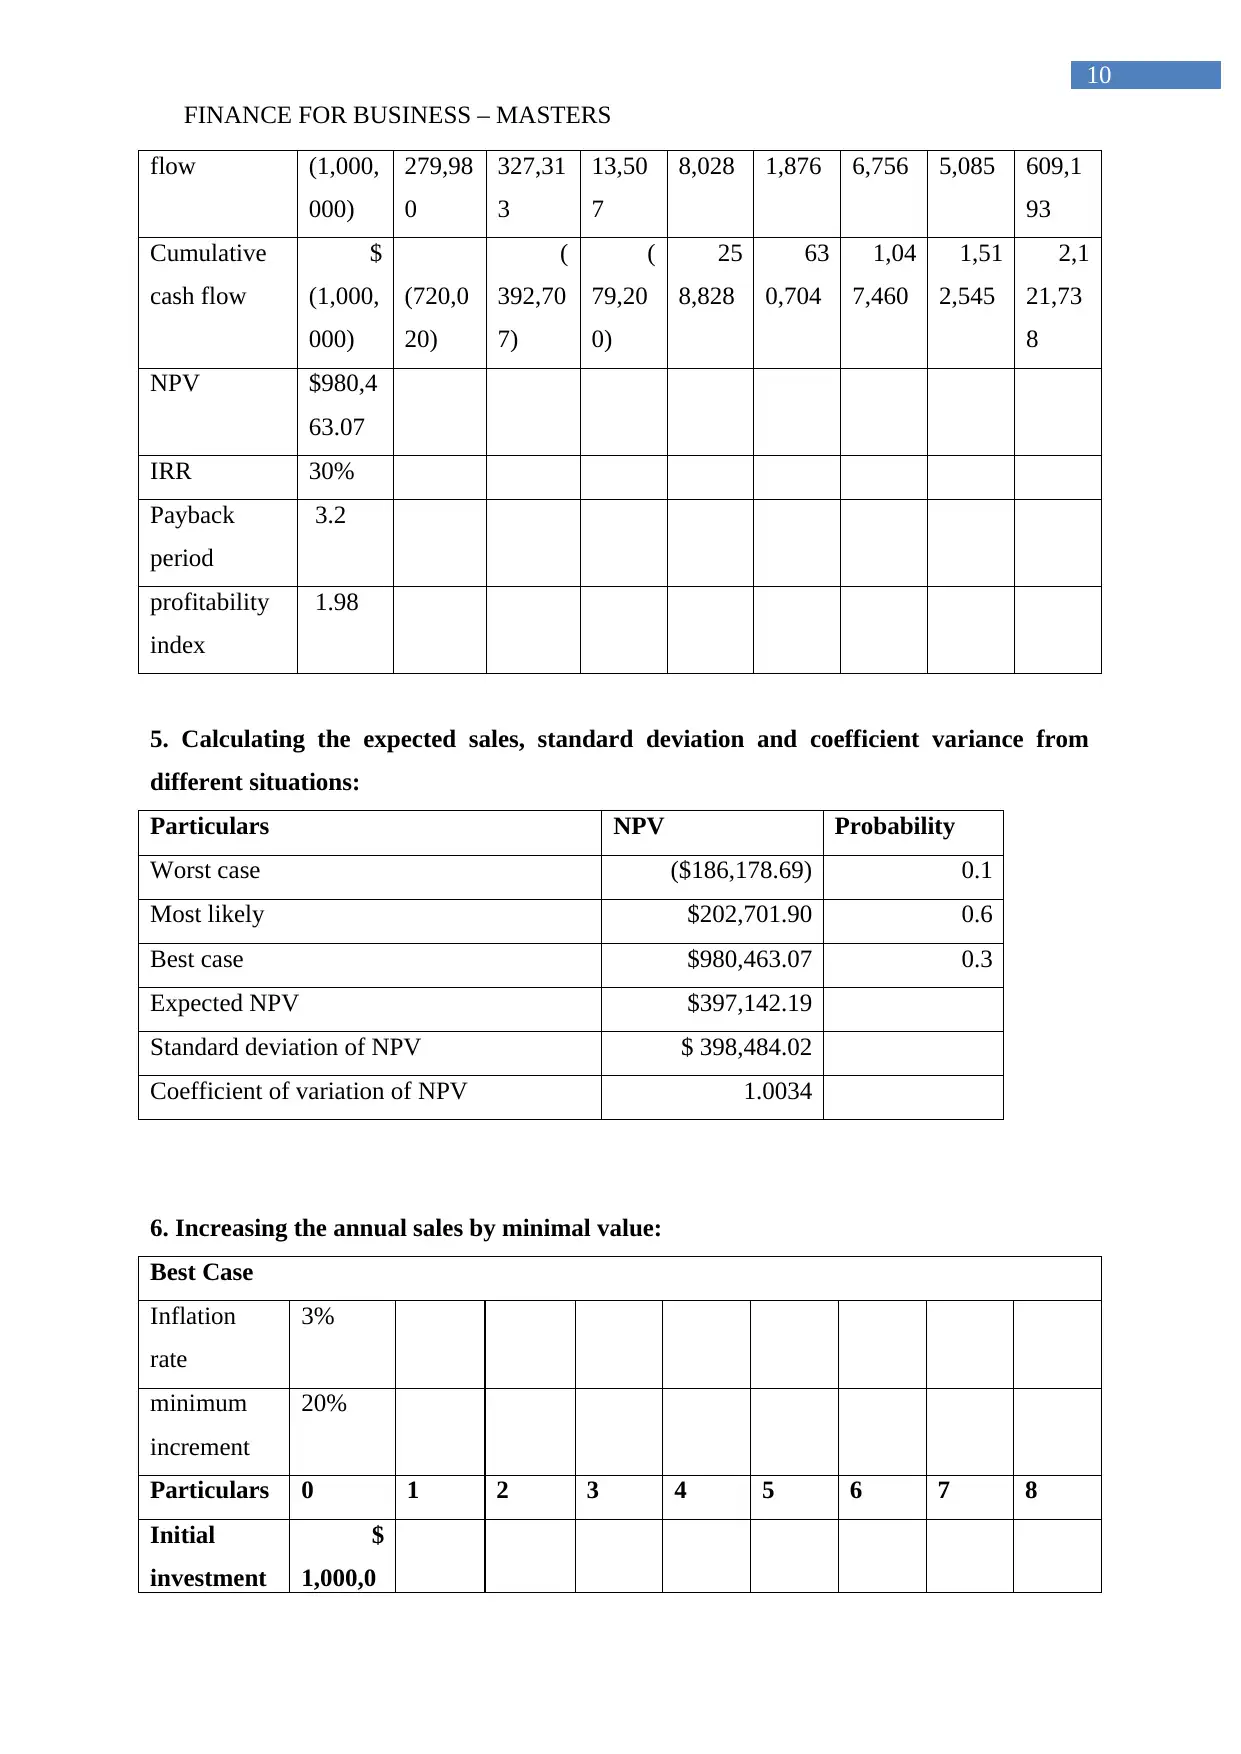
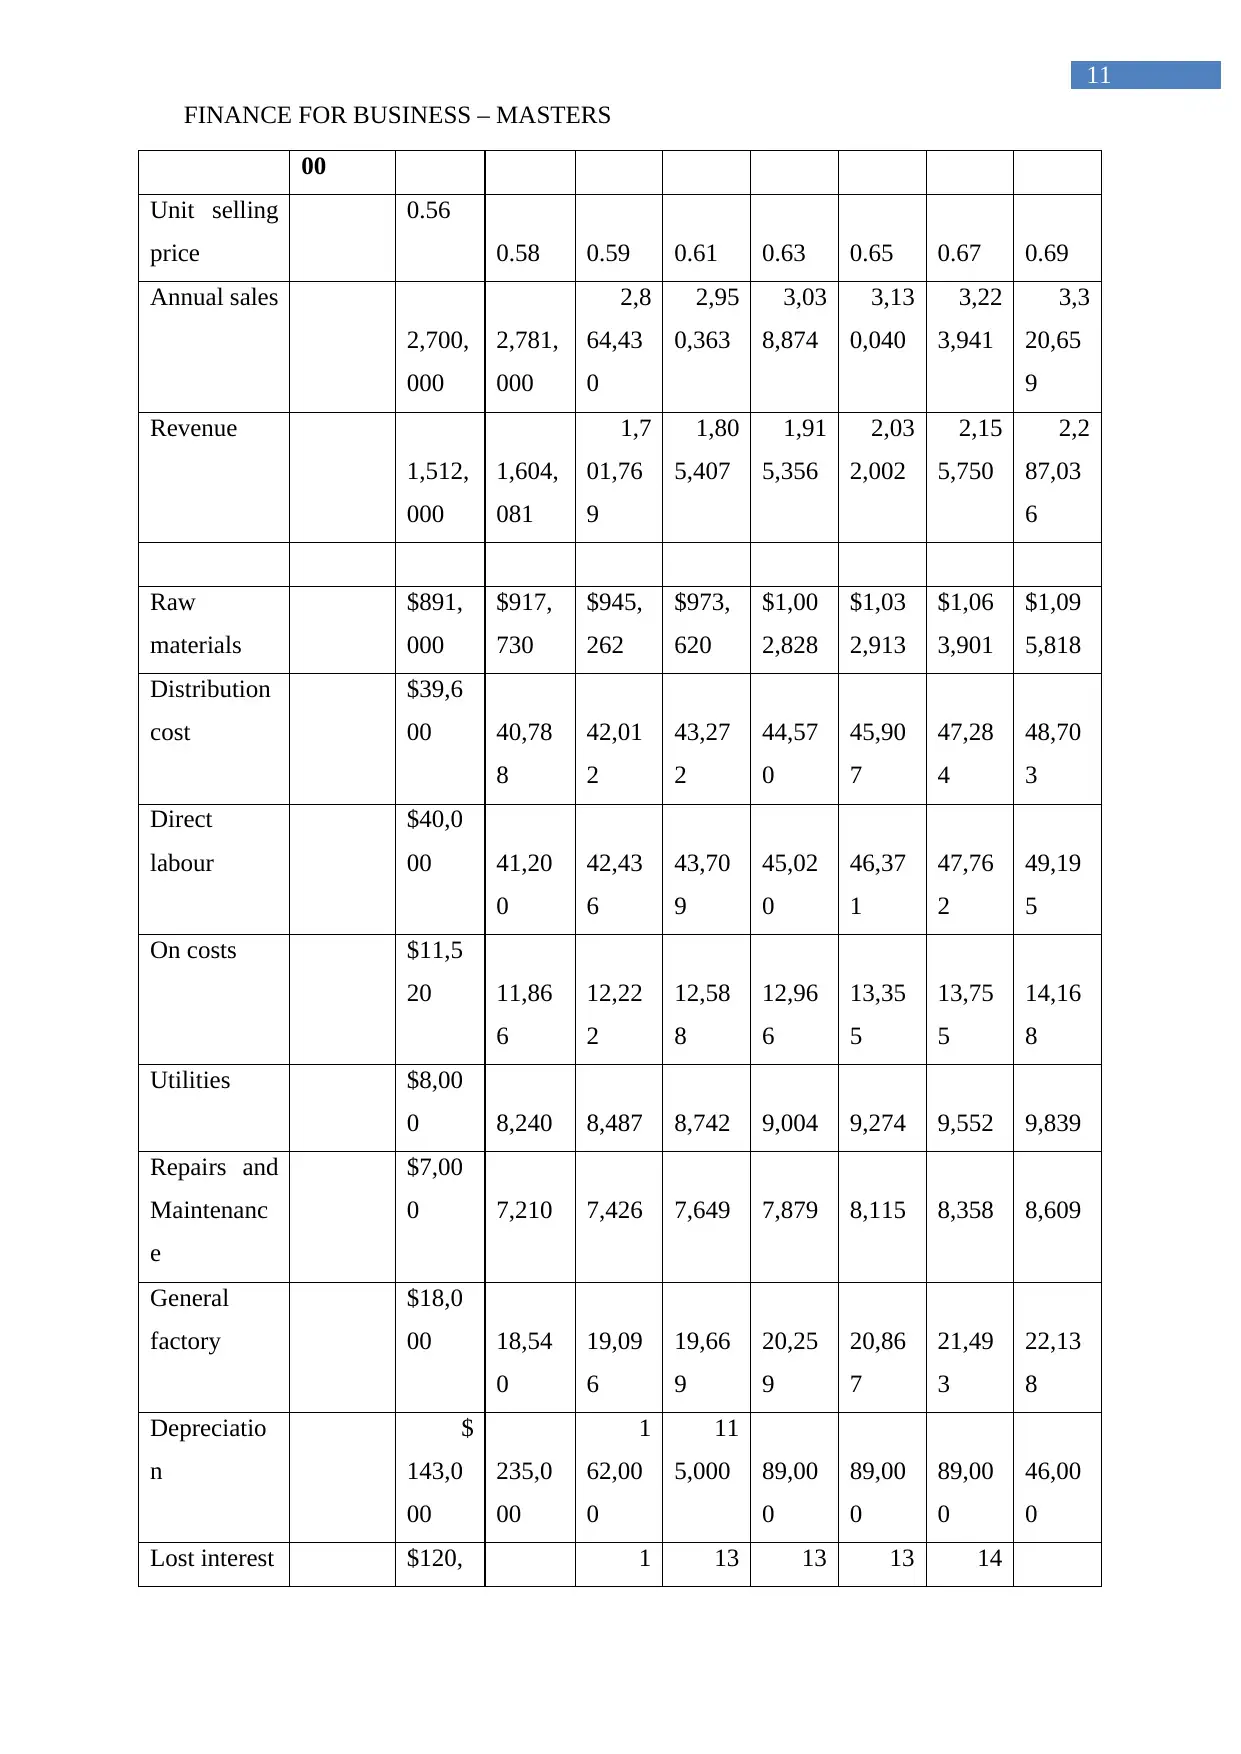
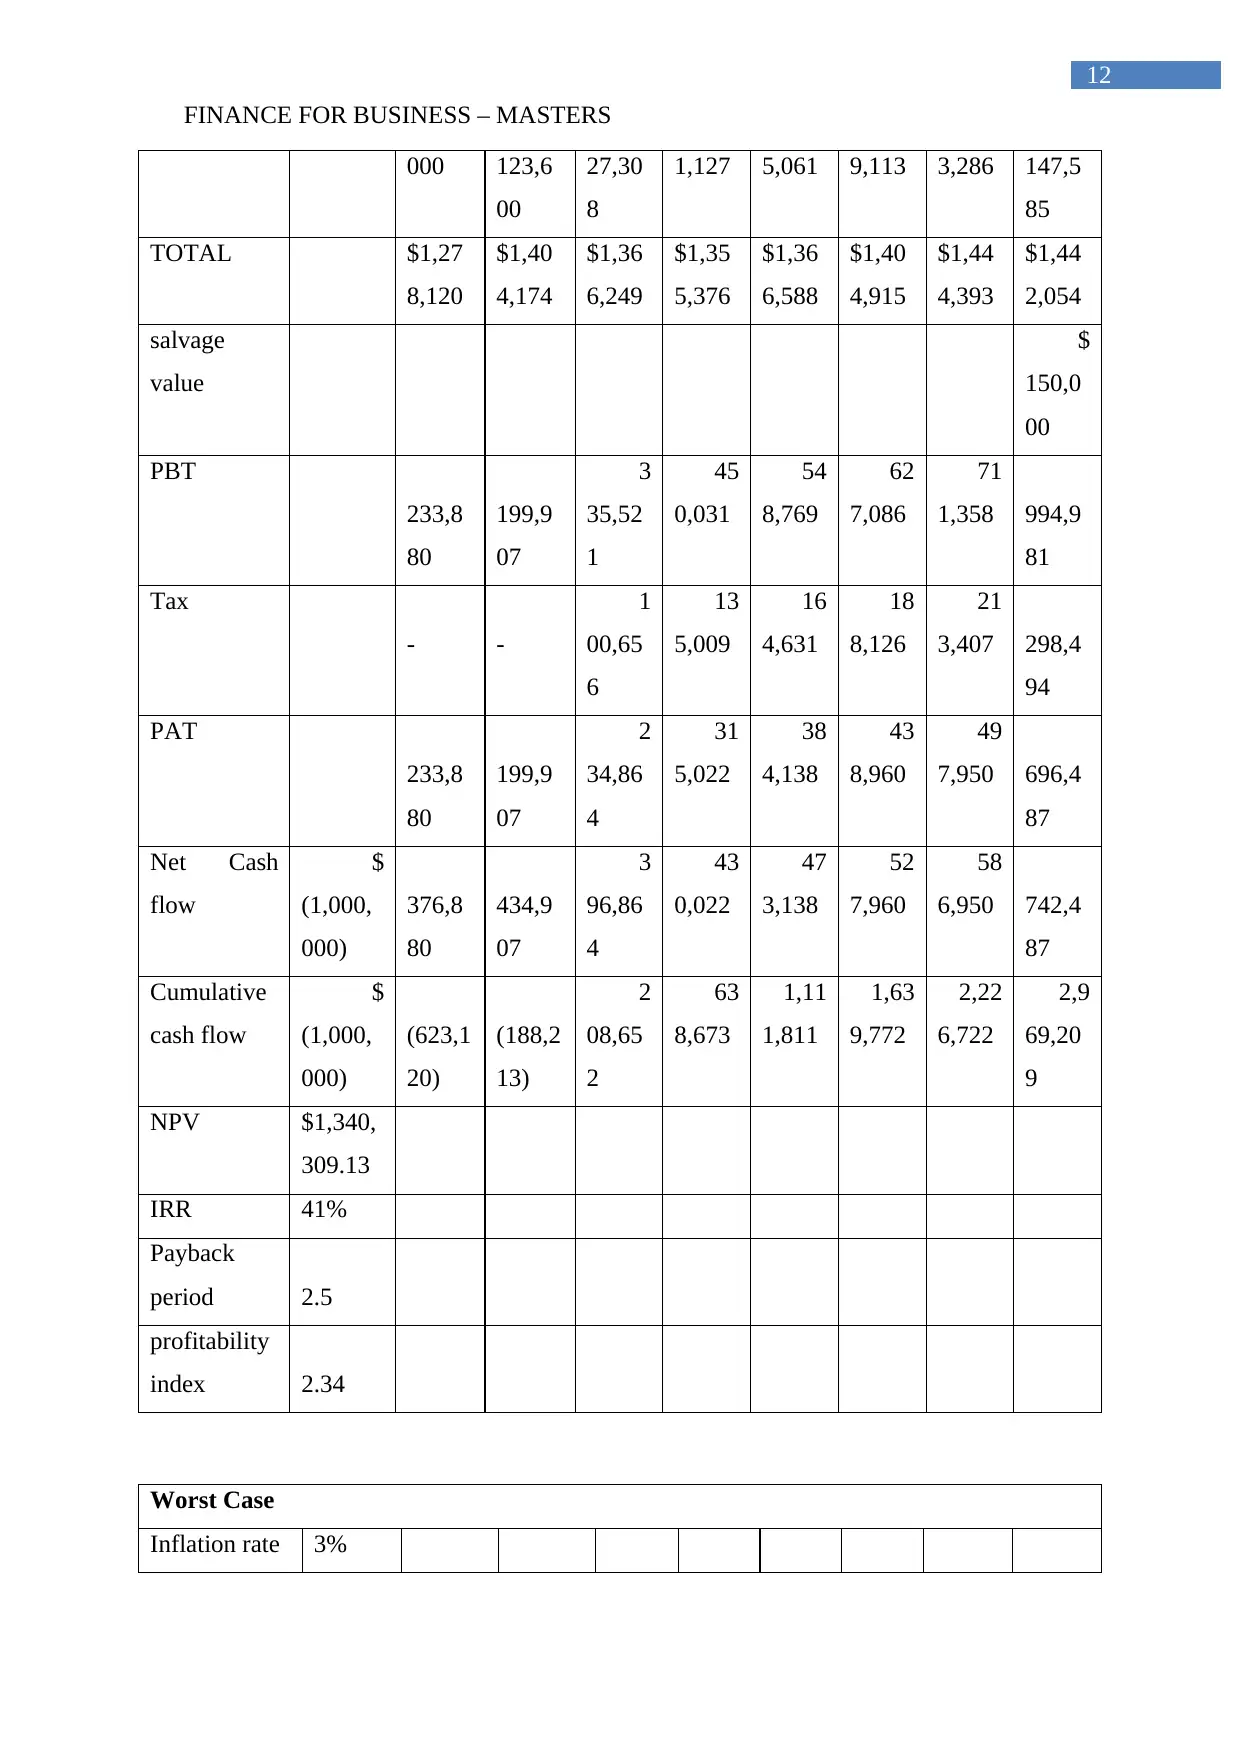
This finance project delves into the evaluation of a pipe production investment, encompassing a detailed analysis of cash flow, Net Present Value (NPV), Internal Rate of Return (IRR), and Profitability Index (PI). The project meticulously examines the exclusion of irrelevant accounts from financial exhibits, calculates incremental cash flows under various scenarios, and conducts sensitivity analyses to assess best-case and worst-case outcomes. It further involves calculating expected sales, standard deviations, and coefficients of variation to gauge risk. The project also explores the impact of increasing annual sales, discusses the rationale behind using high discount rates, and culminates in a recommendation regarding the production of 10-inch and 12-inch pipes. The analysis includes detailed financial tables, showcasing the project's financial viability and providing a comprehensive understanding of investment appraisal techniques.

1
FINANCE FOR BUSINESS – MASTERS
Finance for business – Masters
Name of the Student:
Name of the University:
Authors Note:
FINANCE FOR BUSINESS – MASTERS
Finance for business – Masters
Name of the Student:
Name of the University:
Authors Note:
Paraphrase This Document
Need a fresh take? Get an instant paraphrase of this document with our AI Paraphraser

2
FINANCE FOR BUSINESS – MASTERS
Table of Contents
1. Detecting the relevant accounts that need to be omitted from the list of Exhibit 3:..............3
2. Mentioning the calculation for the incremental cash flow table for most likely situation:....3
3. Calculating the NPV, internal rate of return (IRR) and profitability index (PI) for the
overall project:...........................................................................................................................5
4. Portraying the sensitivity analysis for best case and worst case scenario mentioned in
exhibit 1:.....................................................................................................................................6
5. Calculating the expected sales, standard deviation and coefficient variance from different
situations:.................................................................................................................................10
6. Increasing the annual sales by minimal value:.....................................................................10
7. Mentioning the reason behind using high discount rate when the inflation rate is at 3%:. .17
8. Mentioning the recommendation for the production of 10-in and 12-in Pipe to the
organisation:.............................................................................................................................18
Reference and Bibliography:....................................................................................................19

3
FINANCE FOR BUSINESS – MASTERS
1. Detecting the relevant accounts that need to be omitted from the list of Exhibit 3:
The evaluation of the overall case study and exhibit 3 mainly helps in identifying the
relevant accounts, which could be excluded from the list, as they serve no purpose. This
exclusion of the expenses account could actually help in identifying the actual value of the
project. Furthermore, indirect expense and space account is mainly excluded from the exhibit
3, which could help in identifying the actual benefits that could be provided from the project.
The relevant indirect expenses mainly accounts for supervisor salary, which needs to be
provided for the project. However, evaluation of the overall case study mainly helps in
identifying that no separate supervisor salary needs to be conducted for only this project, as
the existing supervisor will monitor during project. This will not increase the burden on the
current supervisor, as depicted in the case study, which will help in reducing the overall cost
of the project. Nevertheless, the relevant expenses of space need not be conducted by the
company for this particular project, as it is depicted in the case study that the empty space in
the current premises will be used for the project. Therefore, no rent or any kind of expenses
needs to be included for the current project. Hence, both indirect expenses and space
expenses can be excluded from exhibit 3 for deriving the actual value of the project. In this
context, Aggarwal & Thakur (2013) stated that evaluation of the overall project mainly helps
in identifying the relevant expenses that needs to be conducted for smoothly operating and
identifying the adequate net profit generated from operations.
2. Mentioning the calculation for the incremental cash flow table for most likely
situation:
Particulars 0 1 2 3 4 5 6 7 8
Initial
investment
$
1,000,0
00
Unit selling
price
0.56 0.58 0.59 0.61 0.63 0.65 0.67 0.69
Annual
sales
1,
650,00
0
1,
699,50
0
1,7
50,48
5
1,8
03,00
0
1,8
57,09
0
1,9
12,80
2
1,9
70,18
6
2,0
29,29
2
Revenue 1,0 1,1 1,1 1,2 1,3 1,3
⊘ This is a preview!⊘
Do you want full access?
Subscribe today to unlock all pages.

Trusted by 1+ million students worldwide

4
FINANCE FOR BUSINESS – MASTERS
924,00
0
980,27
2
39,97
0
03,30
4
70,49
6
41,77
9
17,40
3
97,63
3
Raw
materials
$544,5
00
$560,8
35
$577,
660
$594,
990
$612,
840
$631,
225
$650,
161
$669,
666
Distribution
cost
$33,00
0 33,990 35,01
0
36,06
0
37,14
2
38,25
6
39,40
4
40,58
6
Direct
labour
$40,00
0 41,200 42,43
6
43,70
9
45,02
0
46,37
1
47,76
2
49,19
5
On costs $11,52
0 11,866 12,22
2
12,58
8
12,96
6
13,35
5
13,75
5
14,16
8
Utilities $8,000
8,240 8,487 8,742 9,004 9,274 9,552 9,839
Repairs and
Maintenanc
e
$7,000
7,210 7,426 7,649 7,879 8,115 8,358 8,609
General
factory
$18,00
0 18,540 19,09
6
19,66
9
20,25
9
20,86
7
21,49
3
22,13
8
Depreciatio
n
$
143,00
0
235,00
0
1
62,00
0
1
15,00
0
89,00
0
89,00
0
89,00
0
46,00
0
Lost
interest
$120,0
00 123,60
0
1
27,30
8
1
31,12
7
1
35,06
1
1
39,11
3
1
43,28
6
147,5
85
TOTAL $925,0
20
$1,040,
481
$991,
645
$969,
534
$969,
170
$995,
576
$1,02
2,773
$1,00
7,786
salvage
value
$
150,0
00
Paraphrase This Document
Need a fresh take? Get an instant paraphrase of this document with our AI Paraphraser

5
FINANCE FOR BUSINESS – MASTERS
PBT
(1,020) (60,209
)
48,32
5
1
33,77
0
2
01,32
5
2
46,20
3
2
94,63
0
539,8
47
Tax
- - 14,49
8
40,13
1
60,39
8
73,86
1
88,38
9
161,9
54
PAT
(1,020) (60,209
)
33,82
8
93,63
9
1
40,92
8
1
72,34
2
2
06,24
1
377,8
93
Net Cash
flow
$
(1,000,
000)
141,98
0
174,79
1
1
95,82
8
2
08,63
9
2
29,92
8
2
61,34
2
2
95,24
1
423,8
93
3. Calculating the NPV, internal rate of return (IRR) and profitability index (PI) for the
overall project:
Particular
s
Year 0 Year 1 Year 2 Year
3
Year
4
Year
5
Year
6
Year
7
Year
8
Net Cash
flow
$
(1,000,
000)
141,980 174,791
1
95,82
8
2
08,63
9
2
29,92
8
2
61,34
2
2
95,24
1
4
23,893
Cumulativ
e cash
flow
$
(1,000,
000)
(
858,020
)
(
683,229
)
(4
87,40
1)
(27
8,762
)
(4
8,835
)
2
12,50
7
5
07,74
9
9
31,641
NPV $202,7
01.90
IRR 14%
Payback
period
5.2
Profitabilit
y index
1.20
The evaluation of a case study directly indicates the payback period of 5 years is
mainly needed by the organisation from the project to allow it as feasible. However, the

6
FINANCE FOR BUSINESS – MASTERS
overall project has a payback period of 5.2 years, which is a relatively higher than the actual
criteria of the organisation. This non-fulfilment of the specific payback period could directly
force the organisation to reject the overall project. Nevertheless, the profitability index
directly indicates a value of 1.20, which directly states relevant profits that could be incurred
from the project. Moreover, the NPV of the project is $202,701.90, while the IRR is 14%,
which directly indicates the overall viability of the project. Awojobi & Jenkins (2016) stated
that use of adequate investment appraisal techniques could eventually allow the organisation
to identify the relevant viability of the investment and the adequate returns which could be
provided after completion of the project.
4. Portraying the sensitivity analysis for best case and worst case scenario mentioned in
exhibit 1:
Worst Case Scenario
Particulars 0 1 2 3 4 5 6 7 8
Initial
investment
$
1,000,0
00
Unit selling
price
0.56 0.58 0.59 0.61 0.63 0.65 0.67 0.69
Annual
sales
1,
350,00
0
1,
390,50
0
1,4
32,21
5
1,4
75,18
1
1,5
19,43
7
1,5
65,02
0
1,6
11,97
1
1,6
60,33
0
Revenue
756,00
0
802,04
0
8
50,88
5
9
02,70
4
9
57,67
8
1,0
16,00
1
1,0
77,87
5
1,1
43,51
8
Raw
materials
$445,5
00
$458,8
65
$472,
631
$486,
810
$501,
414
$516,
457
$531,
950
$547,
909
Distribution
cost
$33,00
0 33,990 35,01
0
36,06
0
37,14
2
38,25
6
39,40
4
40,58
6
Direct
labour
$40,00
0 41,200 42,43 43,70 45,02 46,37 47,76 49,19
⊘ This is a preview!⊘
Do you want full access?
Subscribe today to unlock all pages.

Trusted by 1+ million students worldwide

7
FINANCE FOR BUSINESS – MASTERS
6 9 0 1 2 5
On costs $11,52
0 11,866 12,22
2
12,58
8
12,96
6
13,35
5
13,75
5
14,16
8
Utilities $8,000
8,240 8,487 8,742 9,004 9,274 9,552 9,839
Repairs and
Maintenanc
e
$7,000
7,210 7,426 7,649 7,879 8,115 8,358 8,609
General
factory
$18,00
0 18,540 19,09
6
19,66
9
20,25
9
20,86
7
21,49
3
22,13
8
Depreciatio
n
$
143,00
0
235,00
0
1
62,00
0
1
15,00
0
89,00
0
89,00
0
89,00
0
46,00
0
Lost
interest
$120,0
00 123,60
0
1
27,30
8
1
31,12
7
1
35,06
1
1
39,11
3
1
43,28
6
147,5
85
TOTAL $826,0
20
$938,5
11
$886,
616
$861,
354
$857,
745
$880,
807
$904,
562
$886,
028
salvage
value
$
150,0
00
PBT
(70,020
)
(
136,47
0)
(
35,73
1)
41,34
9
99,93
3
1
35,19
3
1
73,31
4
407,4
89
Tax
- -
(
10,71
9)
12,40
5
29,98
0
40,55
8
51,99
4
122,2
47
PAT
(70,020
)
(
136,47
0)
(
25,01
2)
28,94
4
69,95
3
94,63
5
1
21,32
0
285,2
43
Net Cash $ 1 1 1 1 2
Paraphrase This Document
Need a fresh take? Get an instant paraphrase of this document with our AI Paraphraser

8
FINANCE FOR BUSINESS – MASTERS
flow (1,000,0
00)
72,980 98,530 36,98
8
43,94
4
58,95
3
83,63
5
10,32
0
331,2
43
Cumulative
cash flow
$
(1,000,0
00)
(
927,02
0)
(
828,49
0)
(6
91,50
2)
(54
7,558
)
(38
8,604
)
(20
4,969
)
5,350 336,5
93
NPV ($186,1
78.69)
IRR 6%
Payback
period 7.0
profitability
index 0.81
Best Case Scenario
Particulars 0 1 2 3 4 5 6 7 8
Initial
investment
$
1,000,
000
Unit selling
price
0.56 0.58 0.59 0.61 0.63 0.65 0.67 0.69
Annual sales 2
,250,0
00
2
,317,5
00
2,3
87,02
5
2,45
8,636
2,53
2,395
2,60
8,367
2,68
6,618
2,7
67,21
6
Revenue 1
,260,0
00
1
,336,7
34
1,4
18,14
1
1,50
4,506
1,59
6,130
1,69
3,335
1,79
6,459
1,9
05,86
3
Raw
materials
$742,5
00
$764,7
75
$787,
718
$811,
350
$835,
690
$860,
761
$886,
584
$913,
181
Distribution
cost
$33,00
0 33,990 35,01
0
36,06
0
37,14
2
38,25
6
39,40
4
40,58
6
Direct labour $40,00

9
FINANCE FOR BUSINESS – MASTERS
0 41,200 42,43
6
43,70
9
45,02
0
46,37
1
47,76
2
49,19
5
On costs $11,52
0 11,866 12,22
2
12,58
8
12,96
6
13,35
5
13,75
5
14,16
8
Utilities $8,000
8,240 8,487 8,742 9,004 9,274 9,552 9,839
Repairs and
Maintenance
$7,000
7,210 7,426 7,649 7,879 8,115 8,358 8,609
General
factory
$18,00
0 18,540 19,09
6
19,66
9
20,25
9
20,86
7
21,49
3
22,13
8
Depreciation $
143,00
0
235,00
0
1
62,00
0
11
5,000 89,00
0
89,00
0
89,00
0
46,00
0
Lost interest $120,0
00 123,60
0
1
27,30
8
13
1,127
13
5,061
13
9,113
14
3,286 147,5
85
TOTAL $1,123
,020
$1,244
,421
$1,20
1,703
$1,18
5,894
$1,19
2,021
$1,22
5,112
$1,25
9,195
$1,25
1,301
salvage value $
150,0
00
PBT
136,98
0
92,313
2
16,43
8
31
8,612
40
4,109
46
8,223
53
7,264 804,5
62
Tax
- - 64,93
1
95,58
3
12
1,233
14
0,467
16
1,179 241,3
69
PAT
136,98
0
92,313
1
51,50
7
22
3,028
28
2,876
32
7,756
37
6,085 563,1
93
Net Cash $ 3 33 37 41 46
⊘ This is a preview!⊘
Do you want full access?
Subscribe today to unlock all pages.

Trusted by 1+ million students worldwide

10
FINANCE FOR BUSINESS – MASTERS
flow (1,000,
000)
279,98
0
327,31
3
13,50
7
8,028 1,876 6,756 5,085 609,1
93
Cumulative
cash flow
$
(1,000,
000)
(720,0
20)
(
392,70
7)
(
79,20
0)
25
8,828
63
0,704
1,04
7,460
1,51
2,545
2,1
21,73
8
NPV $980,4
63.07
IRR 30%
Payback
period
3.2
profitability
index
1.98
5. Calculating the expected sales, standard deviation and coefficient variance from
different situations:
Particulars NPV Probability
Worst case ($186,178.69) 0.1
Most likely $202,701.90 0.6
Best case $980,463.07 0.3
Expected NPV $397,142.19
Standard deviation of NPV $ 398,484.02
Coefficient of variation of NPV 1.0034
6. Increasing the annual sales by minimal value:
Best Case
Inflation
rate
3%
minimum
increment
20%
Particulars 0 1 2 3 4 5 6 7 8
Initial
investment
$
1,000,0
Paraphrase This Document
Need a fresh take? Get an instant paraphrase of this document with our AI Paraphraser

11
FINANCE FOR BUSINESS – MASTERS
00
Unit selling
price
0.56
0.58 0.59 0.61 0.63 0.65 0.67 0.69
Annual sales
2,700,
000
2,781,
000
2,8
64,43
0
2,95
0,363
3,03
8,874
3,13
0,040
3,22
3,941
3,3
20,65
9
Revenue
1,512,
000
1,604,
081
1,7
01,76
9
1,80
5,407
1,91
5,356
2,03
2,002
2,15
5,750
2,2
87,03
6
Raw
materials
$891,
000
$917,
730
$945,
262
$973,
620
$1,00
2,828
$1,03
2,913
$1,06
3,901
$1,09
5,818
Distribution
cost
$39,6
00 40,78
8
42,01
2
43,27
2
44,57
0
45,90
7
47,28
4
48,70
3
Direct
labour
$40,0
00 41,20
0
42,43
6
43,70
9
45,02
0
46,37
1
47,76
2
49,19
5
On costs $11,5
20 11,86
6
12,22
2
12,58
8
12,96
6
13,35
5
13,75
5
14,16
8
Utilities $8,00
0 8,240 8,487 8,742 9,004 9,274 9,552 9,839
Repairs and
Maintenanc
e
$7,00
0 7,210 7,426 7,649 7,879 8,115 8,358 8,609
General
factory
$18,0
00 18,54
0
19,09
6
19,66
9
20,25
9
20,86
7
21,49
3
22,13
8
Depreciatio
n
$
143,0
00
235,0
00
1
62,00
0
11
5,000 89,00
0
89,00
0
89,00
0
46,00
0
Lost interest $120, 1 13 13 13 14

12
FINANCE FOR BUSINESS – MASTERS
000 123,6
00
27,30
8
1,127 5,061 9,113 3,286 147,5
85
TOTAL $1,27
8,120
$1,40
4,174
$1,36
6,249
$1,35
5,376
$1,36
6,588
$1,40
4,915
$1,44
4,393
$1,44
2,054
salvage
value
$
150,0
00
PBT
233,8
80
199,9
07
3
35,52
1
45
0,031
54
8,769
62
7,086
71
1,358 994,9
81
Tax
- -
1
00,65
6
13
5,009
16
4,631
18
8,126
21
3,407 298,4
94
PAT
233,8
80
199,9
07
2
34,86
4
31
5,022
38
4,138
43
8,960
49
7,950 696,4
87
Net Cash
flow
$
(1,000,
000)
376,8
80
434,9
07
3
96,86
4
43
0,022
47
3,138
52
7,960
58
6,950 742,4
87
Cumulative
cash flow
$
(1,000,
000)
(623,1
20)
(188,2
13)
2
08,65
2
63
8,673
1,11
1,811
1,63
9,772
2,22
6,722
2,9
69,20
9
NPV $1,340,
309.13
IRR 41%
Payback
period 2.5
profitability
index 2.34
Worst Case
Inflation rate 3%
⊘ This is a preview!⊘
Do you want full access?
Subscribe today to unlock all pages.

Trusted by 1+ million students worldwide
1 out of 19
Related Documents
Your All-in-One AI-Powered Toolkit for Academic Success.
+13062052269
info@desklib.com
Available 24*7 on WhatsApp / Email
Unlock your academic potential
Copyright © 2020–2026 A2Z Services. All Rights Reserved. Developed and managed by ZUCOL.


