Project Execution & Control: Report Template Comparisons Analysis

Verified

Added on  2023/06/13

|4
|752
|493
Report
AI Summary
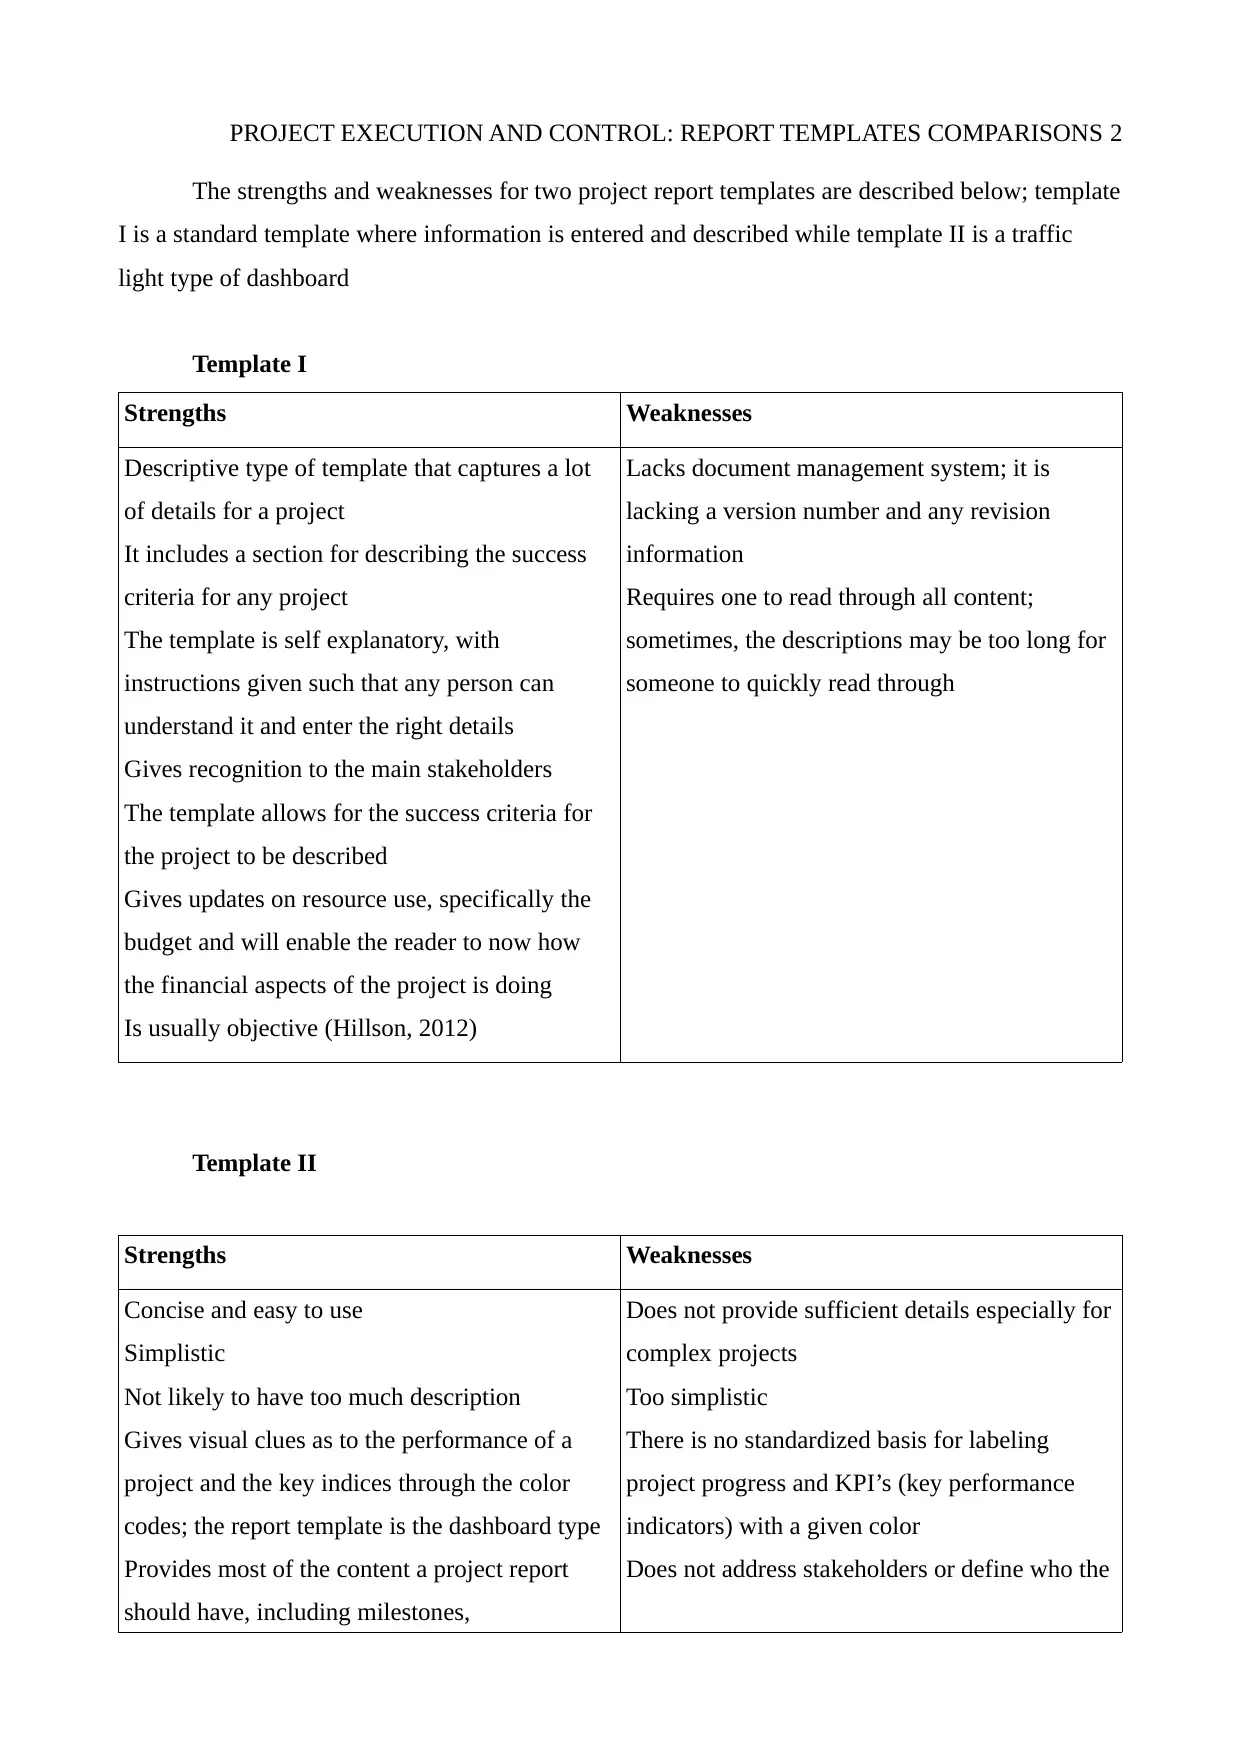
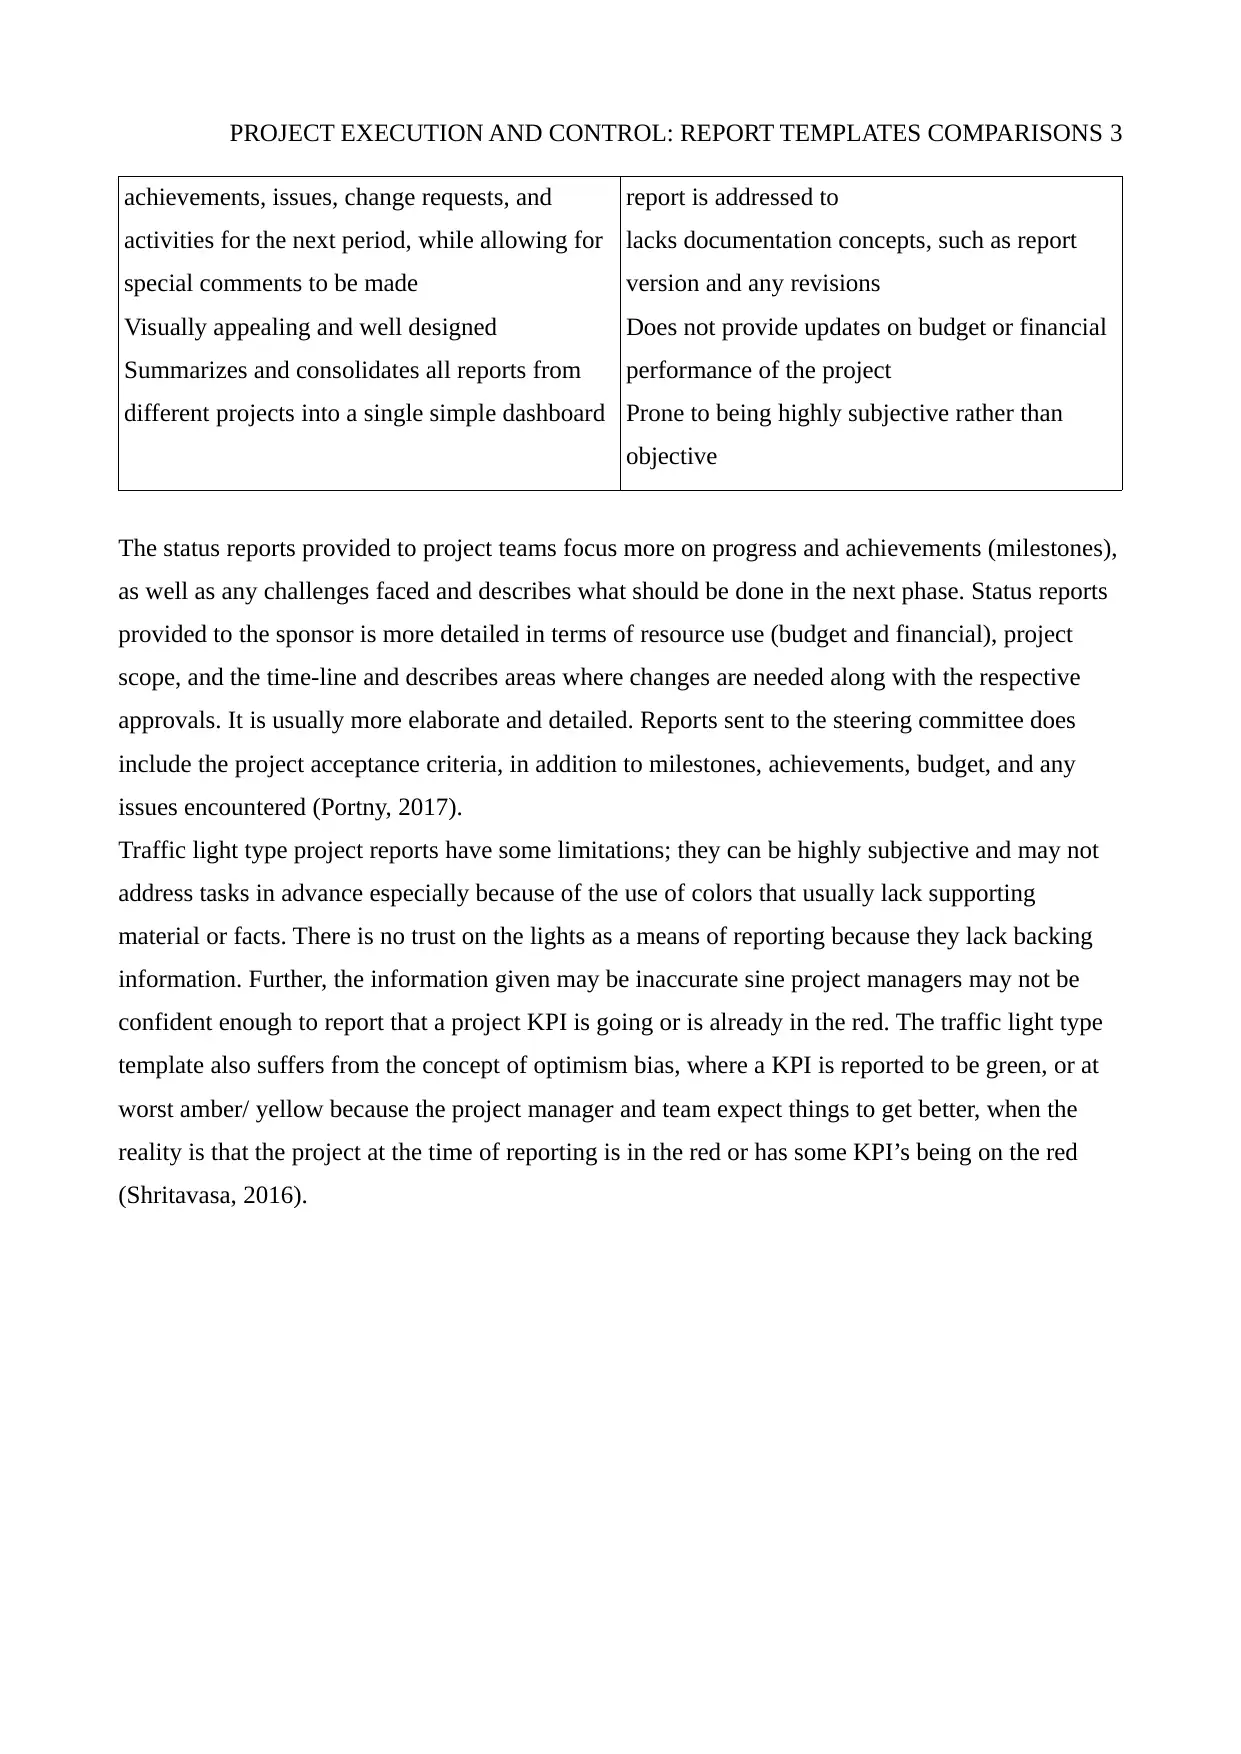
This report provides a detailed comparison of two project report templates, analyzing their strengths and weaknesses in the context of project execution and control. Template I is a standard descriptive template, while Template II is a traffic light dashboard. The analysis covers aspects such as information capture, document management, clarity, stakeholder recognition, resource use, and objectivity. The report also discusses the limitations of traffic light reports, including subjectivity and potential for optimism bias. It further differentiates status reports for project teams, sponsors, and steering committees, highlighting the varying levels of detail and focus required for each audience.
tabler-icon-diamond-filled.svg

Contribute Materials

Your contribution can guide someone’s learning journey. Share your documents today.
Document Page
PROJECT EXECUTION AND CONTROL: REPORT TEMPLATES COMPARISONS 1
Project Execution and Control: Report Templates Comparisons
Name
Date
tabler-icon-diamond-filled.svg

Secure Best Marks with AI Grader

Need help grading? Try our AI Grader for instant feedback on your assignments.
Document Page
PROJECT EXECUTION AND CONTROL: REPORT TEMPLATES COMPARISONS 2
The strengths and weaknesses for two project report templates are described below; template
I is a standard template where information is entered and described while template II is a traffic
light type of dashboard
Template I
Strengths Weaknesses
Descriptive type of template that captures a lot
of details for a project
It includes a section for describing the success
criteria for any project
The template is self explanatory, with
instructions given such that any person can
understand it and enter the right details
Gives recognition to the main stakeholders
The template allows for the success criteria for
the project to be described
Gives updates on resource use, specifically the
budget and will enable the reader to now how
the financial aspects of the project is doing
Is usually objective (Hillson, 2012)
Lacks document management system; it is
lacking a version number and any revision
information
Requires one to read through all content;
sometimes, the descriptions may be too long for
someone to quickly read through
Template II
Strengths Weaknesses
Concise and easy to use
Simplistic
Not likely to have too much description
Gives visual clues as to the performance of a
project and the key indices through the color
codes; the report template is the dashboard type
Provides most of the content a project report
should have, including milestones,
Does not provide sufficient details especially for
complex projects
Too simplistic
There is no standardized basis for labeling
project progress and KPI’s (key performance
indicators) with a given color
Does not address stakeholders or define who the
Document Page
PROJECT EXECUTION AND CONTROL: REPORT TEMPLATES COMPARISONS 3
achievements, issues, change requests, and
activities for the next period, while allowing for
special comments to be made
Visually appealing and well designed
Summarizes and consolidates all reports from
different projects into a single simple dashboard
report is addressed to
lacks documentation concepts, such as report
version and any revisions
Does not provide updates on budget or financial
performance of the project
Prone to being highly subjective rather than
objective
The status reports provided to project teams focus more on progress and achievements (milestones),
as well as any challenges faced and describes what should be done in the next phase. Status reports
provided to the sponsor is more detailed in terms of resource use (budget and financial), project
scope, and the time-line and describes areas where changes are needed along with the respective
approvals. It is usually more elaborate and detailed. Reports sent to the steering committee does
include the project acceptance criteria, in addition to milestones, achievements, budget, and any
issues encountered (Portny, 2017).
Traffic light type project reports have some limitations; they can be highly subjective and may not
address tasks in advance especially because of the use of colors that usually lack supporting
material or facts. There is no trust on the lights as a means of reporting because they lack backing
information. Further, the information given may be inaccurate sine project managers may not be
confident enough to report that a project KPI is going or is already in the red. The traffic light type
template also suffers from the concept of optimism bias, where a KPI is reported to be green, or at
worst amber/ yellow because the project manager and team expect things to get better, when the
reality is that the project at the time of reporting is in the red or has some KPI’s being on the red
(Shritavasa, 2016).
Document Page
PROJECT EXECUTION AND CONTROL: REPORT TEMPLATES COMPARISONS 4
References
Hillson, D., & Simon, P. (2012). Practical Project Risk Management: The ATOM Methodology.
Tysons Corner: Management Concepts.
Portny, S. (2017). How to Use a Project Dashboard for Your Project-Progress Report - dummies.
Dummies. Retrieved 26 April 2018, from http://www.dummies.com/careers/project-
management/how-to-use-a-project-dashboard-for-your-project-progress-report/
Shrivastava, D. (2016). Traffic Lights in Project Management – What is it?. Linked In. Retrieved 26
April 2018, from https://www.linkedin.com/pulse/traffic-lights-project-management-what-
dhiraj-shrivastava
chevron_up_icon
1 out of 4
circle_padding
hide_on_mobile
zoom_out_icon
logo.png

Your All-in-One AI-Powered Toolkit for Academic Success.

Available 24*7 on WhatsApp / Email

[object Object]