Sensitivity Analysis and Due Diligence in Project Development
VerifiedAdded on 2023/03/20
|17
|3367
|45
Report
AI Summary
This report analyzes project development and optimization, focusing on sensitivity analysis and the due diligence process. It explores the impact of various parameters on project outcomes, including operating costs, legal expenses, and revenues, using sensitivity analysis to identify critical variables. The report examines different scenarios based on economic analysis, evaluating factors such as capital and maintenance costs. It also details the due diligence process, outlining its scope, information needs, and the involvement of stakeholders. The report further provides a planned information flow and activities to engage stakeholders, sponsors, and supporters effectively. By employing a structured approach, the report aims to offer a detailed understanding of project development strategies and risk management.
Running head: PROJECT DEVELOPMENT AND OPTIMISATION
PROJECT DEVELOPMENT AND OPTIMISATION: Sensitivity Analysis
Name of the Student:
Name of the University:
Author Note:
PROJECT DEVELOPMENT AND OPTIMISATION: Sensitivity Analysis
Name of the Student:
Name of the University:
Author Note:
Paraphrase This Document
Need a fresh take? Get an instant paraphrase of this document with our AI Paraphraser
1PROJECT DEVELOPMENT AND OPTIMISATION
Table of Contents
Introduction................................................................................................................................2
Sensitivity analysis.....................................................................................................................2
Justification of the Parameters...................................................................................................4
Different Scenario based on the economic analysis...................................................................6
Due Diligence Process...............................................................................................................9
Scope of the Due Diligence Process........................................................................................11
Information Needs....................................................................................................................12
Conclusion................................................................................................................................12
References................................................................................................................................13
2PROJECT DEVELOPMENT AND OPTIMISATION
Introduction
Sensitivity Analysis is a modelling tool which is utilized in financial department to
study the affect of the various set of independent variables on a particular dependent variable
considering some specific condition. It is used in various fields like geography, biology,
engineering and economics. It is basically used in the analysis of “Black Box Process” where
the outcome is the opaque function of the inputs. An opaque function is such type of function
where the process is not analyses or studied due to certain reasons like, climatic conditions in
geography are too complex due to which the association between the input and the out is not
realized. It helps in locating the main variables which are playing a significant role in cost
and benefits of the project which includes operating costs, legal costs, expenses, revenues,
demands and financial benefits. The report mainly focuses on the project development and
optimisation with respect to the sensitivity analysis and the due diligence process. The report
briefly describes about the sensitivity analysis, parameters used in such kind of analysis,
various scenarios based on the economic analysis, due diligence process, Scope of the due
diligence process and the information needs of the stakeholders, project sponsors and others.
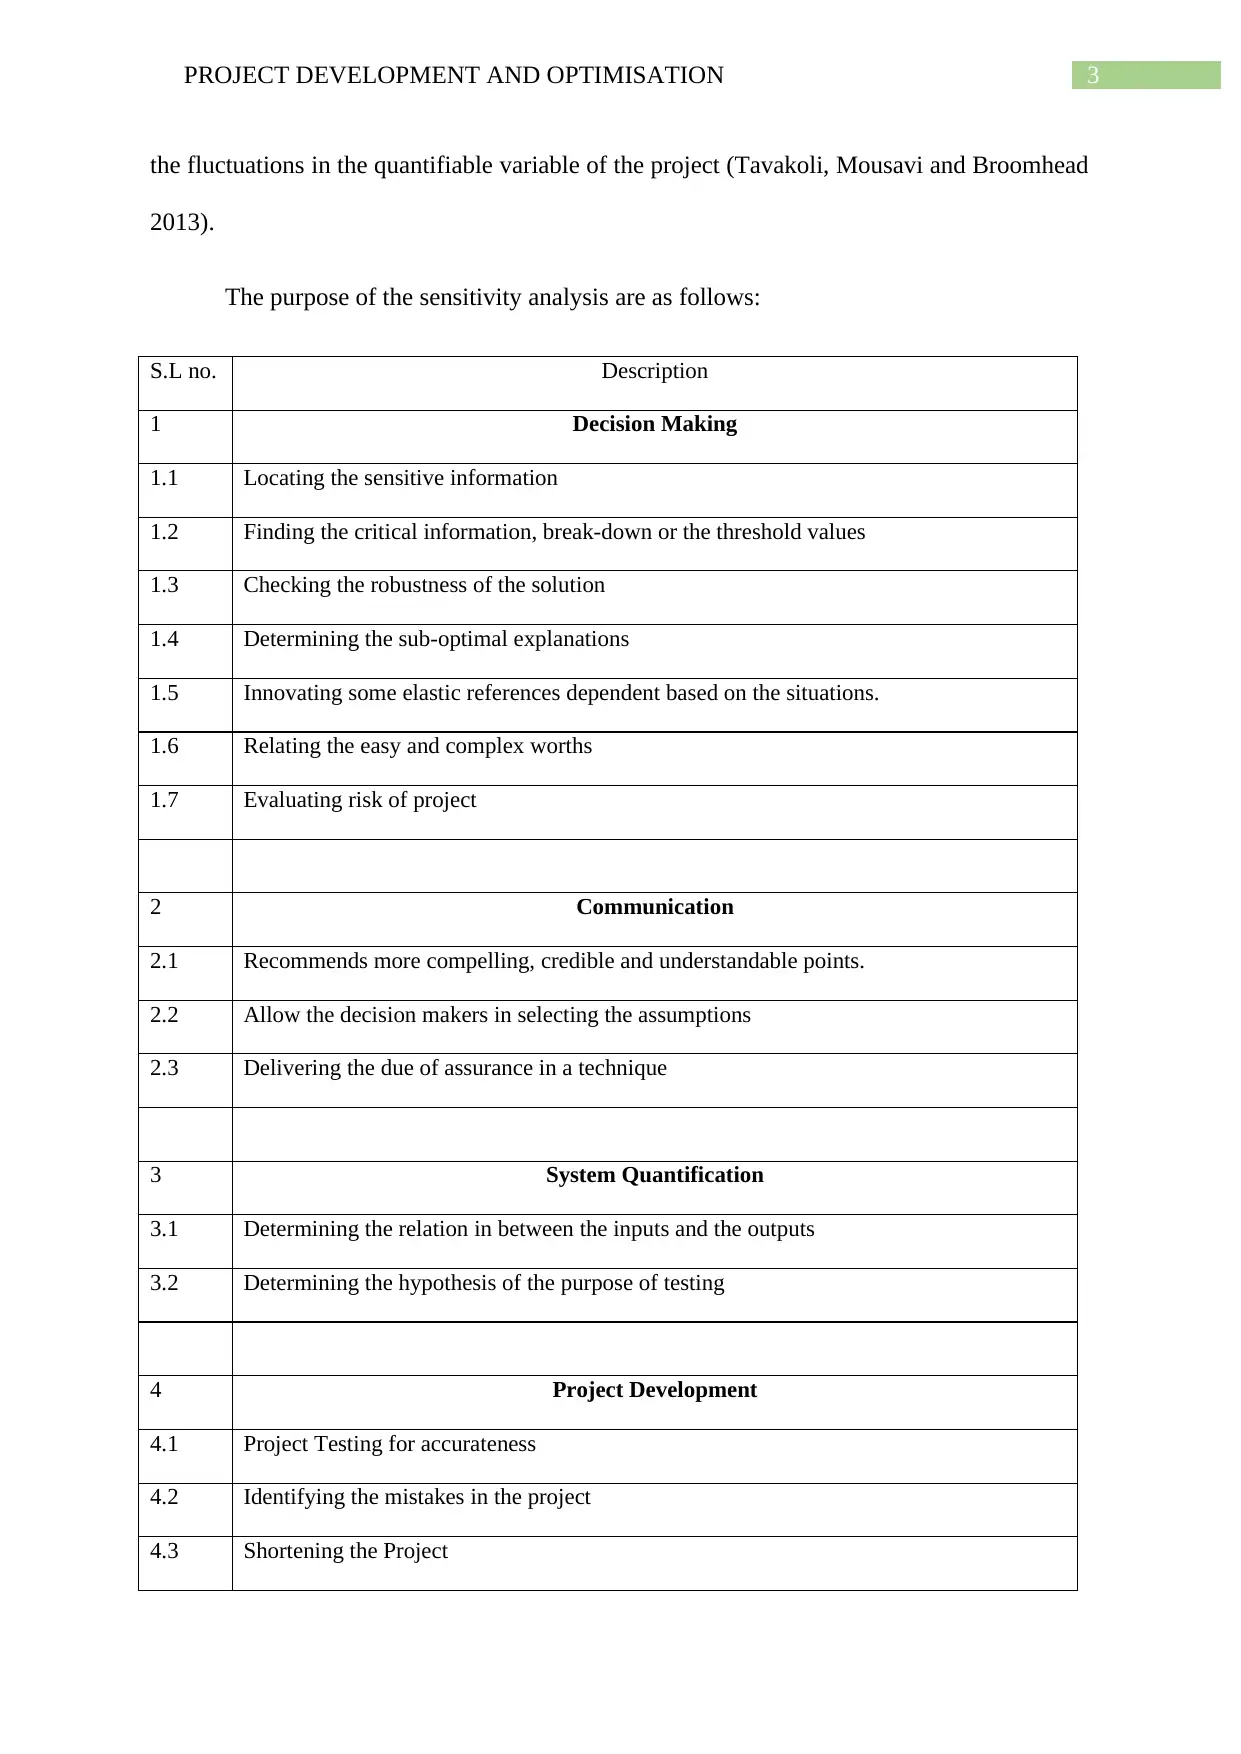
Sensitivity analysis
The environment of every business is too unstable. It changes or fluctuates quickly
which can damage the business in large amount. The unstable factors of the business are the
external factors of the business like change in sales which can decrease the sales of the
business and the organization can suffer a huge loss (Björkdahl and Holmén 2013). These
external factors should be analysed or studied in a regular way by the organizations. Regular
analysis of the external factors of the business can prevent the company from such type of
losses. To analyse such type of external factors, the sensitivity analysis is used which finds
Introduction
Sensitivity Analysis is a modelling tool which is utilized in financial department to
study the affect of the various set of independent variables on a particular dependent variable
considering some specific condition. It is used in various fields like geography, biology,
engineering and economics. It is basically used in the analysis of “Black Box Process” where
the outcome is the opaque function of the inputs. An opaque function is such type of function
where the process is not analyses or studied due to certain reasons like, climatic conditions in
geography are too complex due to which the association between the input and the out is not
realized. It helps in locating the main variables which are playing a significant role in cost
and benefits of the project which includes operating costs, legal costs, expenses, revenues,
demands and financial benefits. The report mainly focuses on the project development and
optimisation with respect to the sensitivity analysis and the due diligence process. The report
briefly describes about the sensitivity analysis, parameters used in such kind of analysis,
various scenarios based on the economic analysis, due diligence process, Scope of the due
diligence process and the information needs of the stakeholders, project sponsors and others.
Sensitivity analysis
The environment of every business is too unstable. It changes or fluctuates quickly
which can damage the business in large amount. The unstable factors of the business are the
external factors of the business like change in sales which can decrease the sales of the
business and the organization can suffer a huge loss (Björkdahl and Holmén 2013). These
external factors should be analysed or studied in a regular way by the organizations. Regular
analysis of the external factors of the business can prevent the company from such type of
losses. To analyse such type of external factors, the sensitivity analysis is used which finds
⊘ This is a preview!⊘
Do you want full access?
Subscribe today to unlock all pages.
Trusted by 1+ million students worldwide
3PROJECT DEVELOPMENT AND OPTIMISATION
the fluctuations in the quantifiable variable of the project (Tavakoli, Mousavi and Broomhead
2013).
The purpose of the sensitivity analysis are as follows:
S.L no. Description
1 Decision Making
1.1 Locating the sensitive information
1.2 Finding the critical information, break-down or the threshold values
1.3 Checking the robustness of the solution
1.4 Determining the sub-optimal explanations
1.5 Innovating some elastic references dependent based on the situations.
1.6 Relating the easy and complex worths
1.7 Evaluating risk of project
2 Communication
2.1 Recommends more compelling, credible and understandable points.
2.2 Allow the decision makers in selecting the assumptions
2.3 Delivering the due of assurance in a technique
3 System Quantification
3.1 Determining the relation in between the inputs and the outputs
3.2 Determining the hypothesis of the purpose of testing
4 Project Development
4.1 Project Testing for accurateness
4.2 Identifying the mistakes in the project
4.3 Shortening the Project
Paraphrase This Document
Need a fresh take? Get an instant paraphrase of this document with our AI Paraphraser
4PROJECT DEVELOPMENT AND OPTIMISATION
4.4 Standardizing the project
4.5 Investing the missing data
4.6 Prioritising the acquisition of the information.
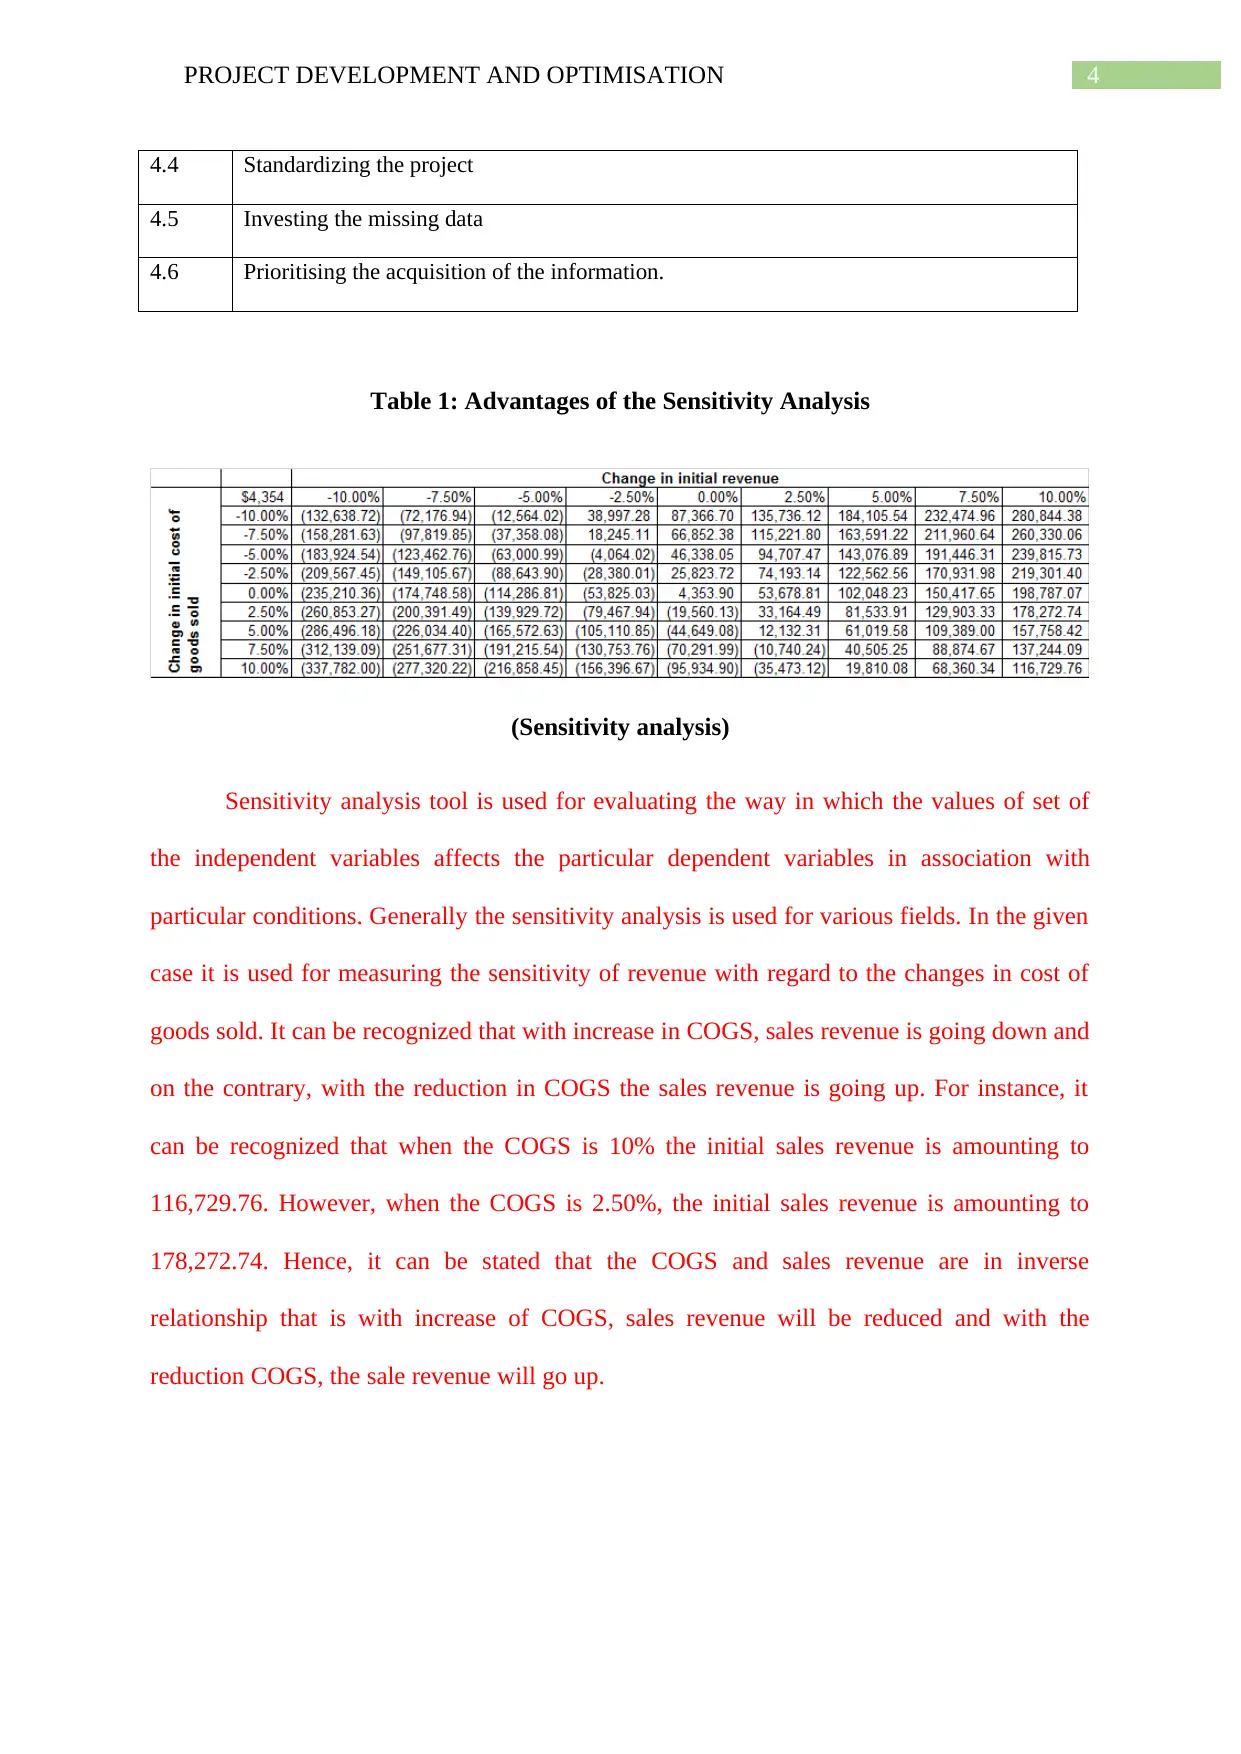
Table 1: Advantages of the Sensitivity Analysis
(Sensitivity analysis)
Sensitivity analysis tool is used for evaluating the way in which the values of set of
the independent variables affects the particular dependent variables in association with
particular conditions. Generally the sensitivity analysis is used for various fields. In the given
case it is used for measuring the sensitivity of revenue with regard to the changes in cost of
goods sold. It can be recognized that with increase in COGS, sales revenue is going down and
on the contrary, with the reduction in COGS the sales revenue is going up. For instance, it
can be recognized that when the COGS is 10% the initial sales revenue is amounting to
116,729.76. However, when the COGS is 2.50%, the initial sales revenue is amounting to
178,272.74. Hence, it can be stated that the COGS and sales revenue are in inverse
relationship that is with increase of COGS, sales revenue will be reduced and with the
reduction COGS, the sale revenue will go up.
4.4 Standardizing the project
4.5 Investing the missing data
4.6 Prioritising the acquisition of the information.
Table 1: Advantages of the Sensitivity Analysis
(Sensitivity analysis)
Sensitivity analysis tool is used for evaluating the way in which the values of set of
the independent variables affects the particular dependent variables in association with
particular conditions. Generally the sensitivity analysis is used for various fields. In the given
case it is used for measuring the sensitivity of revenue with regard to the changes in cost of
goods sold. It can be recognized that with increase in COGS, sales revenue is going down and
on the contrary, with the reduction in COGS the sales revenue is going up. For instance, it
can be recognized that when the COGS is 10% the initial sales revenue is amounting to
116,729.76. However, when the COGS is 2.50%, the initial sales revenue is amounting to
178,272.74. Hence, it can be stated that the COGS and sales revenue are in inverse
relationship that is with increase of COGS, sales revenue will be reduced and with the
reduction COGS, the sale revenue will go up.
5PROJECT DEVELOPMENT AND OPTIMISATION
Justification of the Parameters
The sensitivity analysis of a project follows the principle of “Change the project
attributes and observe the respective behaviour” (Lin et al. 2013). There are basically four
parameters to change and observe in the project. They are as follows:
What to Vary: The project officials can change any or all the following factors like (Imai
and Yamamoto 2013):
Influence of an operation to the model objective.
The model objective (instead of maximise the profit minimize the threat of
the projects)
The total number of constraints
The total number of operations
Technical parameters.
This approach mainly deals with the variation in the worth of the mathematical
parameter in various levels. In the project some situations are also analysed like:
If the government tries to prohibit the specific technology for some
environmental issues.
If an innovative freeway was built across the two main centres.
If an innovative input having unique properties is available.
The output model is then compared with the original one and the revised model can
be utilized in the sensitivity analysis of the uncertain parameters to locate the vast
implications of the variations in the project.
What to Observe: According to the variations made in the system, particular part of the
system is analysed or observed. The observation is done on the basis of the original one and
⊘ This is a preview!⊘
Do you want full access?
Subscribe today to unlock all pages.
Trusted by 1+ million students worldwide
6PROJECT DEVELOPMENT AND OPTIMISATION
the resultant one after the variations have been made (Gramacy, Taddy and Wild 2013).
Some part of the system that are to be analysed after applying the variations are like:
The worth of the project objective method in the optimal strategy (example: strategies
that are optimal in other scenarios or a specific strategy defined by decision maker)
Variance analysis in the objective method between the two techniques (example:
between optimal strategy as well as a specific strategy proposed by decision maker)
The worth of objective method of optimal strategy.
The worth of the decision variables
The worth of constraint slacks and shadow costs in the optimisation model.
The rankings of the shadow costs and the decision variables.
Experimental Design: It is mixture of parameters that would be alternated. The modeller
should determine whether to vary all the parameters at a time keeping the other values at the
base level or to determine the combination of variations in the project (Paasch, Khalili and
Bonaventure 2013). The basic problem regarding this approach is that if two parameters are
positively correlated then they would take relatively great values and if the two parameters
are negatively correlated then one of the parameters would have low value while other will
have a greater value. In the selection process of the parameters, a usual appropriate approach
is utilized to define the rate in advance. The levels that are nominated for every parameter
should cover the range of the likely output of that item (Cortez and Embrechts 2013). For
analysing combination of variations, an effective approach is used known as “Complete
factorial” experimental design. Combination of variations includes many complex methods
like if eight parameters are to be analysed five levels require 390,625 solutions. If one
solution consumes one minute to get executed then the task would be completed in nine
months, also the volume required is vast. In this case, the number of variables is reduced to
avoid such type of complexity. The preliminary sensitive analysis is used to determine which
Paraphrase This Document
Need a fresh take? Get an instant paraphrase of this document with our AI Paraphraser
7PROJECT DEVELOPMENT AND OPTIMISATION
parameters must be included in the complete factorial experimental design (Moazen,
Costantini and Bruner 2013).
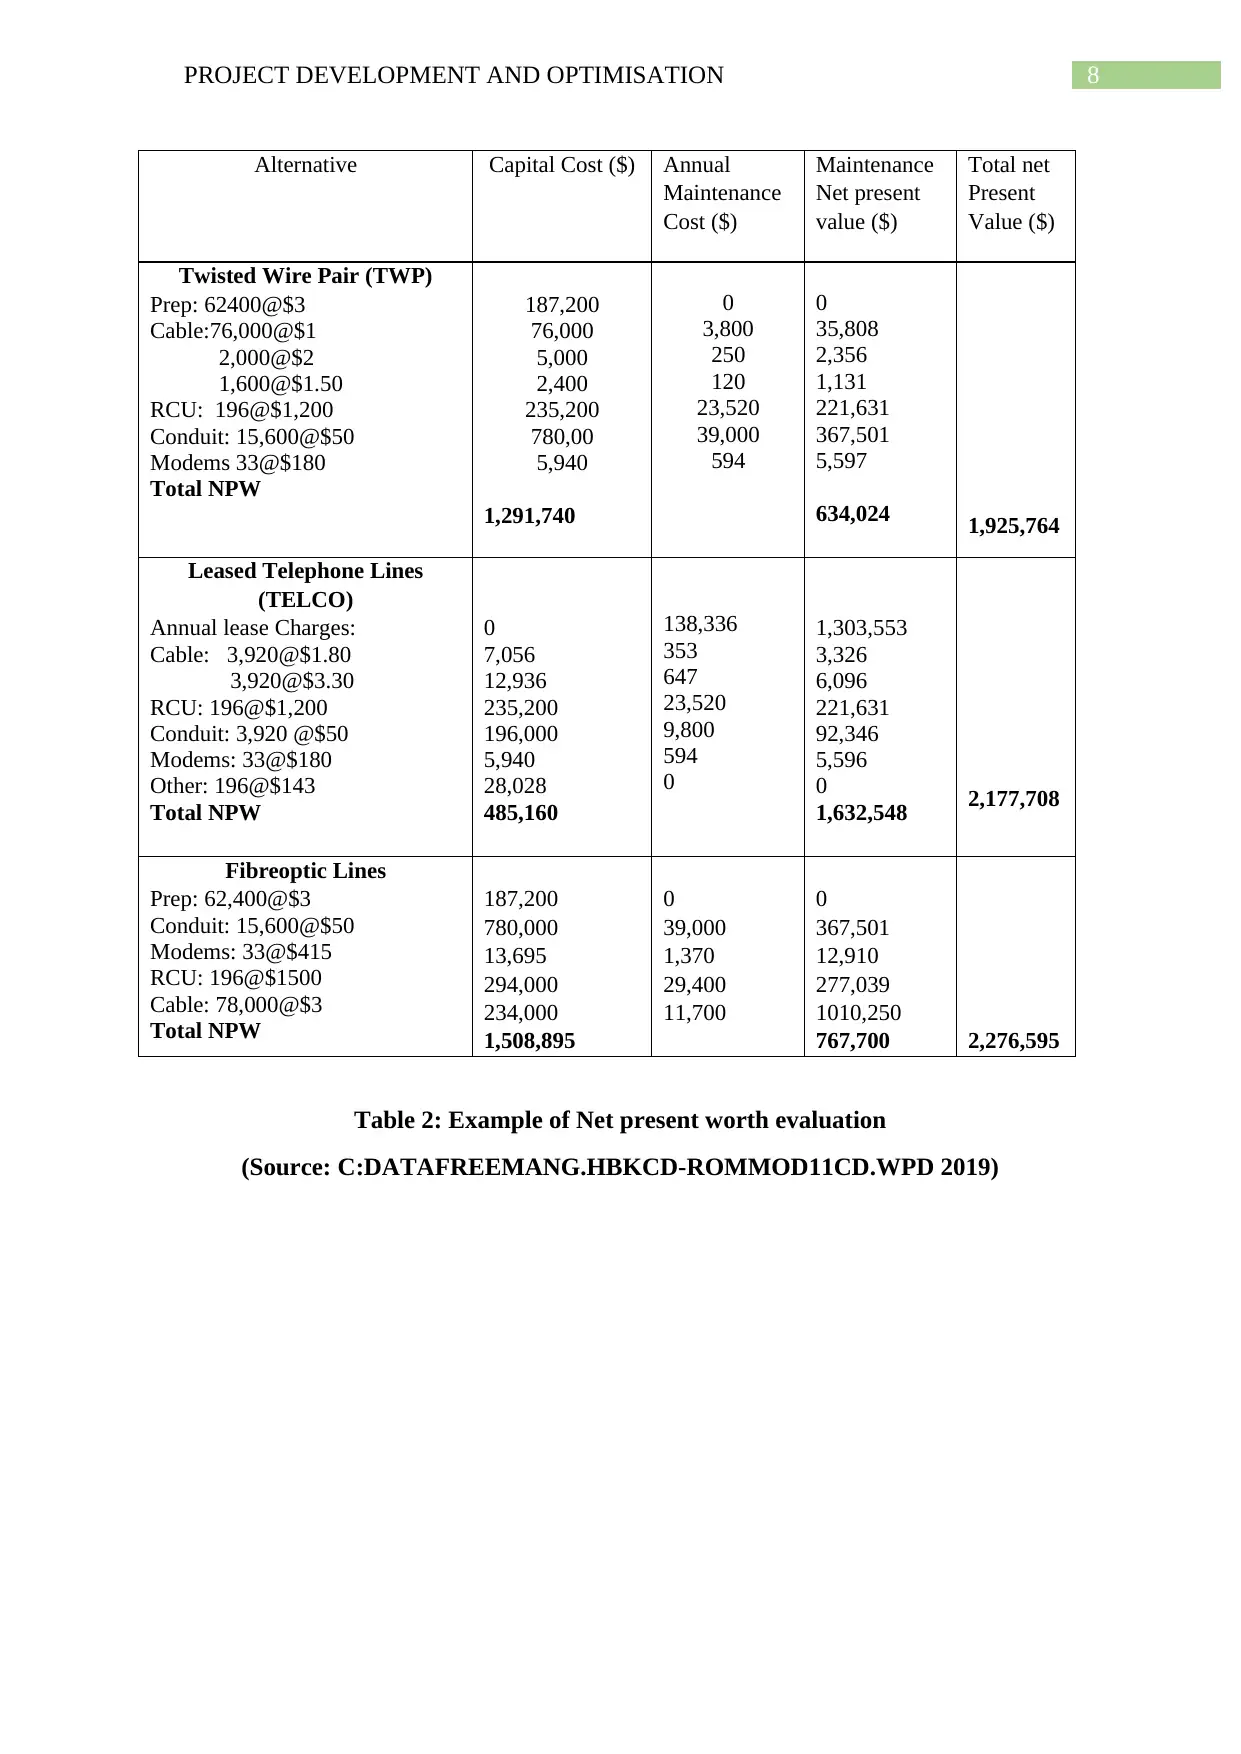
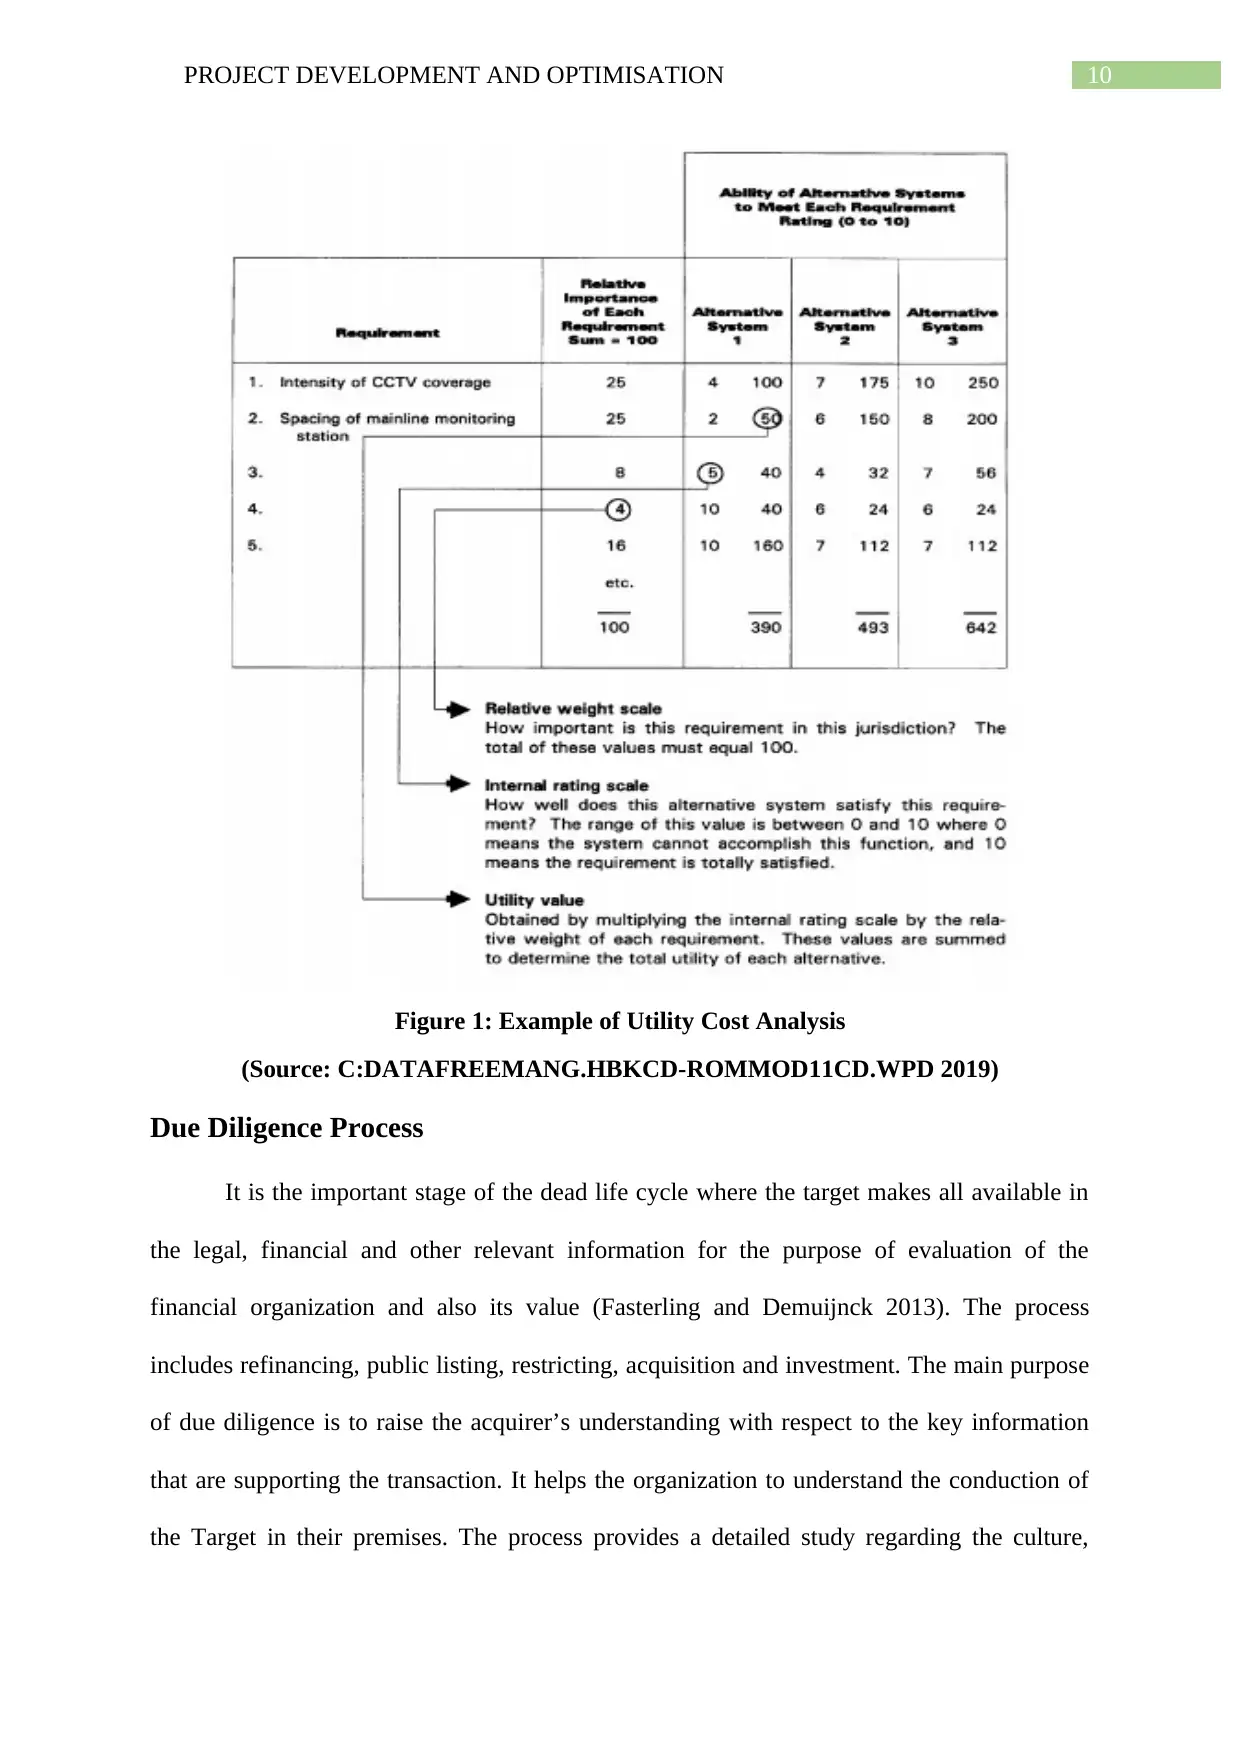
Different Scenario based on the economic analysis
Economic analysis is basically carried out to prove that the investment done of the
company is used or utilized prudently. The economic analysis mainly focuses on the cost
effectiveness of the system. It represents the benefits of the new or innovated system over the
existing one. Basically, the benefit analysis for the project focuses on reducing the cost of the
projects (Bauer 2013). Reductions can be done with respect to capital costs, continuing costs,
designing costs, utilities costs, leasing costs and equipment replacement cost and
maintenance cost of the equipment. There are various techniques in the economic analysis
like net present value, Benefit-Cost as well as the Incremental Benefit-Cost Study, Utility
Cost analysis, Value engineering (Krutilla and Eckstein 2013.). The examples are stated
below:
parameters must be included in the complete factorial experimental design (Moazen,
Costantini and Bruner 2013).
Different Scenario based on the economic analysis
Economic analysis is basically carried out to prove that the investment done of the
company is used or utilized prudently. The economic analysis mainly focuses on the cost
effectiveness of the system. It represents the benefits of the new or innovated system over the
existing one. Basically, the benefit analysis for the project focuses on reducing the cost of the
projects (Bauer 2013). Reductions can be done with respect to capital costs, continuing costs,
designing costs, utilities costs, leasing costs and equipment replacement cost and
maintenance cost of the equipment. There are various techniques in the economic analysis
like net present value, Benefit-Cost as well as the Incremental Benefit-Cost Study, Utility
Cost analysis, Value engineering (Krutilla and Eckstein 2013.). The examples are stated
below:
8PROJECT DEVELOPMENT AND OPTIMISATION
Alternative Capital Cost ($) Annual
Maintenance
Cost ($)
Maintenance
Net present
value ($)
Total net
Present
Value ($)
Twisted Wire Pair (TWP)
Prep: 62400@$3
Cable:76,000@$1
2,000@$2
1,600@$1.50
RCU: 196@$1,200
Conduit: 15,600@$50
Modems 33@$180
Total NPW
187,200
76,000
5,000
2,400
235,200
780,00
5,940
1,291,740
0
3,800
250
120
23,520
39,000
594
0
35,808
2,356
1,131
221,631
367,501
5,597
634,024 1,925,764
Leased Telephone Lines
(TELCO)
Annual lease Charges:
Cable: 3,920@$1.80
3,920@$3.30
RCU: 196@$1,200
Conduit: 3,920 @$50
Modems: 33@$180
Other: 196@$143
Total NPW
0
7,056
12,936
235,200
196,000
5,940
28,028
485,160
138,336
353
647
23,520
9,800
594
0
1,303,553
3,326
6,096
221,631
92,346
5,596
0
1,632,548 2,177,708
Fibreoptic Lines
Prep: 62,400@$3
Conduit: 15,600@$50
Modems: 33@$415
RCU: 196@$1500
Cable: 78,000@$3
Total NPW
187,200
780,000
13,695
294,000
234,000
1,508,895
0
39,000
1,370
29,400
11,700
0
367,501
12,910
277,039
1010,250
767,700 2,276,595
Table 2: Example of Net present worth evaluation
(Source: C:DATAFREEMANG.HBKCD-ROMMOD11CD.WPD 2019)
⊘ This is a preview!⊘
Do you want full access?
Subscribe today to unlock all pages.
Trusted by 1+ million students worldwide
9PROJECT DEVELOPMENT AND OPTIMISATION
Benefits and Costs (in million dollars)
LRT HWY TDM TSM HOV
Benefits
User
External
Emissions
Revenues
TOTAL
20.6
5.7
1.9
2.5
30.7
22.5
-21.0
-0.9
0.0
0.6
-16.6
33.1
5.0
33.1
44.2
21.8
2.0
0.6
0.0
24.4
24.1
4.3
2.3
0.0
30.6
Costs 48.1 4.7 14.7 5.9 8.0
B/C ratio 0.64 0.12 3.01 4.14 3.45
Table 3: Example of benefit cost analysis
(Source: C:DATAFREEMANG.HBKCD-ROMMOD11CD.WPD 2019)
Paraphrase This Document
Need a fresh take? Get an instant paraphrase of this document with our AI Paraphraser
10PROJECT DEVELOPMENT AND OPTIMISATION
Figure 1: Example of Utility Cost Analysis
(Source: C:DATAFREEMANG.HBKCD-ROMMOD11CD.WPD 2019)
Due Diligence Process
It is the important stage of the dead life cycle where the target makes all available in
the legal, financial and other relevant information for the purpose of evaluation of the
financial organization and also its value (Fasterling and Demuijnck 2013). The process
includes refinancing, public listing, restricting, acquisition and investment. The main purpose
of due diligence is to raise the acquirer’s understanding with respect to the key information
that are supporting the transaction. It helps the organization to understand the conduction of
the Target in their premises. The process provides a detailed study regarding the culture,
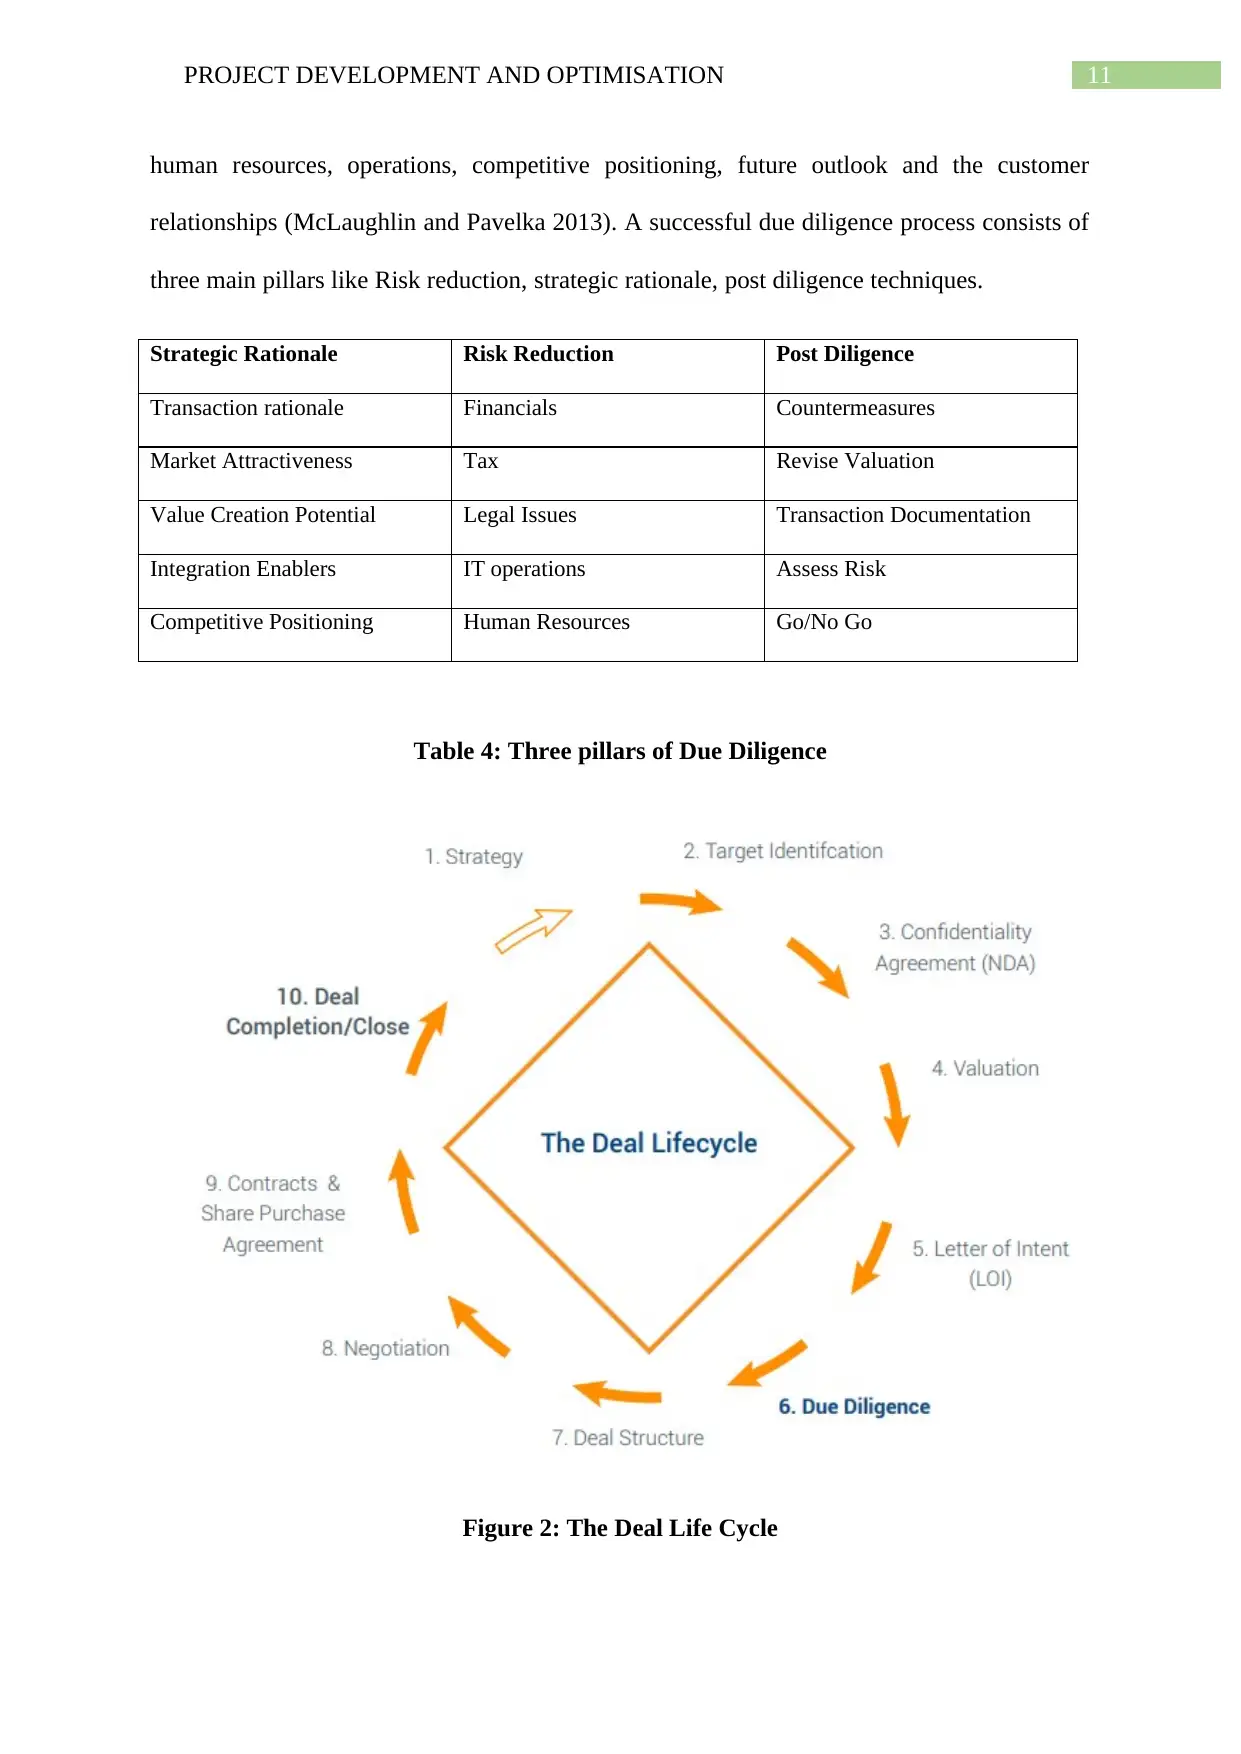
11PROJECT DEVELOPMENT AND OPTIMISATION
human resources, operations, competitive positioning, future outlook and the customer
relationships (McLaughlin and Pavelka 2013). A successful due diligence process consists of
three main pillars like Risk reduction, strategic rationale, post diligence techniques.
Strategic Rationale Risk Reduction Post Diligence
Transaction rationale Financials Countermeasures
Market Attractiveness Tax Revise Valuation
Value Creation Potential Legal Issues Transaction Documentation
Integration Enablers IT operations Assess Risk
Competitive Positioning Human Resources Go/No Go
Table 4: Three pillars of Due Diligence
Figure 2: The Deal Life Cycle
⊘ This is a preview!⊘
Do you want full access?
Subscribe today to unlock all pages.
Trusted by 1+ million students worldwide
1 out of 17
Related Documents


Your All-in-One AI-Powered Toolkit for Academic Success.
+13062052269
info@desklib.com
Available 24*7 on WhatsApp / Email
![[object Object]](/_next/static/media/star-bottom.7253800d.svg)
Unlock your academic potential
Copyright © 2020–2026 A2Z Services. All Rights Reserved. Developed and managed by ZUCOL.