Analyzing Investment Decisions and Financial Health via Ratio Analysis
VerifiedAdded on 2023/06/10
|10
|2559
|249
Case Study
AI Summary
This case study solution focuses on business finance, specifically investment appraisal and ratio analysis. The investment appraisal section evaluates a project's suitability using the payback period, net present value (NPV), and internal rate of return (IRR) methods, advising Jessica Ltd. on its investment decision. The financial ratio analysis calculates and interprets key ratios such as current ratio, quick ratio, debt-equity ratio, interest coverage ratio, stock turnover ratio, debtors turnover ratio, creditors turnover ratio, and net profit ratio for Omega Ltd., providing insights into the company's liquidity, solvency, efficiency, and profitability. Additionally, the study identifies and explains non-financial performance indicators like customer conversion rate, retention rate, customer satisfaction index, internal process efficiency, salary competitiveness ratio, and employee productivity rate. Finally, it evaluates the impact of Netflix's value-based pricing strategy on its brand value and profit margin. Desklib provides access to similar solved assignments and study tools for students.

Business Finance
Paraphrase This Document
Need a fresh take? Get an instant paraphrase of this document with our AI Paraphraser
Table of Contents
MAIN BODY..................................................................................................................................3
2: A Case Study (a)..........................................................................................................................3
The Payback Period...........................................................................................................3
The Net Present Value.......................................................................................................3
The Internal Rate of Return...............................................................................................4
Advising on the suitability of the project....................................................................................4
(b).....................................................................................................................................................5
Calculating Ratios..............................................................................................................5
Identifying and Explaining the non-financial performance indicators..............................7
Evaluating the Impact of Pricing Strategy on the Performance of Netflix........................8
REFERENCES................................................................................................................................1
MAIN BODY
2: A Case Study (a)
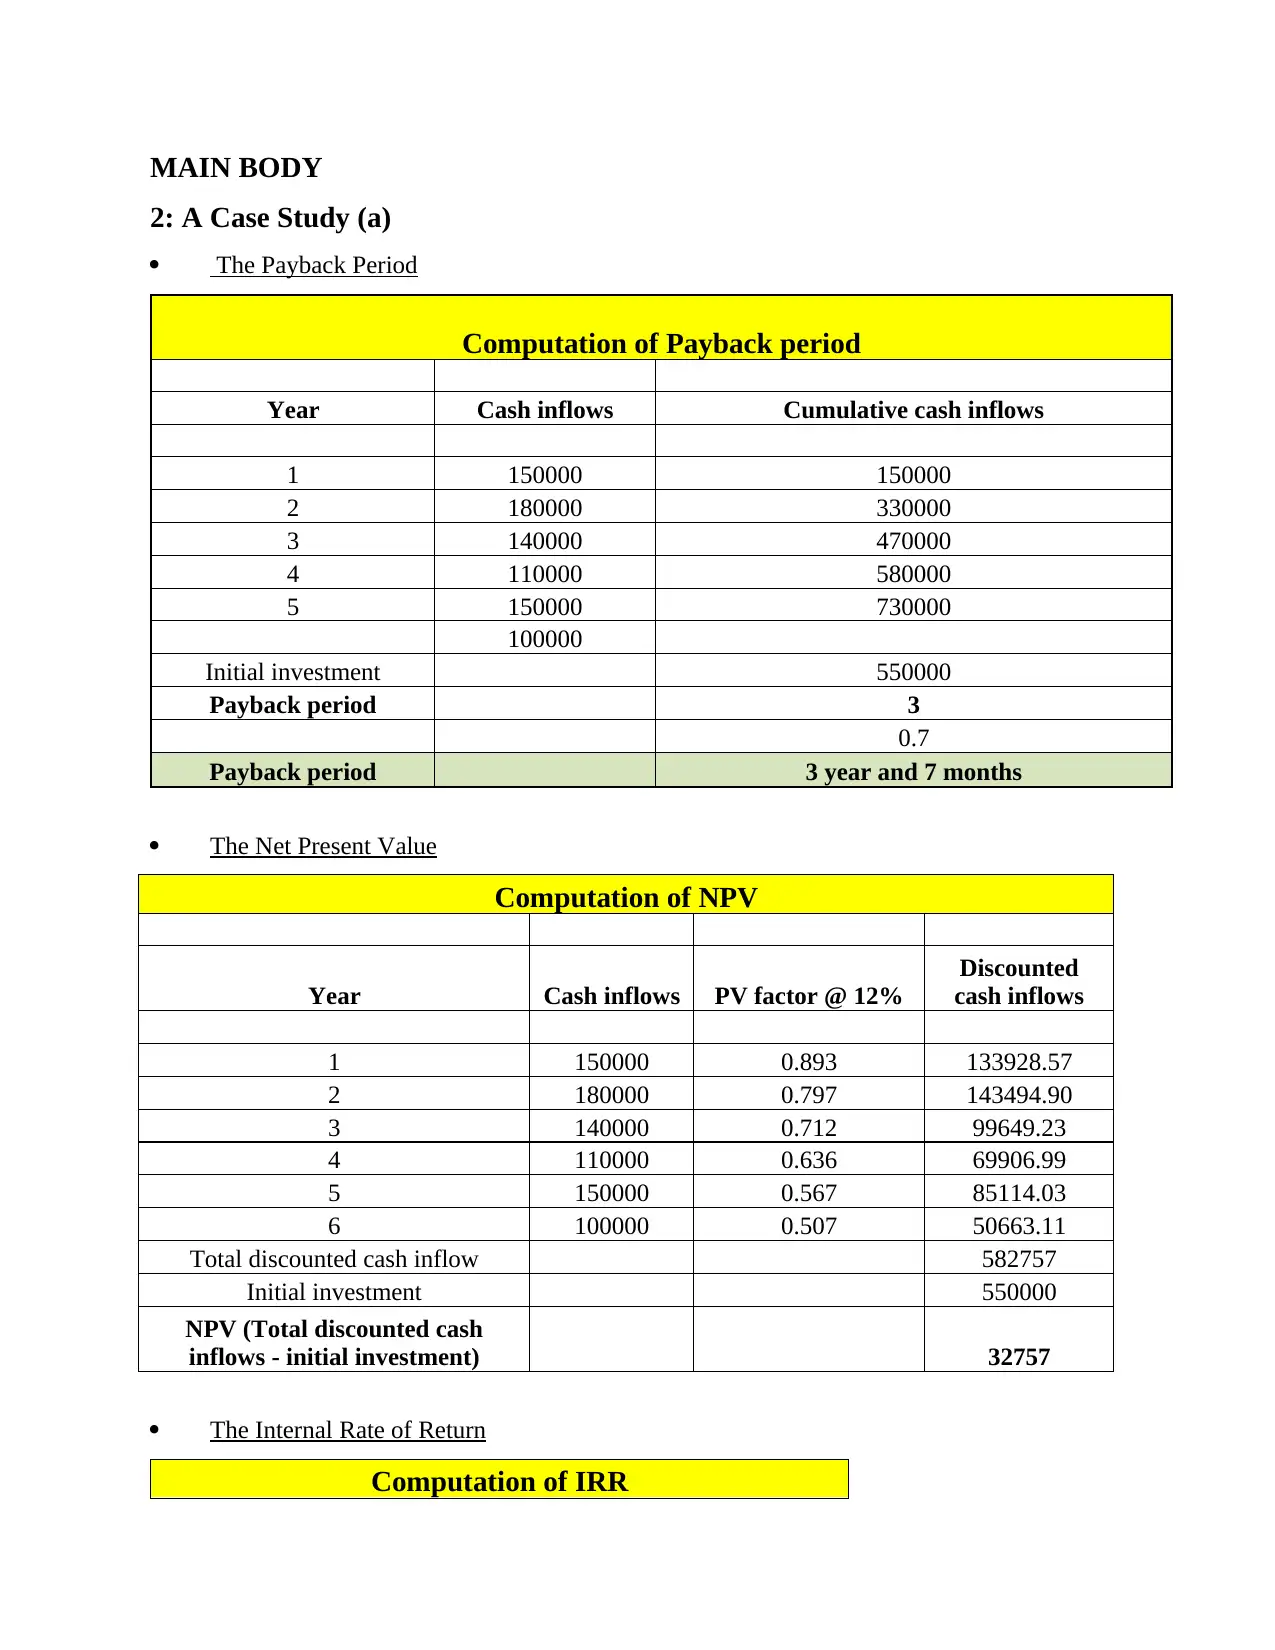
The Payback Period
Computation of Payback period
Year Cash inflows Cumulative cash inflows
1 150000 150000
2 180000 330000
3 140000 470000
4 110000 580000
5 150000 730000
100000
Initial investment 550000
Payback period 3
0.7
Payback period 3 year and 7 months
The Net Present Value
Computation of NPV
Year Cash inflows PV factor @ 12%
Discounted
cash inflows
1 150000 0.893 133928.57
2 180000 0.797 143494.90
3 140000 0.712 99649.23
4 110000 0.636 69906.99
5 150000 0.567 85114.03
6 100000 0.507 50663.11
Total discounted cash inflow 582757
Initial investment 550000
NPV (Total discounted cash
inflows - initial investment) 32757
The Internal Rate of Return
Computation of IRR
2: A Case Study (a)
The Payback Period
Computation of Payback period
Year Cash inflows Cumulative cash inflows
1 150000 150000
2 180000 330000
3 140000 470000
4 110000 580000
5 150000 730000
100000
Initial investment 550000
Payback period 3
0.7
Payback period 3 year and 7 months
The Net Present Value
Computation of NPV
Year Cash inflows PV factor @ 12%
Discounted
cash inflows
1 150000 0.893 133928.57
2 180000 0.797 143494.90
3 140000 0.712 99649.23
4 110000 0.636 69906.99
5 150000 0.567 85114.03
6 100000 0.507 50663.11
Total discounted cash inflow 582757
Initial investment 550000
NPV (Total discounted cash
inflows - initial investment) 32757
The Internal Rate of Return
Computation of IRR
⊘ This is a preview!⊘
Do you want full access?
Subscribe today to unlock all pages.
Trusted by 1+ million students worldwide
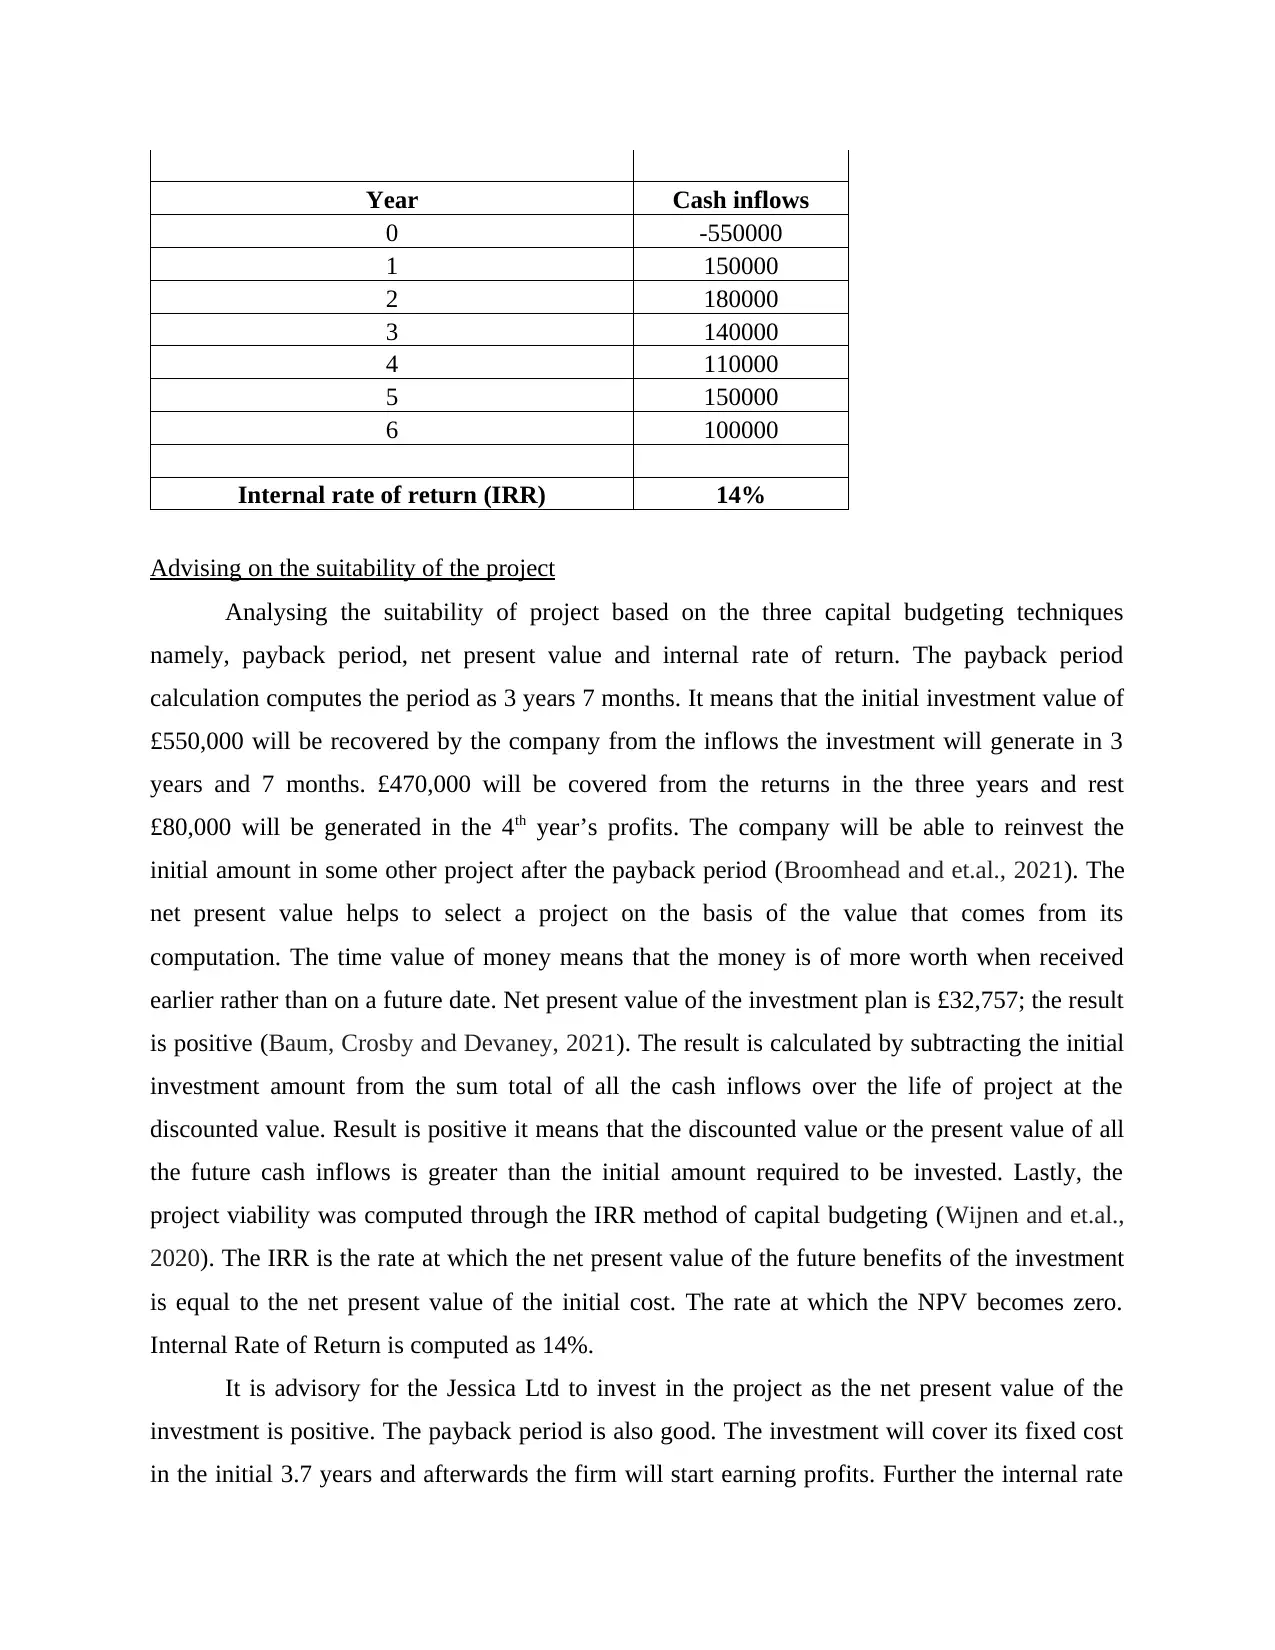
Year Cash inflows
0 -550000
1 150000
2 180000
3 140000
4 110000
5 150000
6 100000
Internal rate of return (IRR) 14%
Advising on the suitability of the project
Analysing the suitability of project based on the three capital budgeting techniques
namely, payback period, net present value and internal rate of return. The payback period
calculation computes the period as 3 years 7 months. It means that the initial investment value of
£550,000 will be recovered by the company from the inflows the investment will generate in 3
years and 7 months. £470,000 will be covered from the returns in the three years and rest
£80,000 will be generated in the 4th year’s profits. The company will be able to reinvest the
initial amount in some other project after the payback period (Broomhead and et.al., 2021). The
net present value helps to select a project on the basis of the value that comes from its
computation. The time value of money means that the money is of more worth when received
earlier rather than on a future date. Net present value of the investment plan is £32,757; the result
is positive (Baum, Crosby and Devaney, 2021). The result is calculated by subtracting the initial
investment amount from the sum total of all the cash inflows over the life of project at the
discounted value. Result is positive it means that the discounted value or the present value of all
the future cash inflows is greater than the initial amount required to be invested. Lastly, the
project viability was computed through the IRR method of capital budgeting (Wijnen and et.al.,
2020). The IRR is the rate at which the net present value of the future benefits of the investment
is equal to the net present value of the initial cost. The rate at which the NPV becomes zero.
Internal Rate of Return is computed as 14%.
It is advisory for the Jessica Ltd to invest in the project as the net present value of the
investment is positive. The payback period is also good. The investment will cover its fixed cost
in the initial 3.7 years and afterwards the firm will start earning profits. Further the internal rate
Paraphrase This Document
Need a fresh take? Get an instant paraphrase of this document with our AI Paraphraser
of rate is also high. Higher the IRR better it is for the company. So based on these three
investment appraisal techniques it is advantageous for the firm to undertake its investment
decision.
(b)
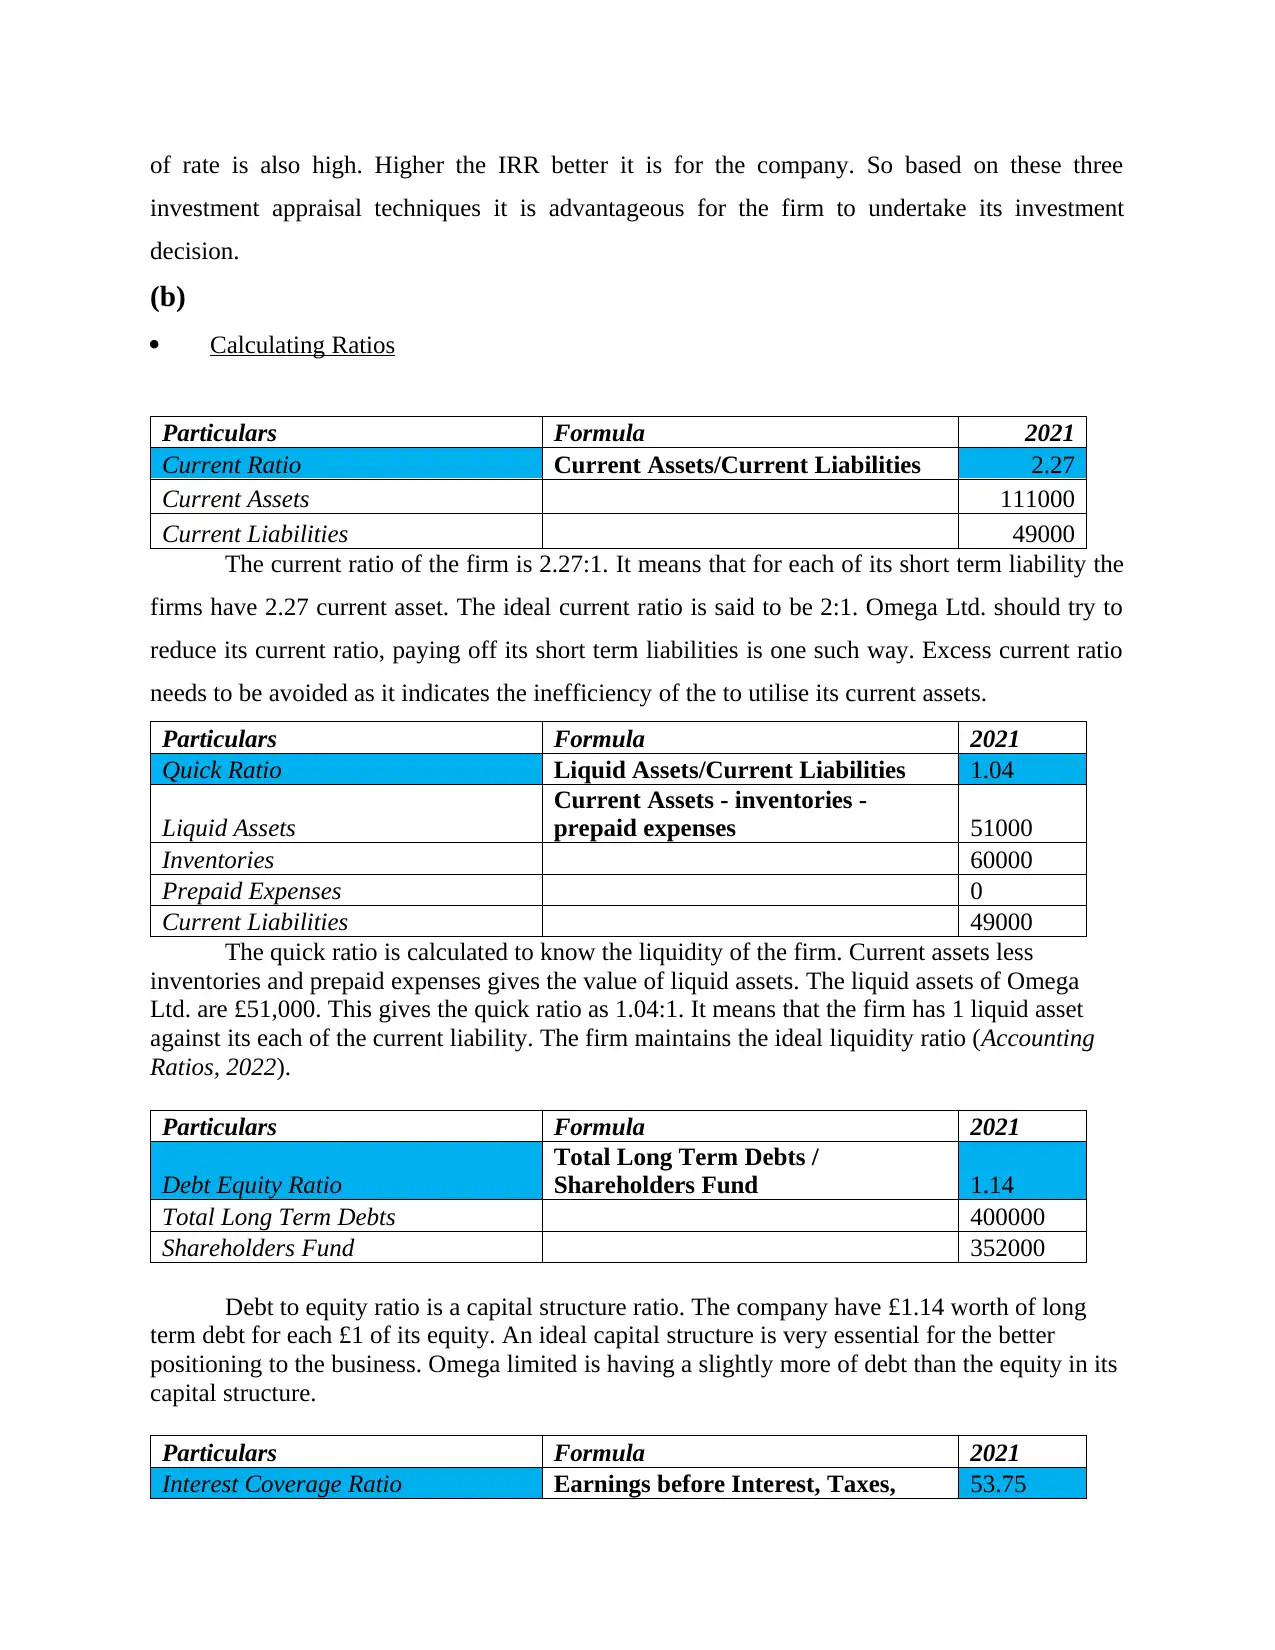
Calculating Ratios
Particulars Formula 2021
Current Ratio Current Assets/Current Liabilities 2.27
Current Assets 111000
Current Liabilities 49000
The current ratio of the firm is 2.27:1. It means that for each of its short term liability the
firms have 2.27 current asset. The ideal current ratio is said to be 2:1. Omega Ltd. should try to
reduce its current ratio, paying off its short term liabilities is one such way. Excess current ratio
needs to be avoided as it indicates the inefficiency of the to utilise its current assets.
Particulars Formula 2021
Quick Ratio Liquid Assets/Current Liabilities 1.04
Liquid Assets
Current Assets - inventories -
prepaid expenses 51000
Inventories 60000
Prepaid Expenses 0
Current Liabilities 49000
The quick ratio is calculated to know the liquidity of the firm. Current assets less
inventories and prepaid expenses gives the value of liquid assets. The liquid assets of Omega
Ltd. are £51,000. This gives the quick ratio as 1.04:1. It means that the firm has 1 liquid asset
against its each of the current liability. The firm maintains the ideal liquidity ratio (Accounting
Ratios, 2022).
Particulars Formula 2021
Debt Equity Ratio
Total Long Term Debts /
Shareholders Fund 1.14
Total Long Term Debts 400000
Shareholders Fund 352000
Debt to equity ratio is a capital structure ratio. The company have £1.14 worth of long
term debt for each £1 of its equity. An ideal capital structure is very essential for the better
positioning to the business. Omega limited is having a slightly more of debt than the equity in its
capital structure.
Particulars Formula 2021
Interest Coverage Ratio Earnings before Interest, Taxes, 53.75
investment appraisal techniques it is advantageous for the firm to undertake its investment
decision.
(b)
Calculating Ratios
Particulars Formula 2021
Current Ratio Current Assets/Current Liabilities 2.27
Current Assets 111000
Current Liabilities 49000
The current ratio of the firm is 2.27:1. It means that for each of its short term liability the
firms have 2.27 current asset. The ideal current ratio is said to be 2:1. Omega Ltd. should try to
reduce its current ratio, paying off its short term liabilities is one such way. Excess current ratio
needs to be avoided as it indicates the inefficiency of the to utilise its current assets.
Particulars Formula 2021
Quick Ratio Liquid Assets/Current Liabilities 1.04
Liquid Assets
Current Assets - inventories -
prepaid expenses 51000
Inventories 60000
Prepaid Expenses 0
Current Liabilities 49000
The quick ratio is calculated to know the liquidity of the firm. Current assets less
inventories and prepaid expenses gives the value of liquid assets. The liquid assets of Omega
Ltd. are £51,000. This gives the quick ratio as 1.04:1. It means that the firm has 1 liquid asset
against its each of the current liability. The firm maintains the ideal liquidity ratio (Accounting
Ratios, 2022).
Particulars Formula 2021
Debt Equity Ratio
Total Long Term Debts /
Shareholders Fund 1.14
Total Long Term Debts 400000
Shareholders Fund 352000
Debt to equity ratio is a capital structure ratio. The company have £1.14 worth of long
term debt for each £1 of its equity. An ideal capital structure is very essential for the better
positioning to the business. Omega limited is having a slightly more of debt than the equity in its
capital structure.
Particulars Formula 2021
Interest Coverage Ratio Earnings before Interest, Taxes, 53.75
Depreciation, and Amortization /
Interest Expense
Earnings before Interest, Taxes,
Depreciation, and Amortization
Gross Profit - Rent Expense -
Administration Expenses 215000
Interest Expense 4000
Gross Profit 300000
Rent Expense 60000
Administration Expenses 25000
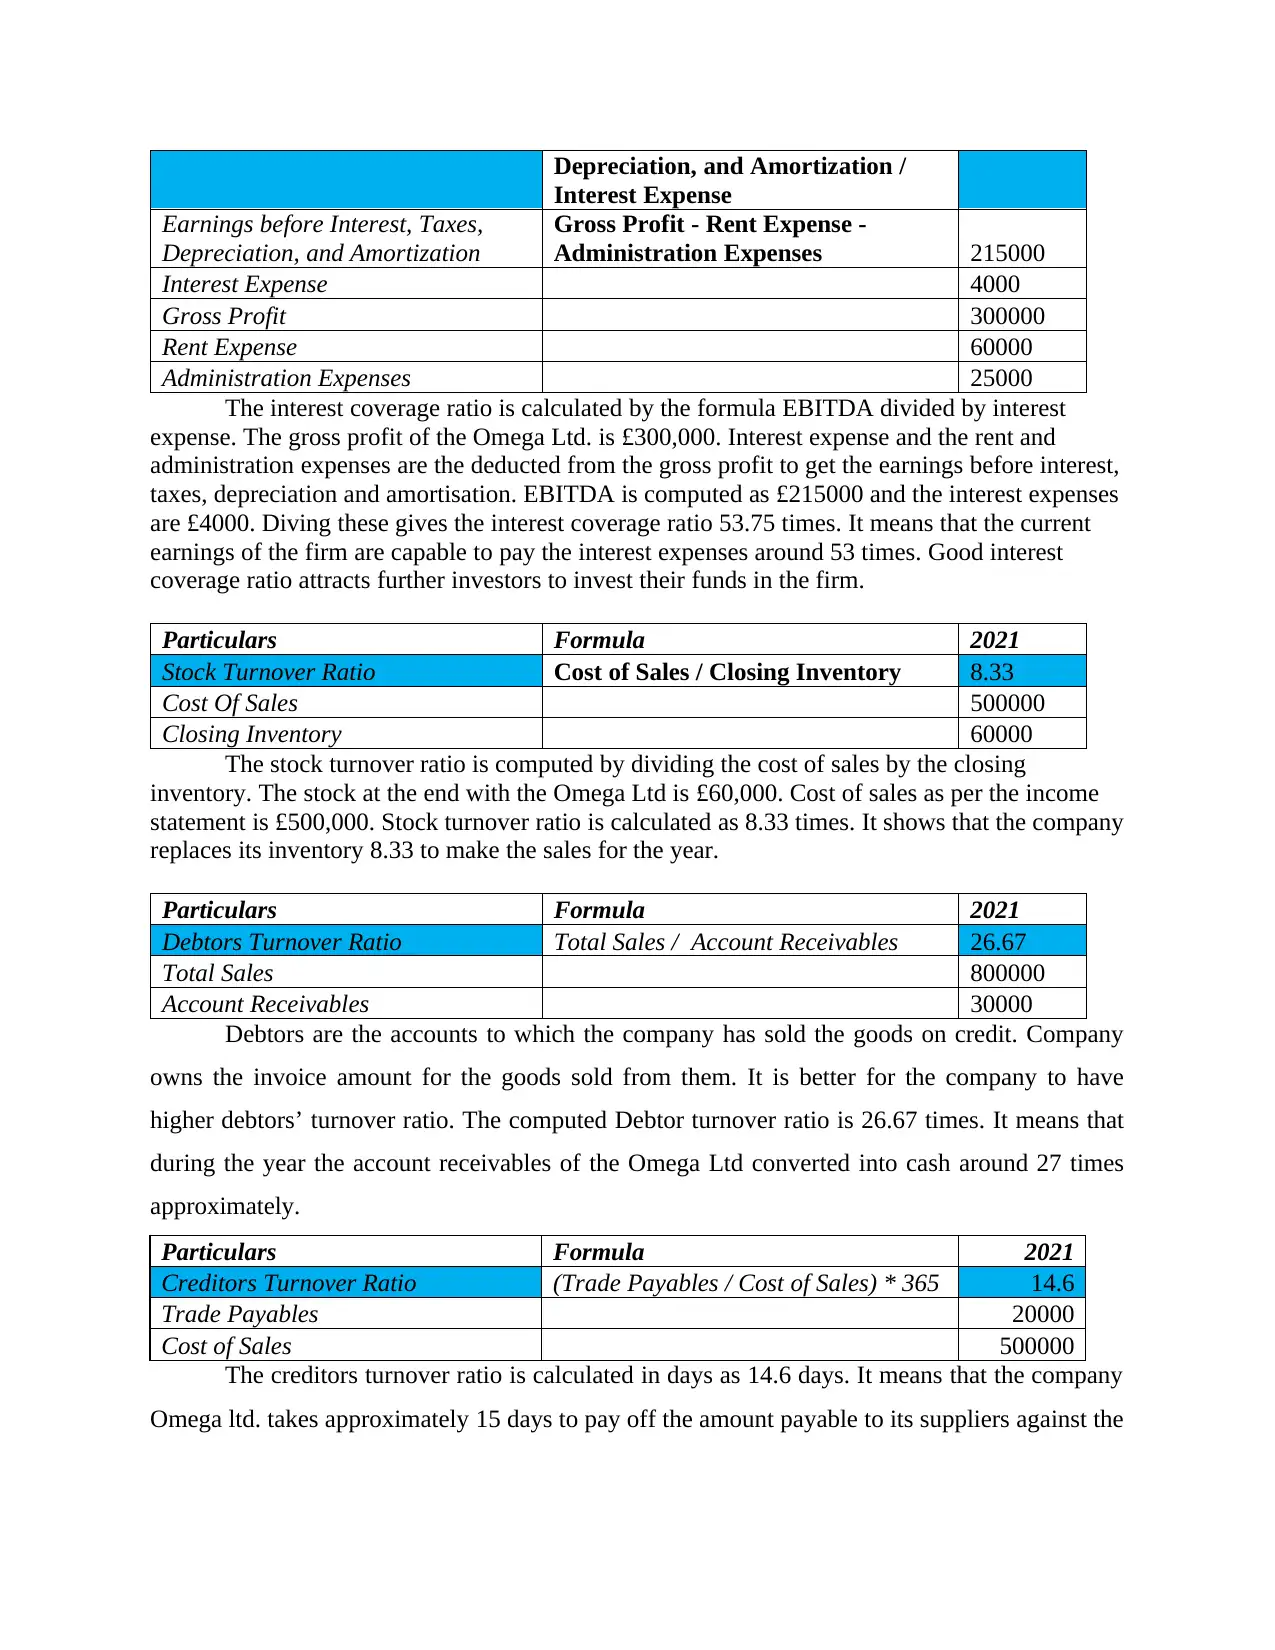
The interest coverage ratio is calculated by the formula EBITDA divided by interest
expense. The gross profit of the Omega Ltd. is £300,000. Interest expense and the rent and
administration expenses are the deducted from the gross profit to get the earnings before interest,
taxes, depreciation and amortisation. EBITDA is computed as £215000 and the interest expenses
are £4000. Diving these gives the interest coverage ratio 53.75 times. It means that the current
earnings of the firm are capable to pay the interest expenses around 53 times. Good interest
coverage ratio attracts further investors to invest their funds in the firm.
Particulars Formula 2021
Stock Turnover Ratio Cost of Sales / Closing Inventory 8.33
Cost Of Sales 500000
Closing Inventory 60000
The stock turnover ratio is computed by dividing the cost of sales by the closing
inventory. The stock at the end with the Omega Ltd is £60,000. Cost of sales as per the income
statement is £500,000. Stock turnover ratio is calculated as 8.33 times. It shows that the company
replaces its inventory 8.33 to make the sales for the year.
Particulars Formula 2021
Debtors Turnover Ratio Total Sales / Account Receivables 26.67
Total Sales 800000
Account Receivables 30000
Debtors are the accounts to which the company has sold the goods on credit. Company
owns the invoice amount for the goods sold from them. It is better for the company to have
higher debtors’ turnover ratio. The computed Debtor turnover ratio is 26.67 times. It means that
during the year the account receivables of the Omega Ltd converted into cash around 27 times
approximately.
Particulars Formula 2021
Creditors Turnover Ratio (Trade Payables / Cost of Sales) * 365 14.6
Trade Payables 20000
Cost of Sales 500000
The creditors turnover ratio is calculated in days as 14.6 days. It means that the company
Omega ltd. takes approximately 15 days to pay off the amount payable to its suppliers against the
Interest Expense
Earnings before Interest, Taxes,
Depreciation, and Amortization
Gross Profit - Rent Expense -
Administration Expenses 215000
Interest Expense 4000
Gross Profit 300000
Rent Expense 60000
Administration Expenses 25000
The interest coverage ratio is calculated by the formula EBITDA divided by interest
expense. The gross profit of the Omega Ltd. is £300,000. Interest expense and the rent and
administration expenses are the deducted from the gross profit to get the earnings before interest,
taxes, depreciation and amortisation. EBITDA is computed as £215000 and the interest expenses
are £4000. Diving these gives the interest coverage ratio 53.75 times. It means that the current
earnings of the firm are capable to pay the interest expenses around 53 times. Good interest
coverage ratio attracts further investors to invest their funds in the firm.
Particulars Formula 2021
Stock Turnover Ratio Cost of Sales / Closing Inventory 8.33
Cost Of Sales 500000
Closing Inventory 60000
The stock turnover ratio is computed by dividing the cost of sales by the closing
inventory. The stock at the end with the Omega Ltd is £60,000. Cost of sales as per the income
statement is £500,000. Stock turnover ratio is calculated as 8.33 times. It shows that the company
replaces its inventory 8.33 to make the sales for the year.
Particulars Formula 2021
Debtors Turnover Ratio Total Sales / Account Receivables 26.67
Total Sales 800000
Account Receivables 30000
Debtors are the accounts to which the company has sold the goods on credit. Company
owns the invoice amount for the goods sold from them. It is better for the company to have
higher debtors’ turnover ratio. The computed Debtor turnover ratio is 26.67 times. It means that
during the year the account receivables of the Omega Ltd converted into cash around 27 times
approximately.
Particulars Formula 2021
Creditors Turnover Ratio (Trade Payables / Cost of Sales) * 365 14.6
Trade Payables 20000
Cost of Sales 500000
The creditors turnover ratio is calculated in days as 14.6 days. It means that the company
Omega ltd. takes approximately 15 days to pay off the amount payable to its suppliers against the
⊘ This is a preview!⊘
Do you want full access?
Subscribe today to unlock all pages.
Trusted by 1+ million students worldwide
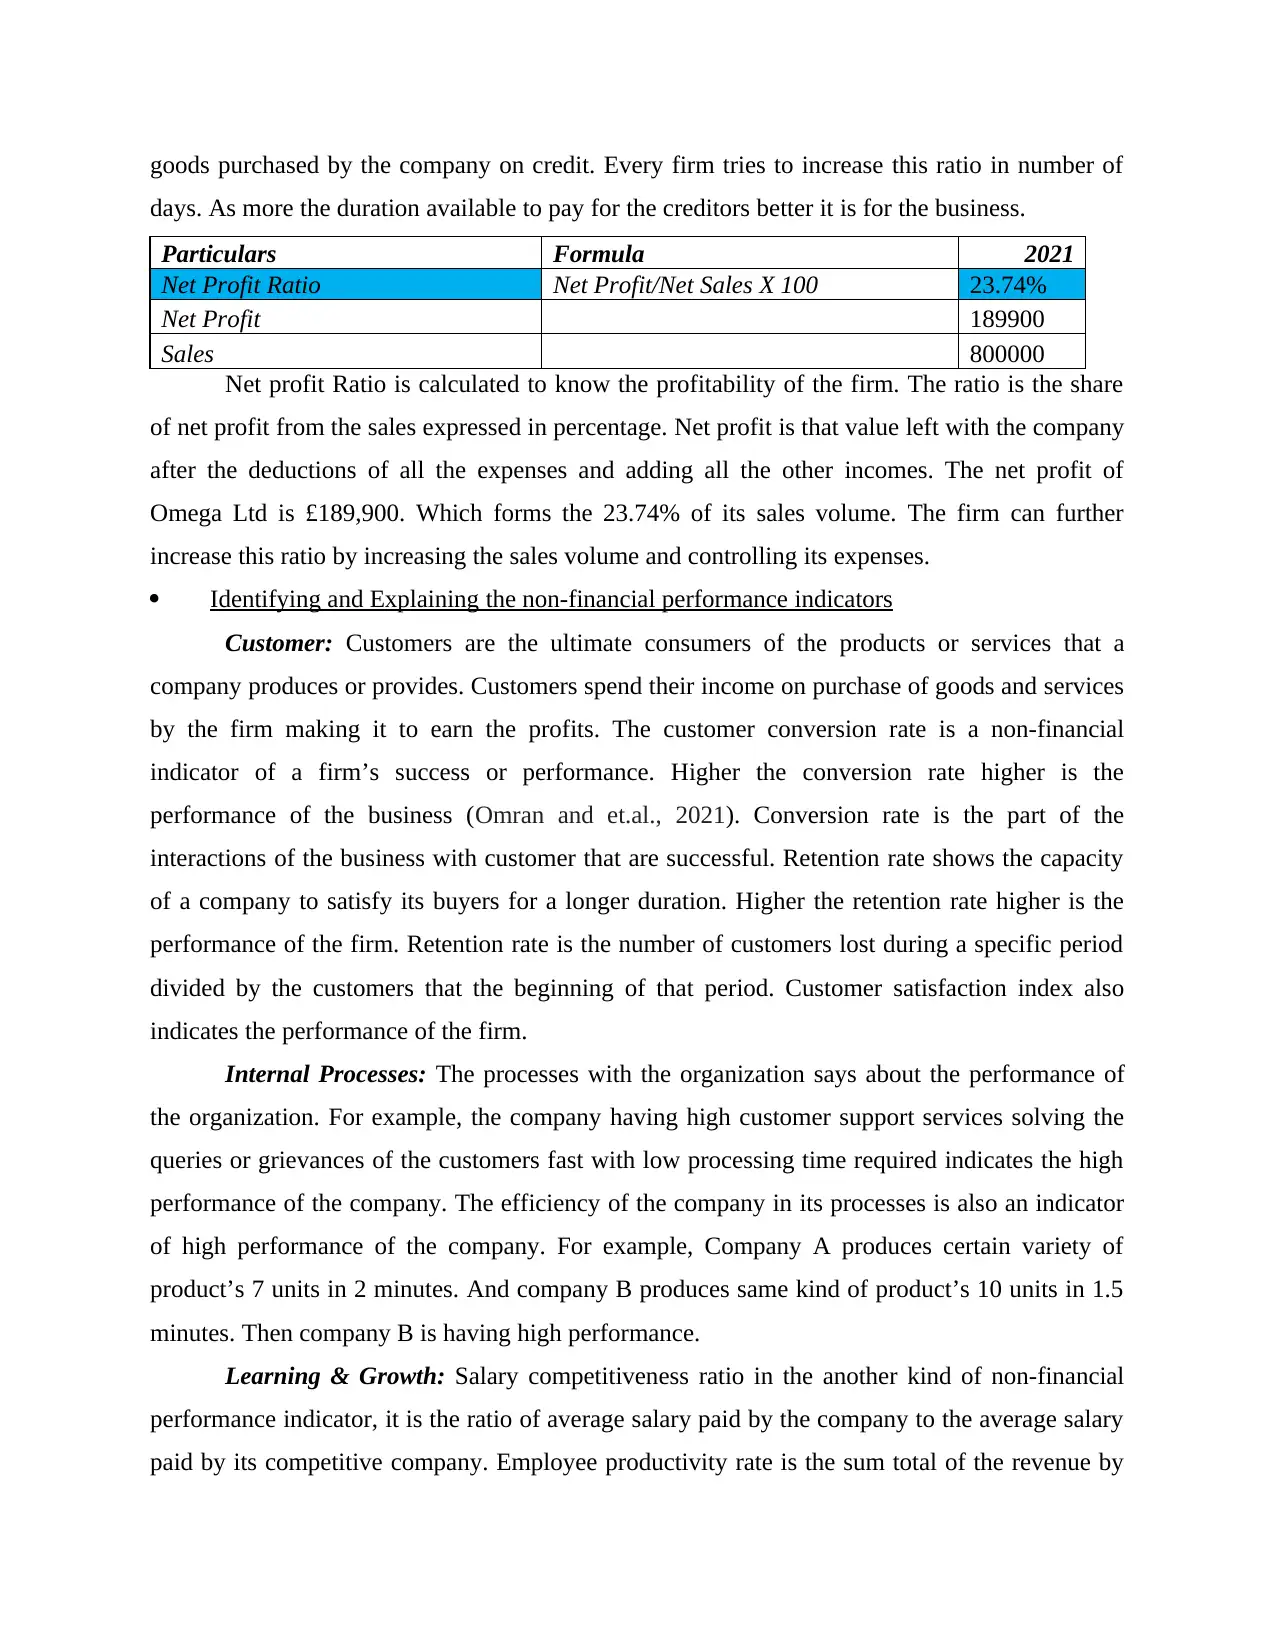
goods purchased by the company on credit. Every firm tries to increase this ratio in number of
days. As more the duration available to pay for the creditors better it is for the business.
Particulars Formula 2021
Net Profit Ratio Net Profit/Net Sales X 100 23.74%
Net Profit 189900
Sales 800000
Net profit Ratio is calculated to know the profitability of the firm. The ratio is the share
of net profit from the sales expressed in percentage. Net profit is that value left with the company
after the deductions of all the expenses and adding all the other incomes. The net profit of
Omega Ltd is £189,900. Which forms the 23.74% of its sales volume. The firm can further
increase this ratio by increasing the sales volume and controlling its expenses.
Identifying and Explaining the non-financial performance indicators
Customer: Customers are the ultimate consumers of the products or services that a
company produces or provides. Customers spend their income on purchase of goods and services
by the firm making it to earn the profits. The customer conversion rate is a non-financial
indicator of a firm’s success or performance. Higher the conversion rate higher is the
performance of the business (Omran and et.al., 2021). Conversion rate is the part of the
interactions of the business with customer that are successful. Retention rate shows the capacity
of a company to satisfy its buyers for a longer duration. Higher the retention rate higher is the
performance of the firm. Retention rate is the number of customers lost during a specific period
divided by the customers that the beginning of that period. Customer satisfaction index also
indicates the performance of the firm.
Internal Processes: The processes with the organization says about the performance of
the organization. For example, the company having high customer support services solving the
queries or grievances of the customers fast with low processing time required indicates the high
performance of the company. The efficiency of the company in its processes is also an indicator
of high performance of the company. For example, Company A produces certain variety of
product’s 7 units in 2 minutes. And company B produces same kind of product’s 10 units in 1.5
minutes. Then company B is having high performance.
Learning & Growth: Salary competitiveness ratio in the another kind of non-financial
performance indicator, it is the ratio of average salary paid by the company to the average salary
paid by its competitive company. Employee productivity rate is the sum total of the revenue by
Paraphrase This Document
Need a fresh take? Get an instant paraphrase of this document with our AI Paraphraser
the company divided by the total number of employees (Mjongwana and Kamala, 2018). A high
value of salary competitiveness ratio and employee productivity rate indicates that the firm is a
high performing one. Turnover rate of the highest performer personnel in the company is less it
means that the company is performing well. The time taken by the company on an average to
hire new person at the place of the previous left, died, promoted or transferred employee is low
that means the performance of the company is reliable and good. These were some of the non-
financial indicators that are used or can be used to measure the performance of a firm.
Evaluating the Impact of Pricing Strategy on the Performance of Netflix
Value Based Pricing strategy is used by the Netflix. The meaning of value based pricing
strategy is that the price of the services that products offered by the company are based on the
value that is perceived by its customers. The pricing strategy is focussed on the customer and the
respective believes of the customers regarding the worth of the product. The strategy is used by
the company as the product offered by the company is highly differentiated from the products
that its competitors offers to the market (Cherla, Howard and Mossialos, 2021). Services
provided by the company are of high quality. Thus the pricing strategy is useful for the company.
The impacts of the value based pricing strategy on the company are the brand value of the
company increased largely because of its pricing strategy. Setting up of the price high instantly
increases the value of the brand. This increased brand value results in the high value
perseverance by the customers. The reason is that the high value creates the mind among the
customer that product is of higher quality. Impacting the company positively through better
brand value. Another impact of the value based pricing strategy is that the profit margin of the
company increases. It is assumed that the customers are ready to pay more for the services of the
company by the value based pricing strategy being followed. Setting up of prices higher
ultimately linked with the high customer perceived value means that the profits earnings of the
company increases imposing a positive impact. The negative impact of this pricing strategy over
the company is that by selling the products or services at the highest possible price requires the
providence of higher quality products (Kumar and Sun, 2020). Thus the production cost
increases. Another negative impact that the firm faces is the high level of increasing competition
in the industry. Thus the pricing strategy have both weaknesses and strengths.

⊘ This is a preview!⊘
Do you want full access?
Subscribe today to unlock all pages.
Trusted by 1+ million students worldwide
REFERENCES
Books and Journals
Baum, A. E., Crosby, N. and Devaney, S., 2021. Property investment appraisal. John Wiley &
Sons.
Broomhead, S. C. and et.al., 2021. EHealth Investment Appraisal in Africa: A Scoping
Review. INQUIRY: The Journal of Health Care Organization, Provision, and
Financing. 58. p.00469580211059999.
Cherla, A., Howard, N. and Mossialos, E., 2021. The ‘Netflix plus model’: can subscription
financing improve access to medicines in low-and middle-income countries?. Health
Economics, Policy and Law. 16(2). pp.113-123.
Kumar, V. and Sun, Y., 2020. Designing Pricing Strategy for Operational and Technological
Transformation. Management Science. 66(6). pp.2706-2734.
Mjongwana, A. and Kamala, P. N., 2018. Non-financial performance measurement by small and
medium sized enterprises operating in the hotel industry in the city of Cape
Town. African Journal of Hospitality, Tourism and Leisure. 7(1). pp.1-26.
Omran, M. and et.al., 2021. Non-financial performance measures disclosure, quality strategy,
and organizational financial performance: a mediating model. Total Quality Management
& Business Excellence, 32(5-6), pp.652-675.
Wijnen, B. F. and et.al., 2020. Implementing interventions to reduce work-related stress among
health-care workers: An investment appraisal from the employer’s
perspective. International Archives of Occupational and Environmental Health. 93(1).
pp.123-132.
Online
Accounting Ratios. 2022. [Online]. Available through: <
https://corporatefinanceinstitute.com/resources/knowledge/accounting/accounting-
ratios/>
1
1 out of 10
Related Documents


Your All-in-One AI-Powered Toolkit for Academic Success.
+13062052269
info@desklib.com
Available 24*7 on WhatsApp / Email
![[object Object]](/_next/static/media/star-bottom.7253800d.svg)
Unlock your academic potential
Copyright © 2020–2026 A2Z Services. All Rights Reserved. Developed and managed by ZUCOL.