Financial Analysis Report: Project Funding Options and Valuation

Verified

Added on  2023/01/19

|15
|882
|99
Report
AI Summary
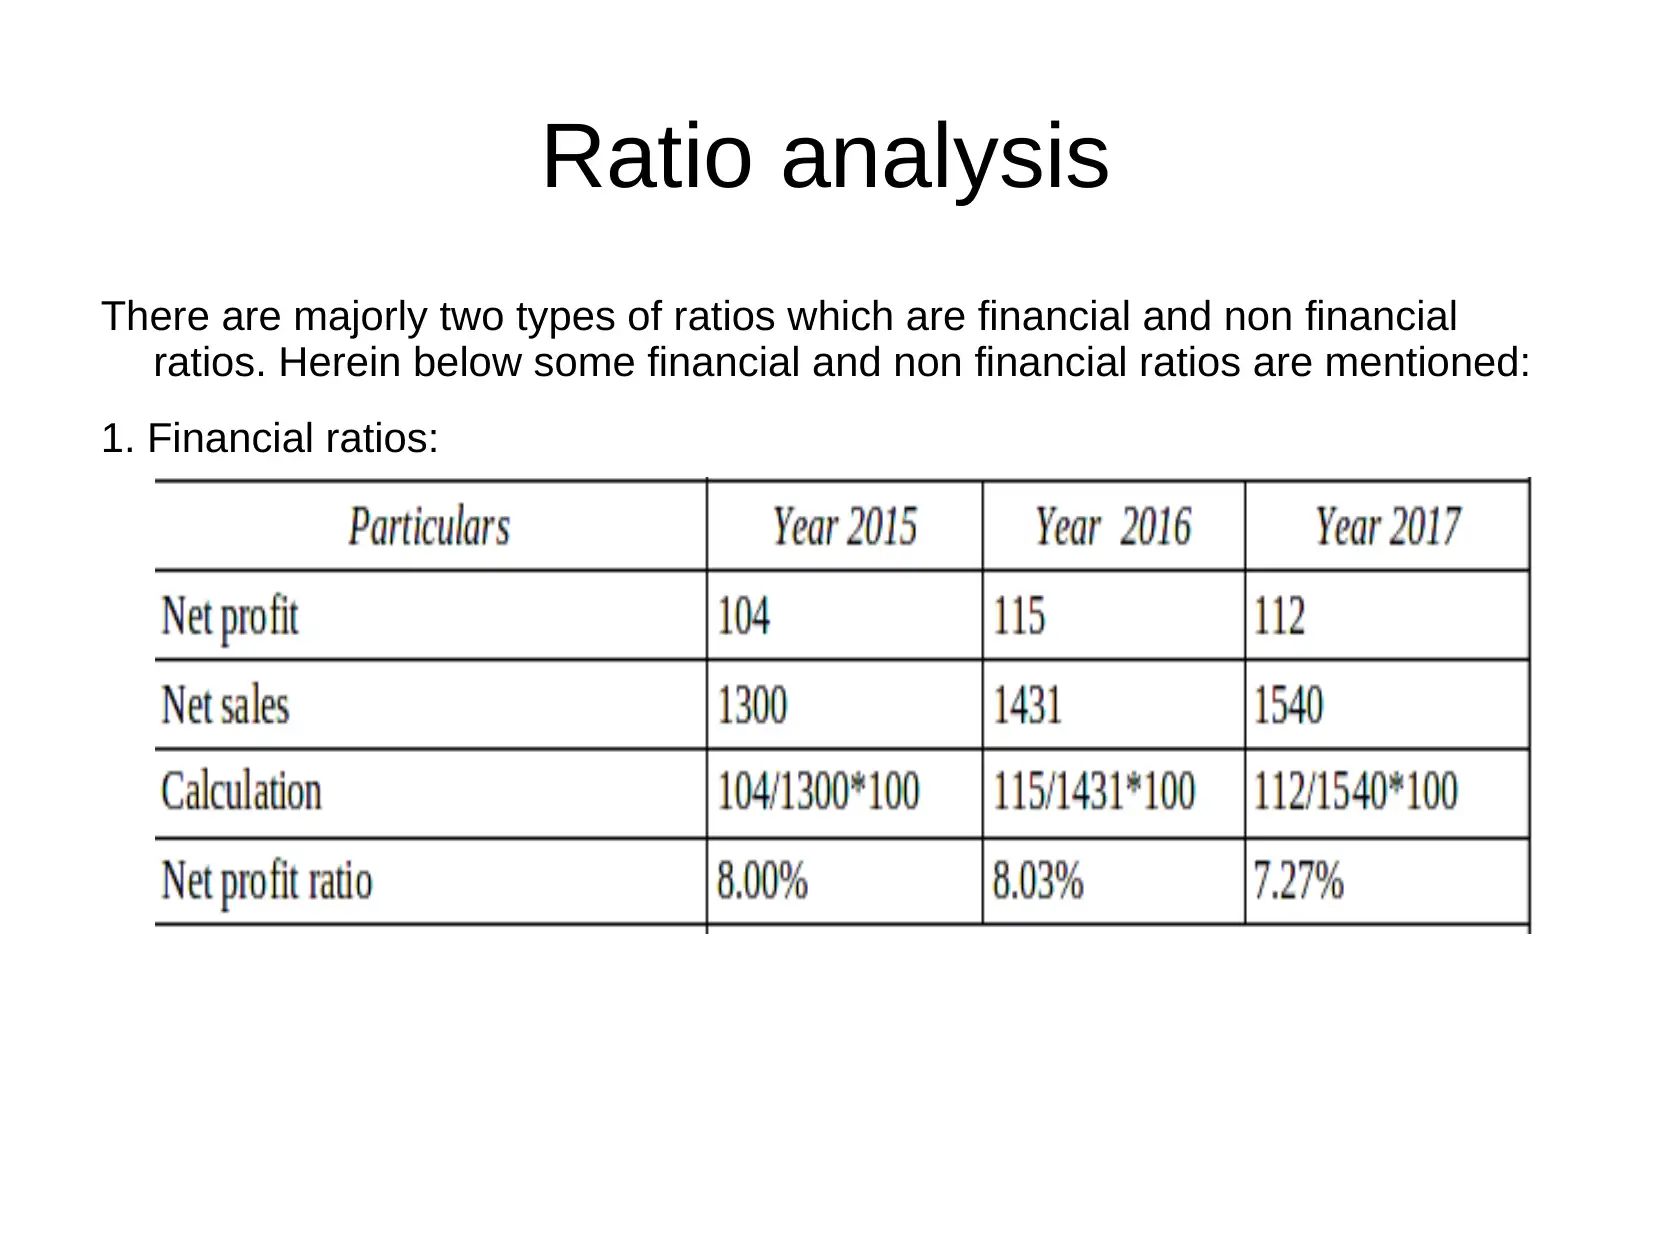
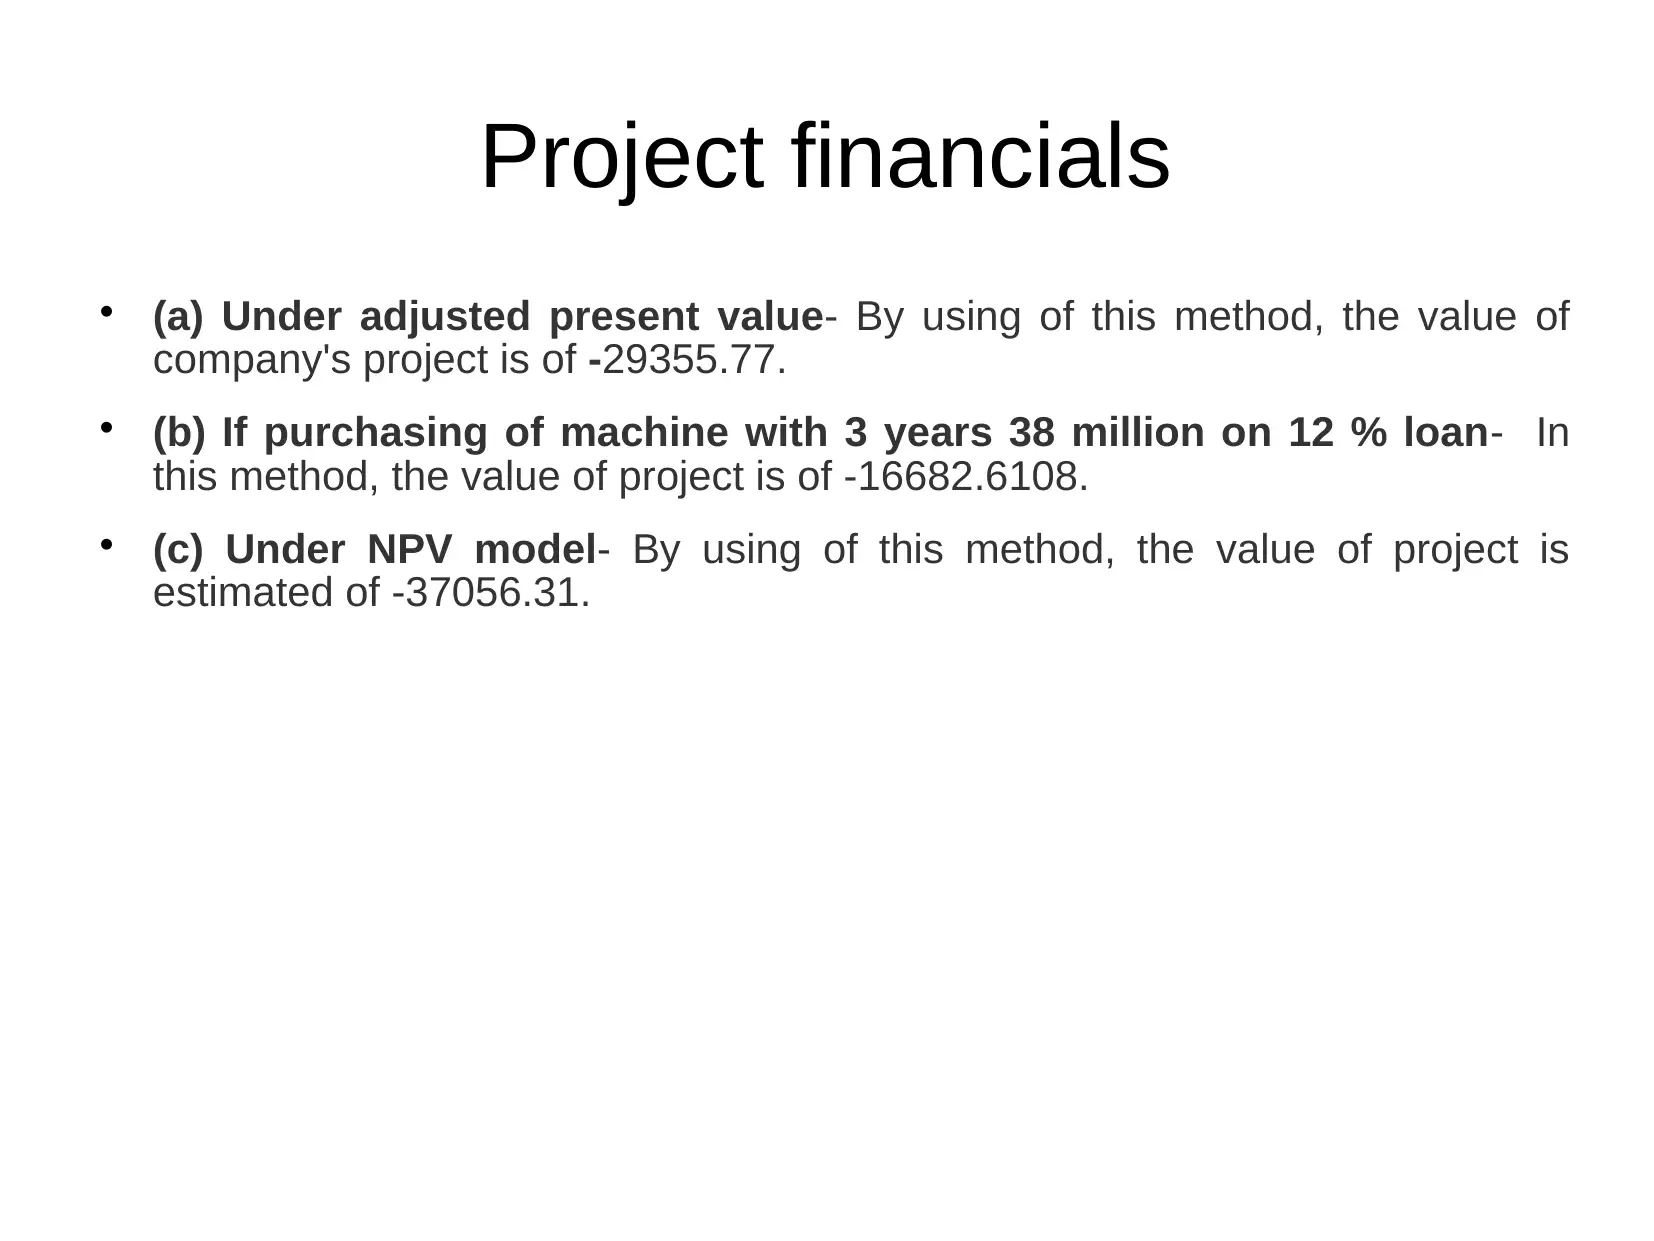
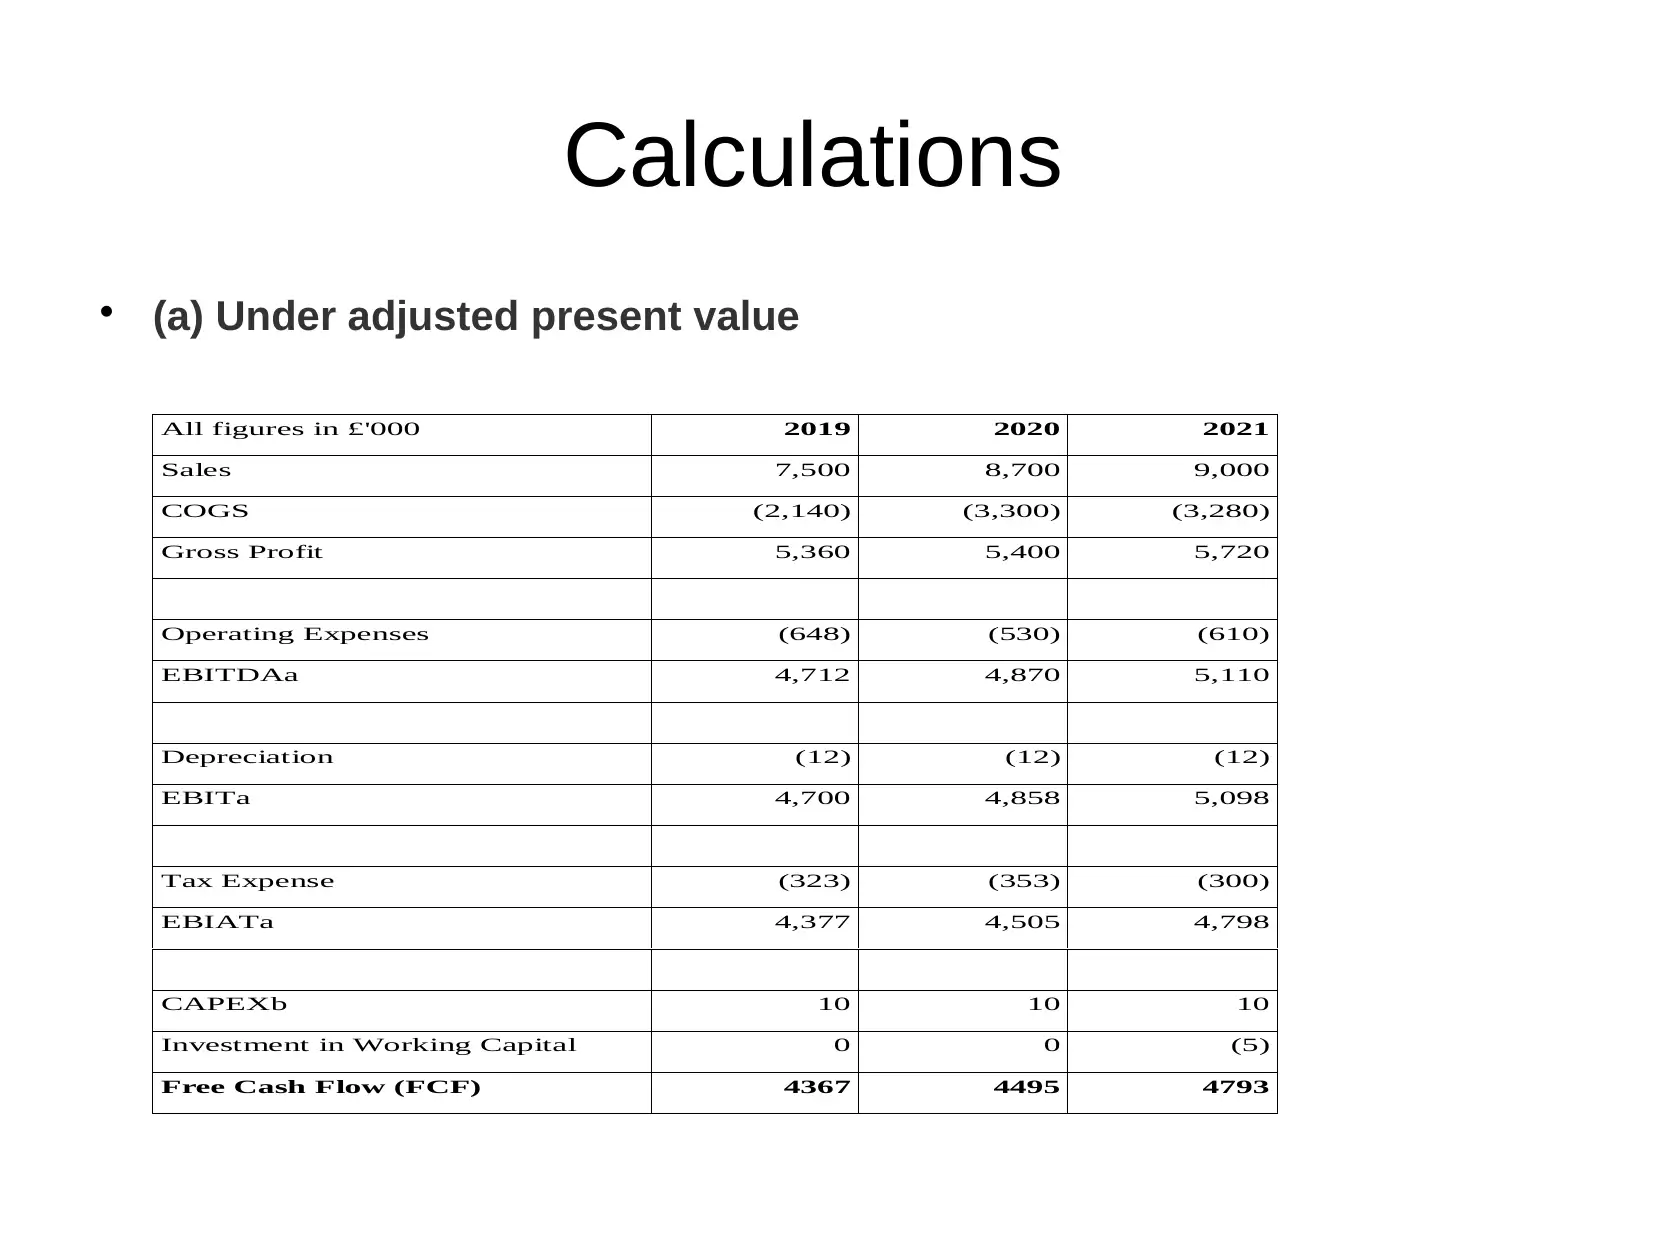
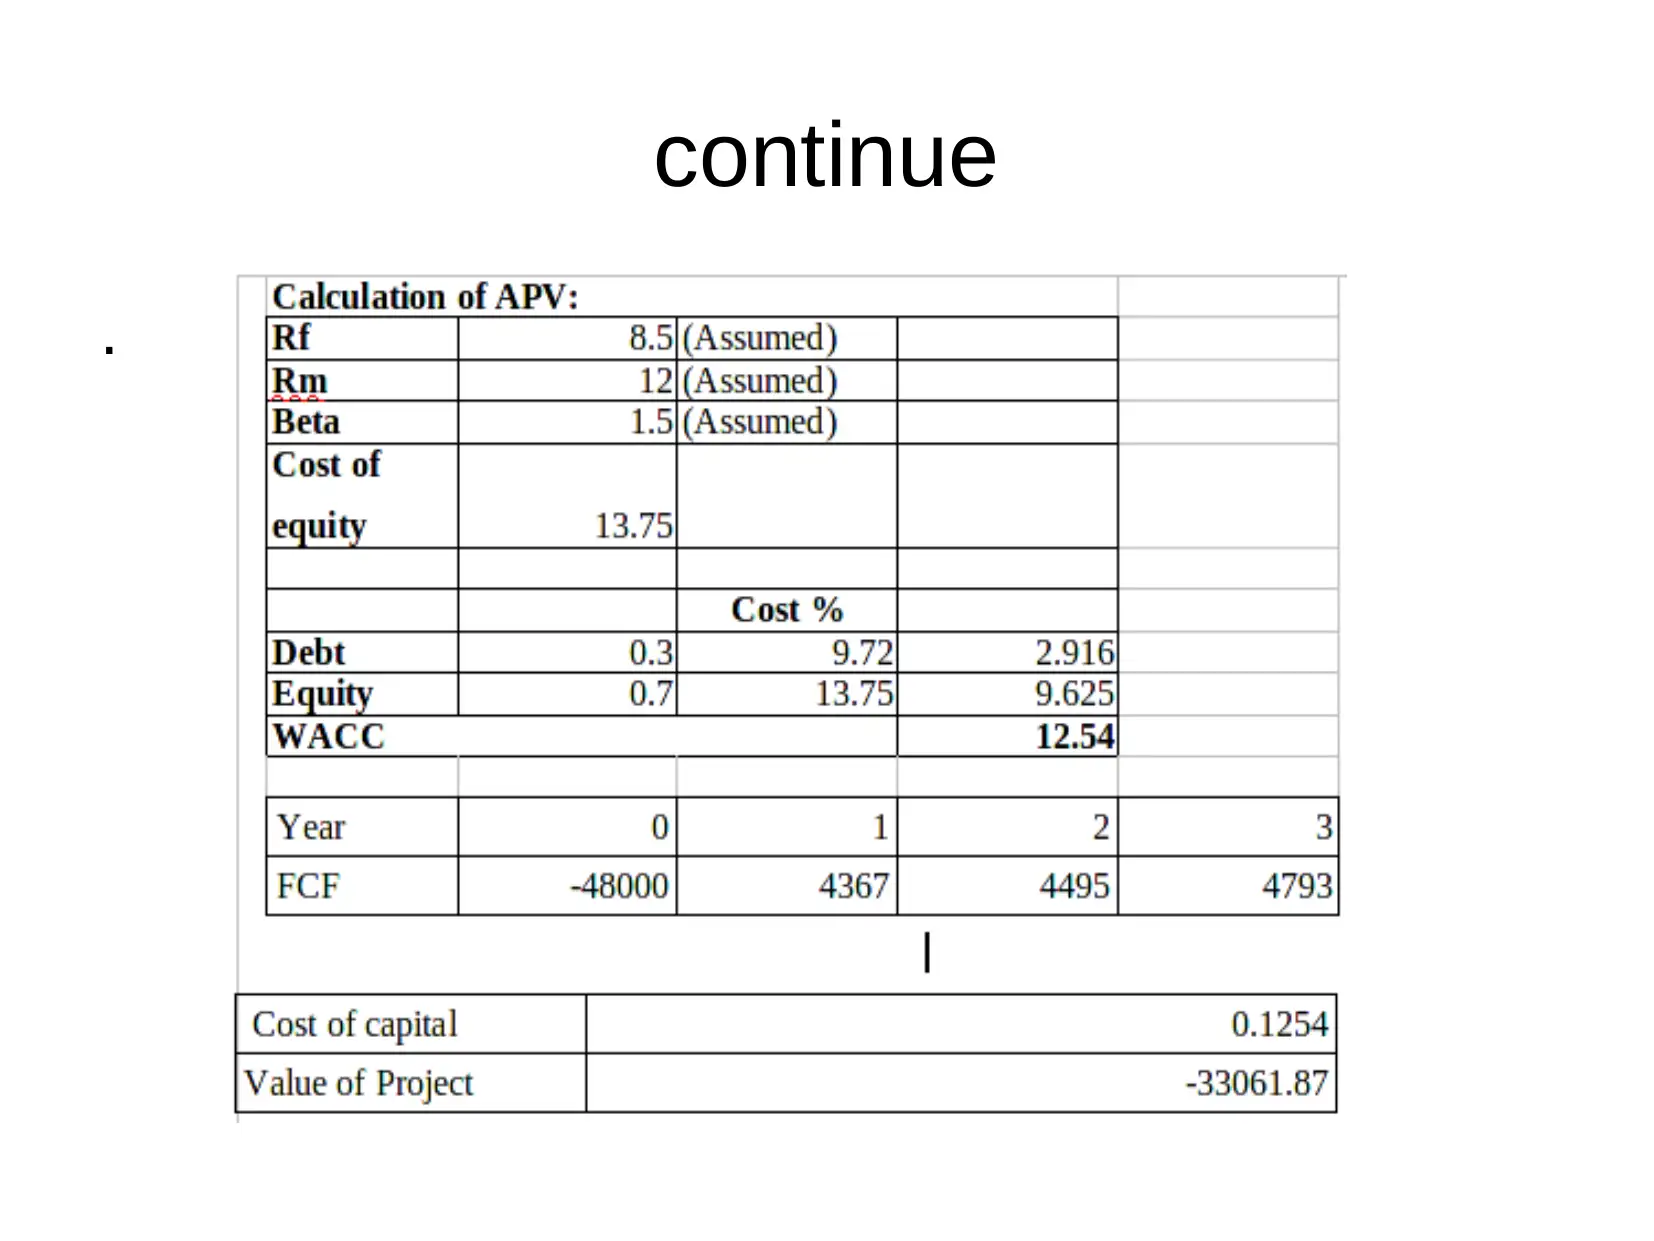
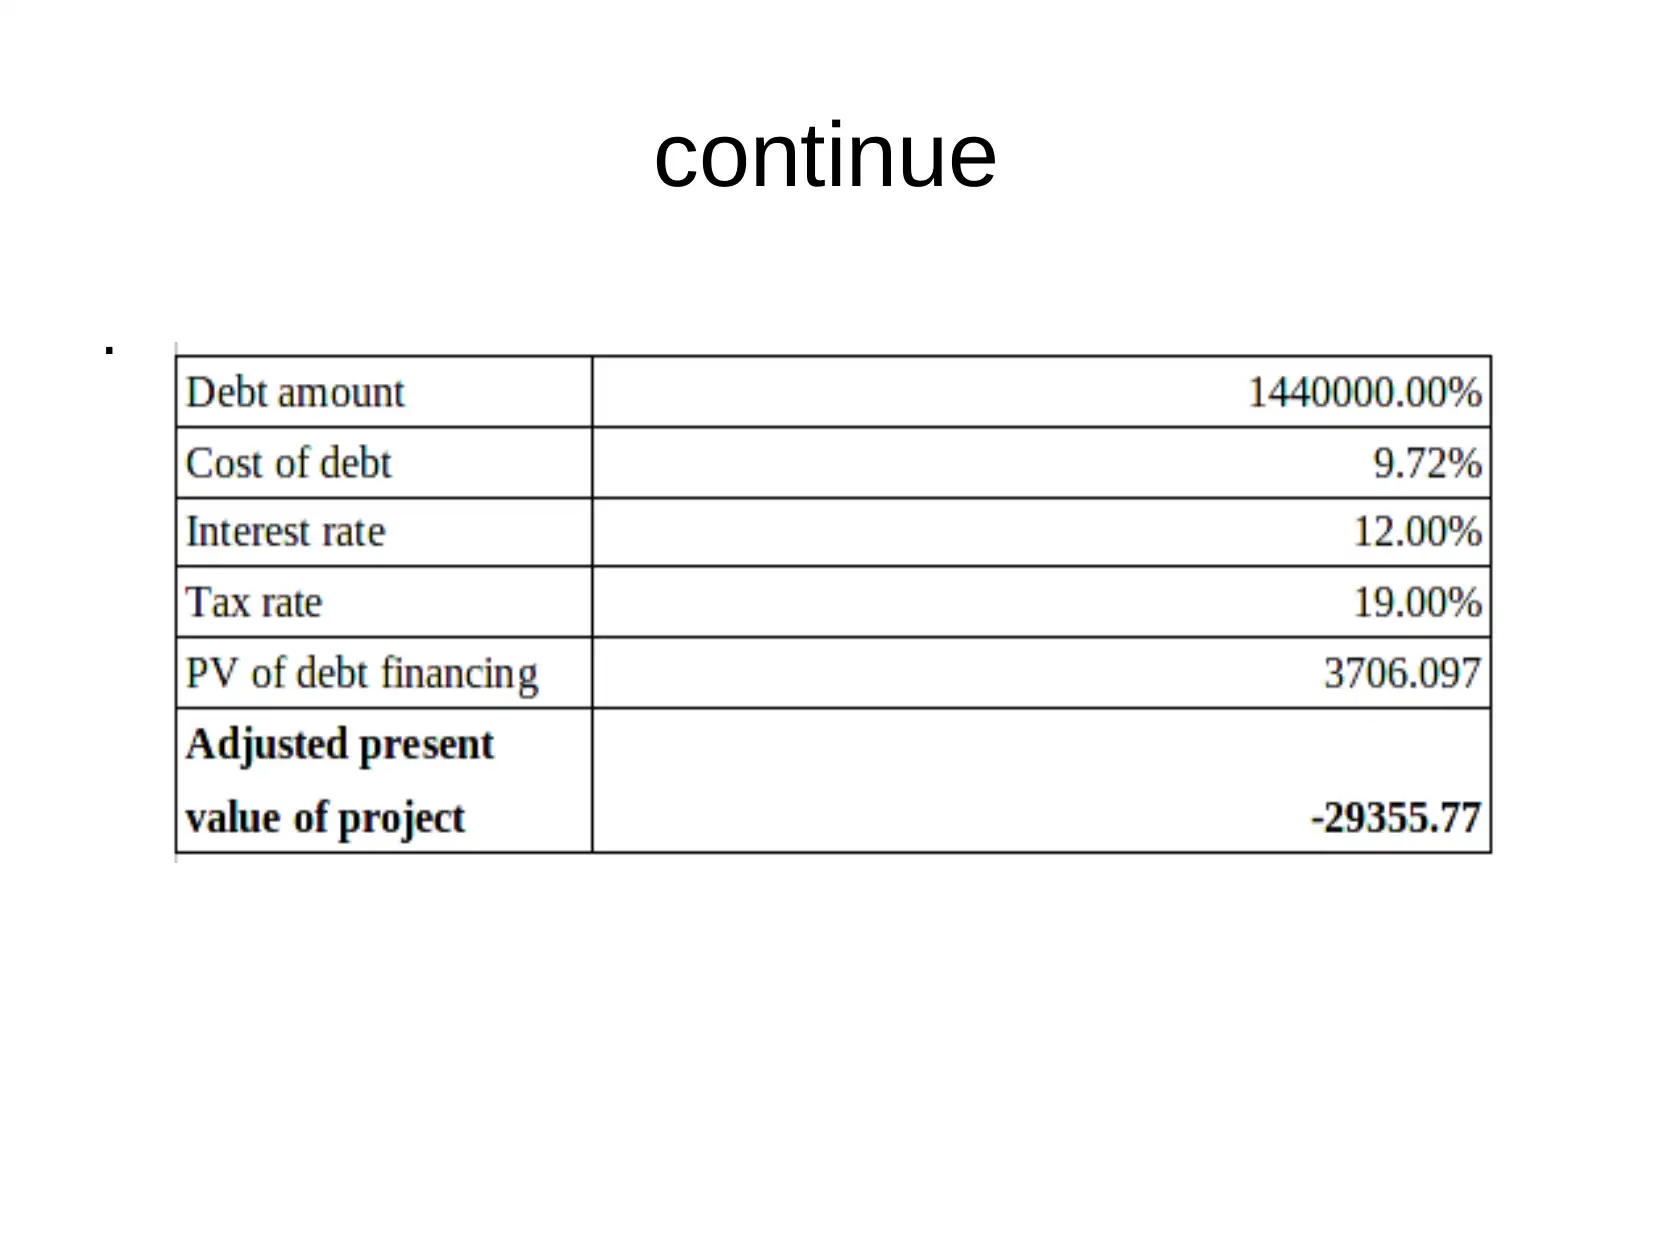
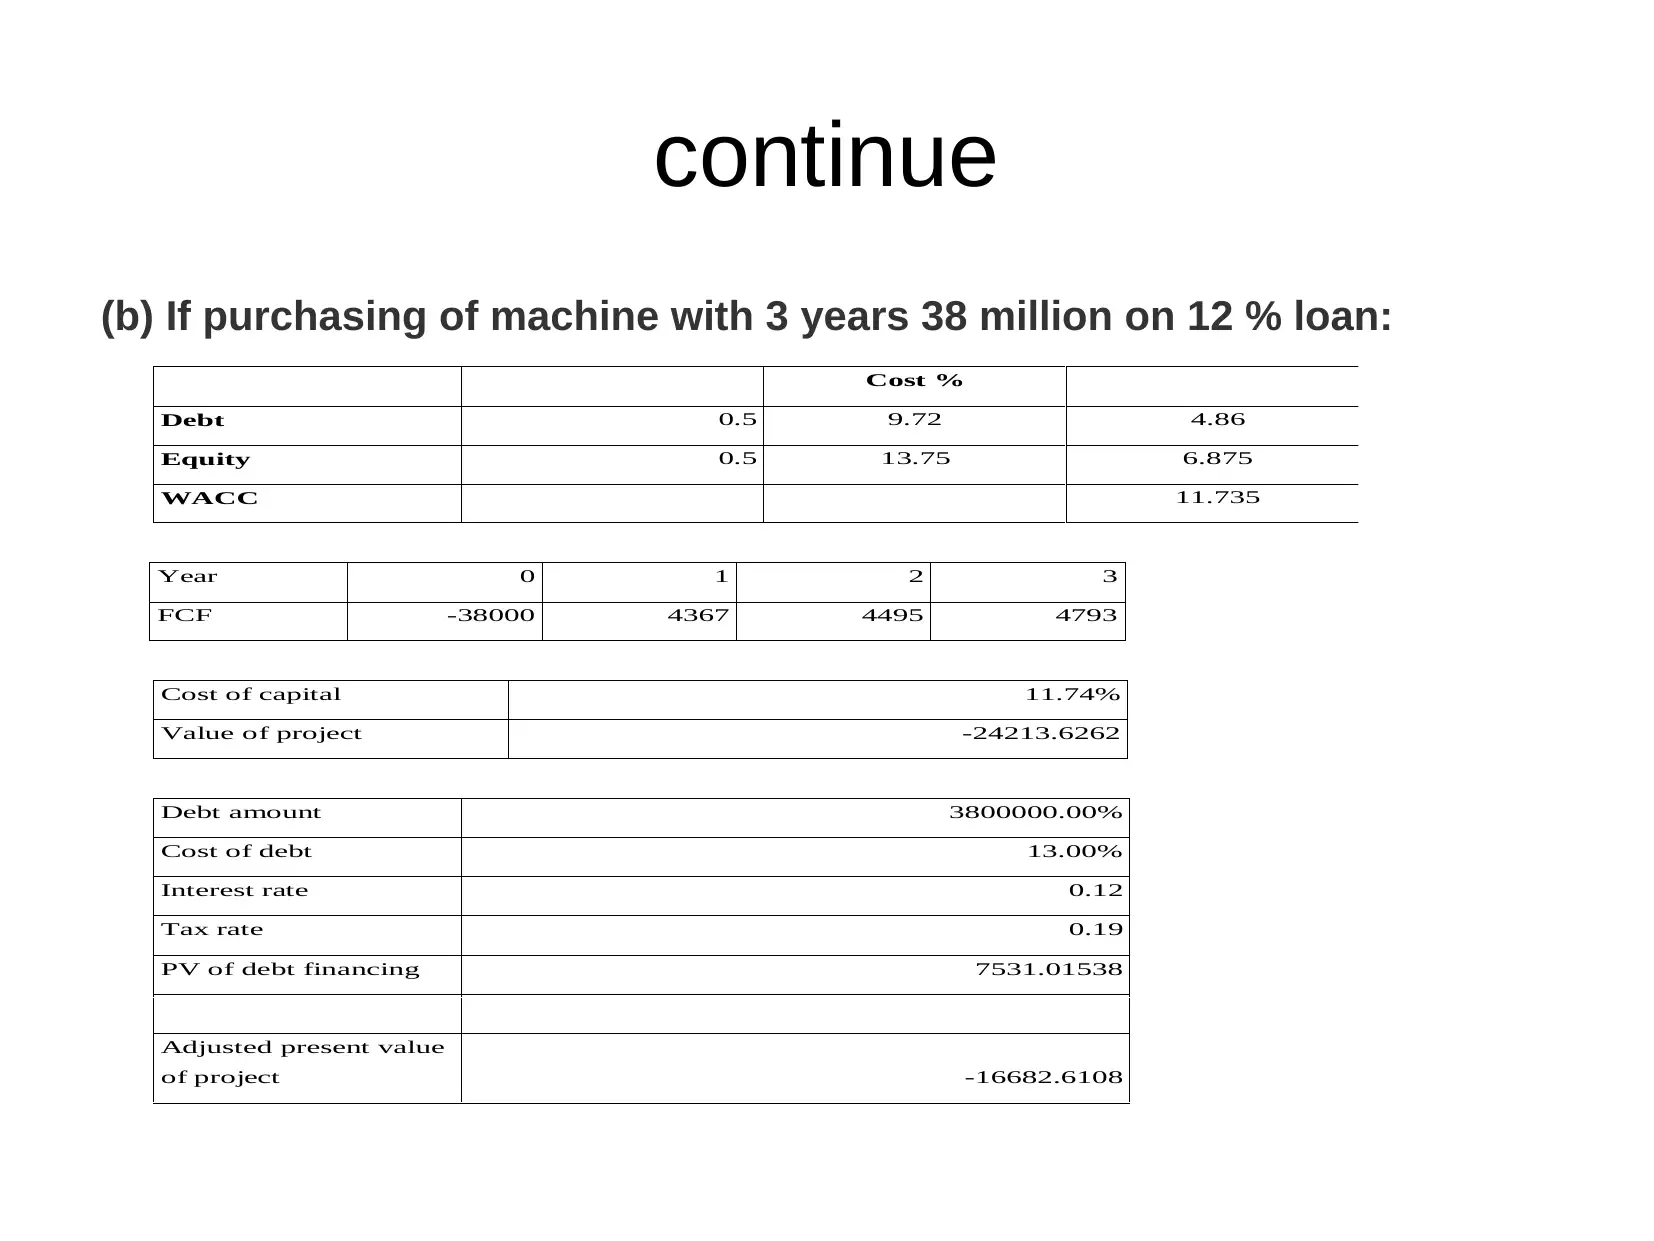
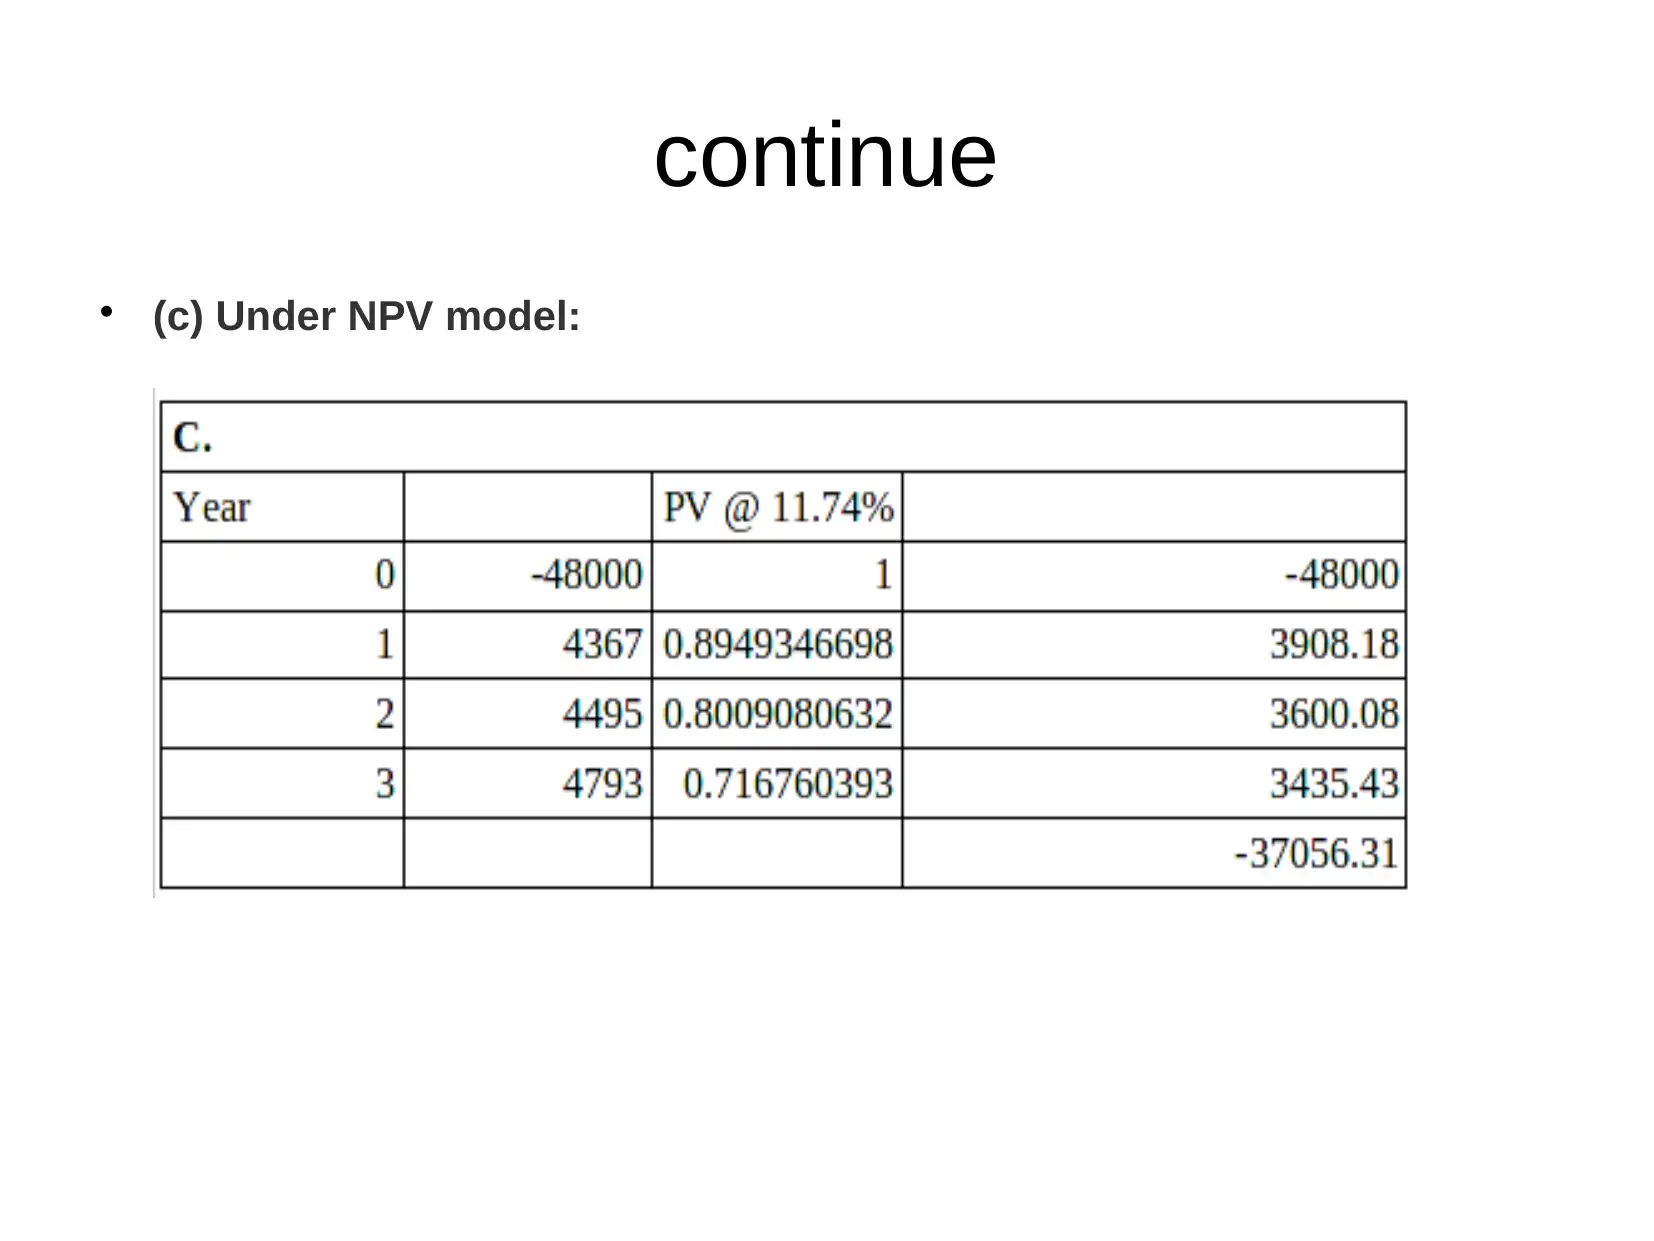
This financial analysis report evaluates project funding options for an investment committee, focusing on a project with a £48 million outlay and 50% debt capacity. The report employs Net Present Value (NPV) and Adjusted Present Value (APV) methods, alongside ratio analysis, to assess the financial viability of the project under different debt scenarios, including right and debt issue options. Financial and non-financial ratios, such as net profit and current ratios, are analyzed to identify potential risks and performance trends. The report presents calculations under APV, NPV, and a scenario involving a 12% loan, providing detailed financial projections for sales, costs, and cash flow. Ultimately, the report recommends against project initiation based on negative project values derived from the valuation models, while suggesting a specific debt financing option if investment is deemed necessary.
Document Page
.
Financial Analysis
tabler-icon-diamond-filled.svg

Paraphrase This Document

Need a fresh take? Get an instant paraphrase of this document with our AI Paraphraser
Document Page
Executive Summary
The objective of presentation is to helping investment committee to determine
which option of funding should be chose by company in project. For this
purpose various kind of valuation methods are used such as net present
value, adjusted present value etc.
Document Page
Rational of project
As per the current situation, there is project whose outlay is of 48 million and
debt capacity of 50%. As well as the company has 10 million retained
earnings. The company has two option in which first one is of right issue
whose cost is 2% of total amount raised. The second option is about debt
issue that occurs in 1% of total raised amount. Now the company's
investment committee wants to know that how much amount of total project
should be taken as debt.
Document Page
Ratio analysis
There are majorly two types of ratios which are financial and non financial
ratios. Herein below some financial and non financial ratios are mentioned:
1. Financial ratios:
tabler-icon-diamond-filled.svg

Paraphrase This Document

Need a fresh take? Get an instant paraphrase of this document with our AI Paraphraser
Document Page
continue
Document Page
continue
Analysis- On the basis of above mentioned financial analysis this can be find
out that their net profit ratio is of 8% in year 2015 that raised 2016 that raised
and became of 8.03% while in next year, it decreased till 7.23%.
In addition, the current ratio was of 1.38:1 in 2015 that decreased and became
of 0.92 :1 which remain same in next two years.
2. Non financial ratio-
Staff turn over ratio- This company's ratio is fluctuating in all three years. It
indicates that company's staff is rotating year by year which is a negative
aspect for company.
Absenteeism ratio- Company's ratio is variable in three years time period. In
year 2015, this ratio was lower while in next two years this raised
continuously.
Document Page
Project financials
(a) Under adjusted present value- By using of this method, the value of
company's project is of -29355.77.
(b) If purchasing of machine with 3 years 38 million on 12 % loan- In
this method, the value of project is of -16682.6108.
(c) Under NPV model- By using of this method, the value of project is
estimated of -37056.31.
tabler-icon-diamond-filled.svg

Paraphrase This Document

Need a fresh take? Get an instant paraphrase of this document with our AI Paraphraser
Document Page
Calculations
(a) Under adjusted present value
All figures in £'000 2019 2020 2021
Sales 7,500 8,700 9,000
COGS (2,140) (3,300) (3,280)
Gross Profit 5,360 5,400 5,720
Operating Expenses (648) (530) (610)
EBITDAa 4,712 4,870 5,110
Depreciation (12) (12) (12)
EBITa 4,700 4,858 5,098
Tax Expense (323) (353) (300)
EBIATa 4,377 4,505 4,798
CAPEXb 10 10 10
Investment in Working Capital 0 0 (5)
Free Cash Flow (FCF) 4367 4495 4793
Document Page
continue
.
Document Page
continue
.
tabler-icon-diamond-filled.svg

Paraphrase This Document

Need a fresh take? Get an instant paraphrase of this document with our AI Paraphraser
Document Page
continue
(b) If purchasing of machine with 3 years 38 million on 12 % loan:
Cost %
Debt 0.5 9.72 4.86
Equity 0.5 13.75 6.875
WACC 11.735
Year 0 1 2 3
FCF -38000 4367 4495 4793
Cost of capital 11.74%
Value of project -24213.6262
Debt amount 3800000.00%
Cost of debt 13.00%
Interest rate 0.12
Tax rate 0.19
PV of debt financing 7531.01538
Adjusted present value
of project -16682.6108
Document Page
continue
(c) Under NPV model:
chevron_up_icon
1 out of 15
circle_padding
hide_on_mobile
zoom_out_icon
[object Object]