Project Management Analysis: Red Zuma Project Report

Verified

Added on  2022/11/13

|15
|1208
|369
Project
AI Summary
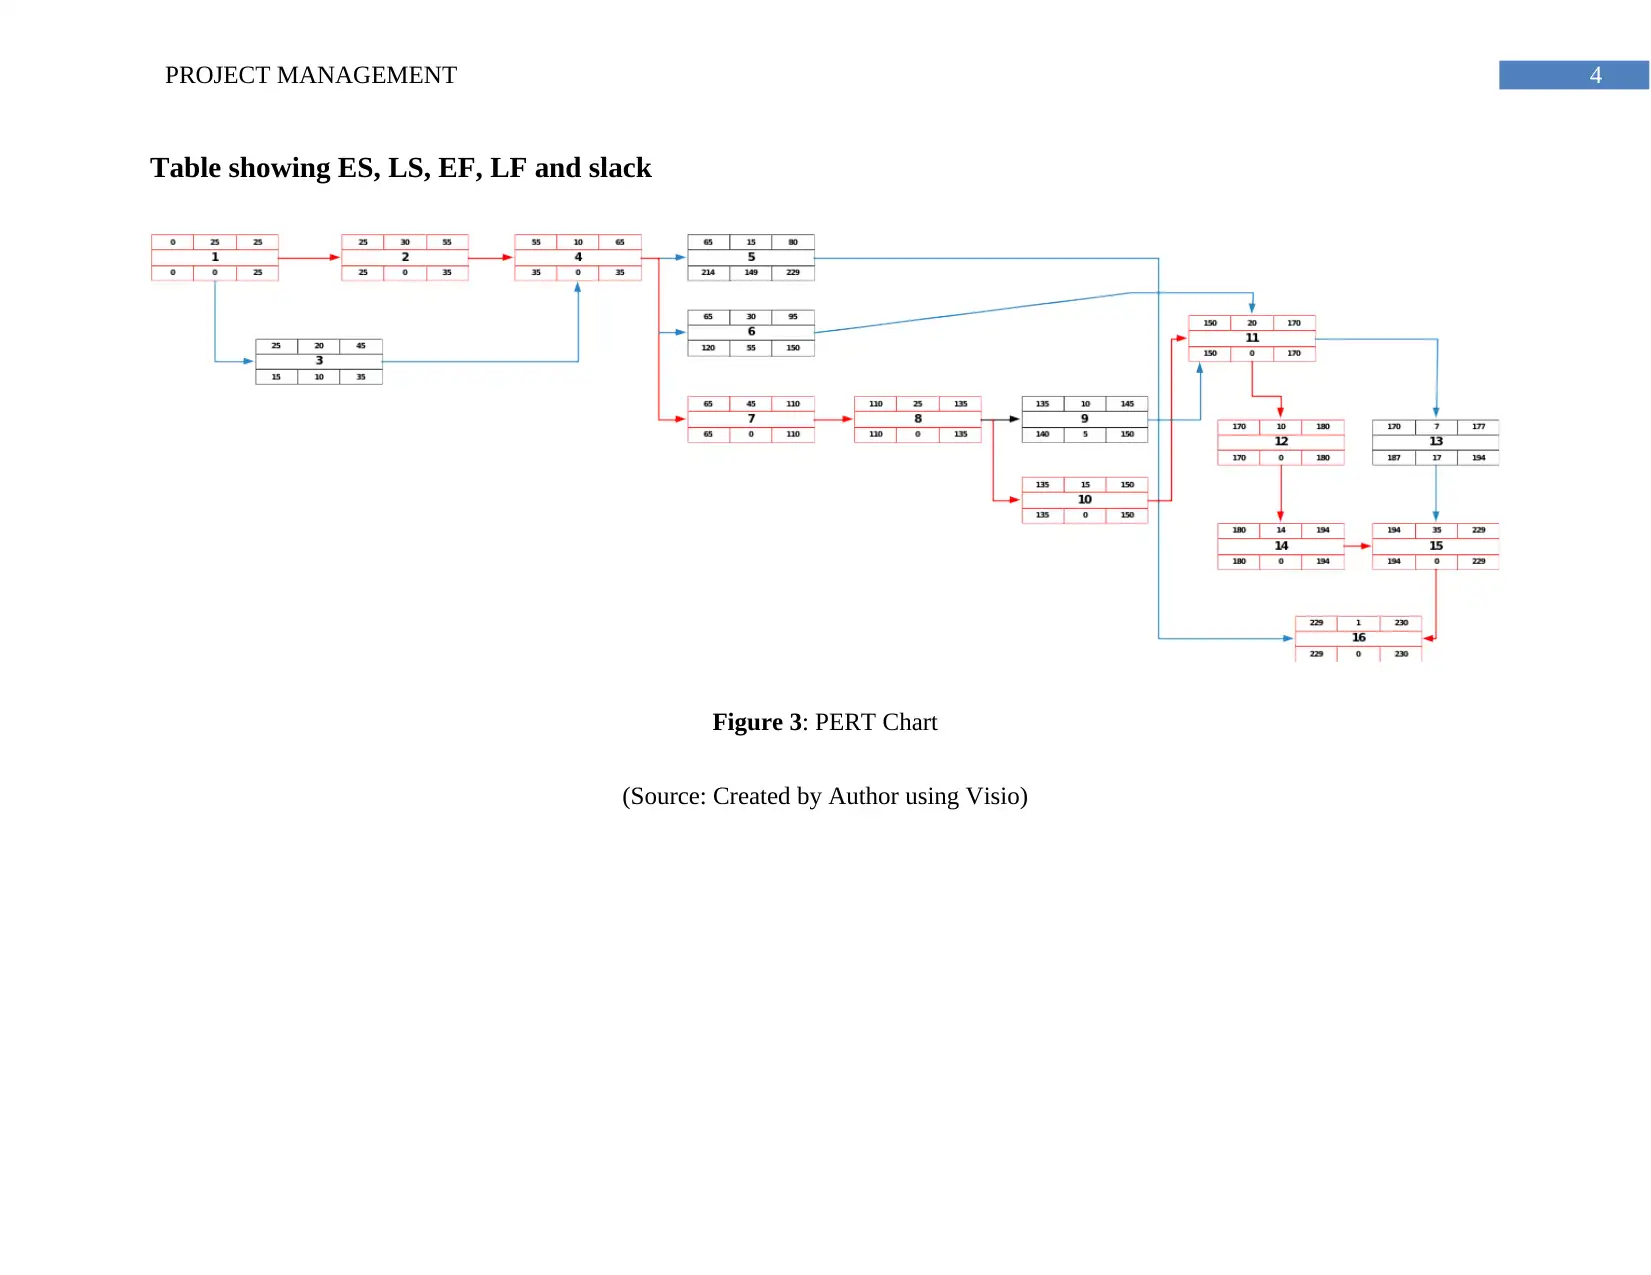
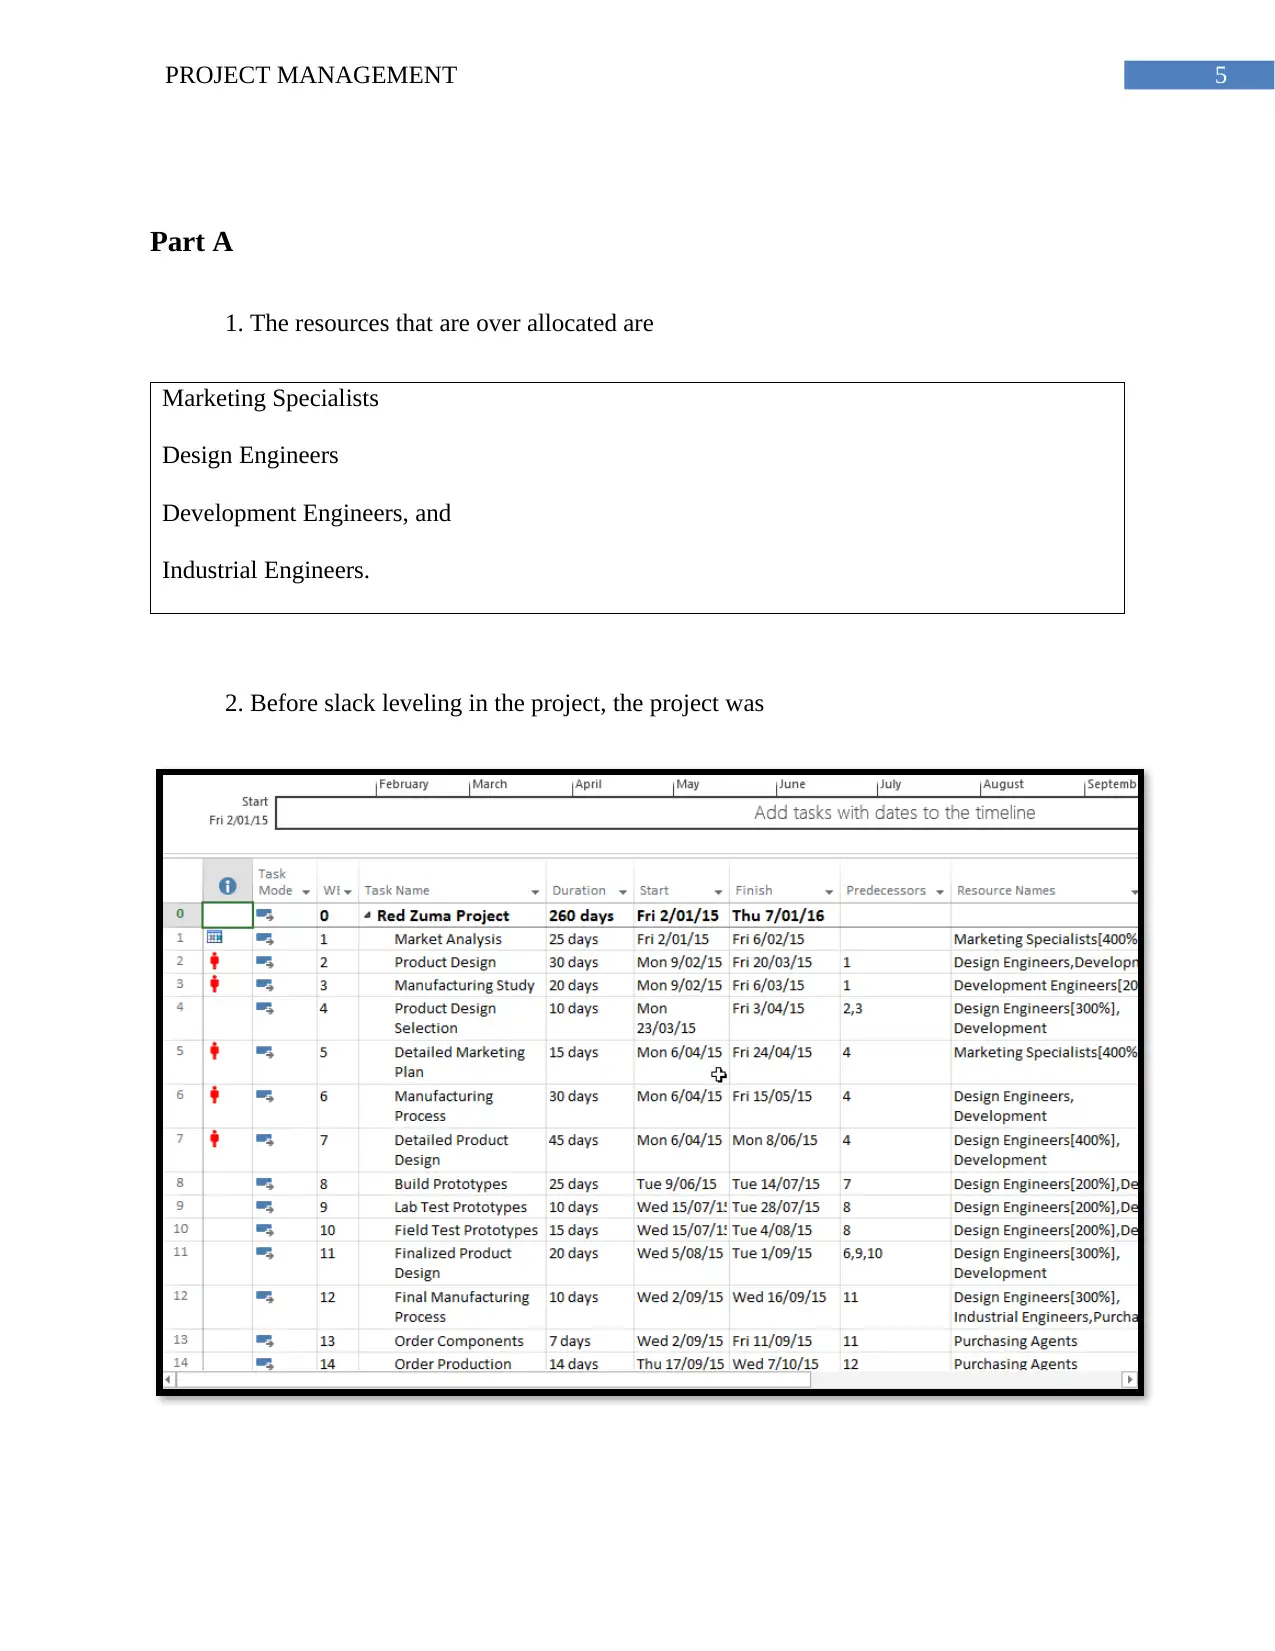
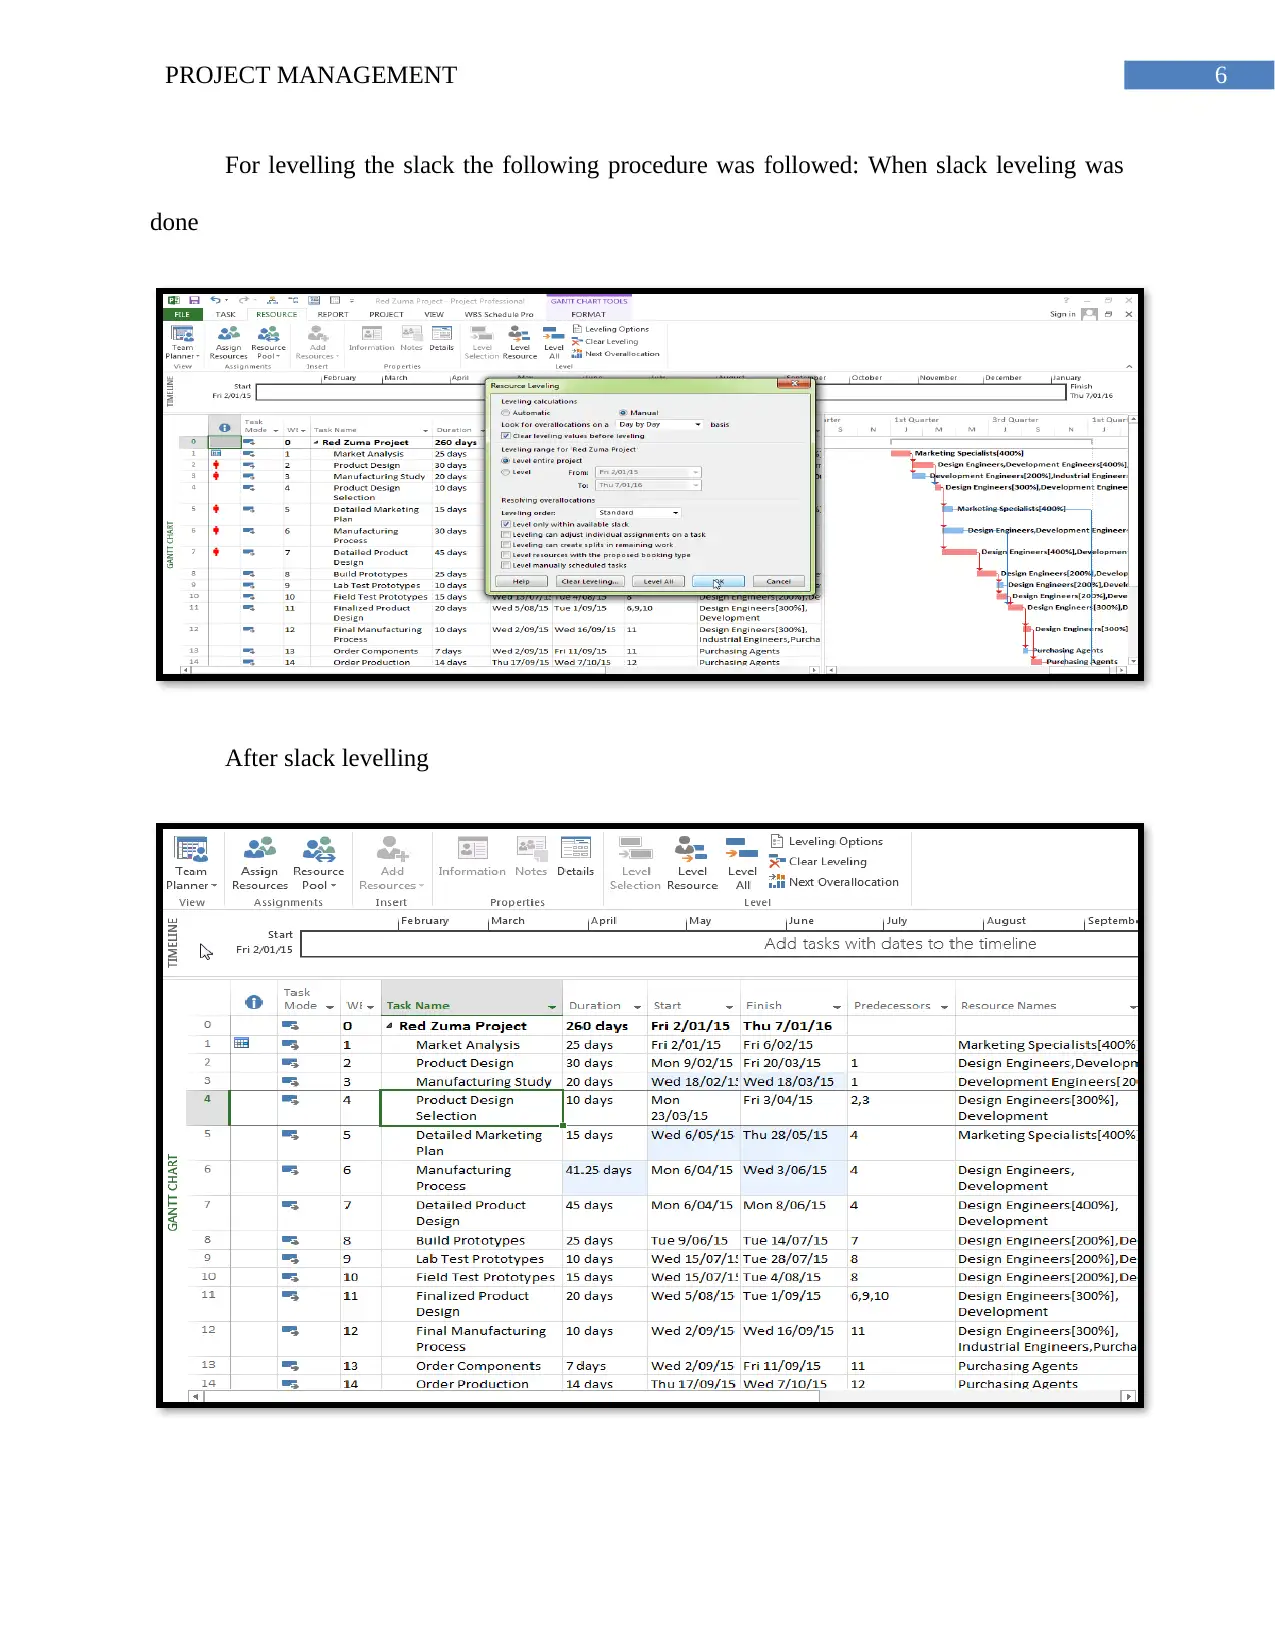
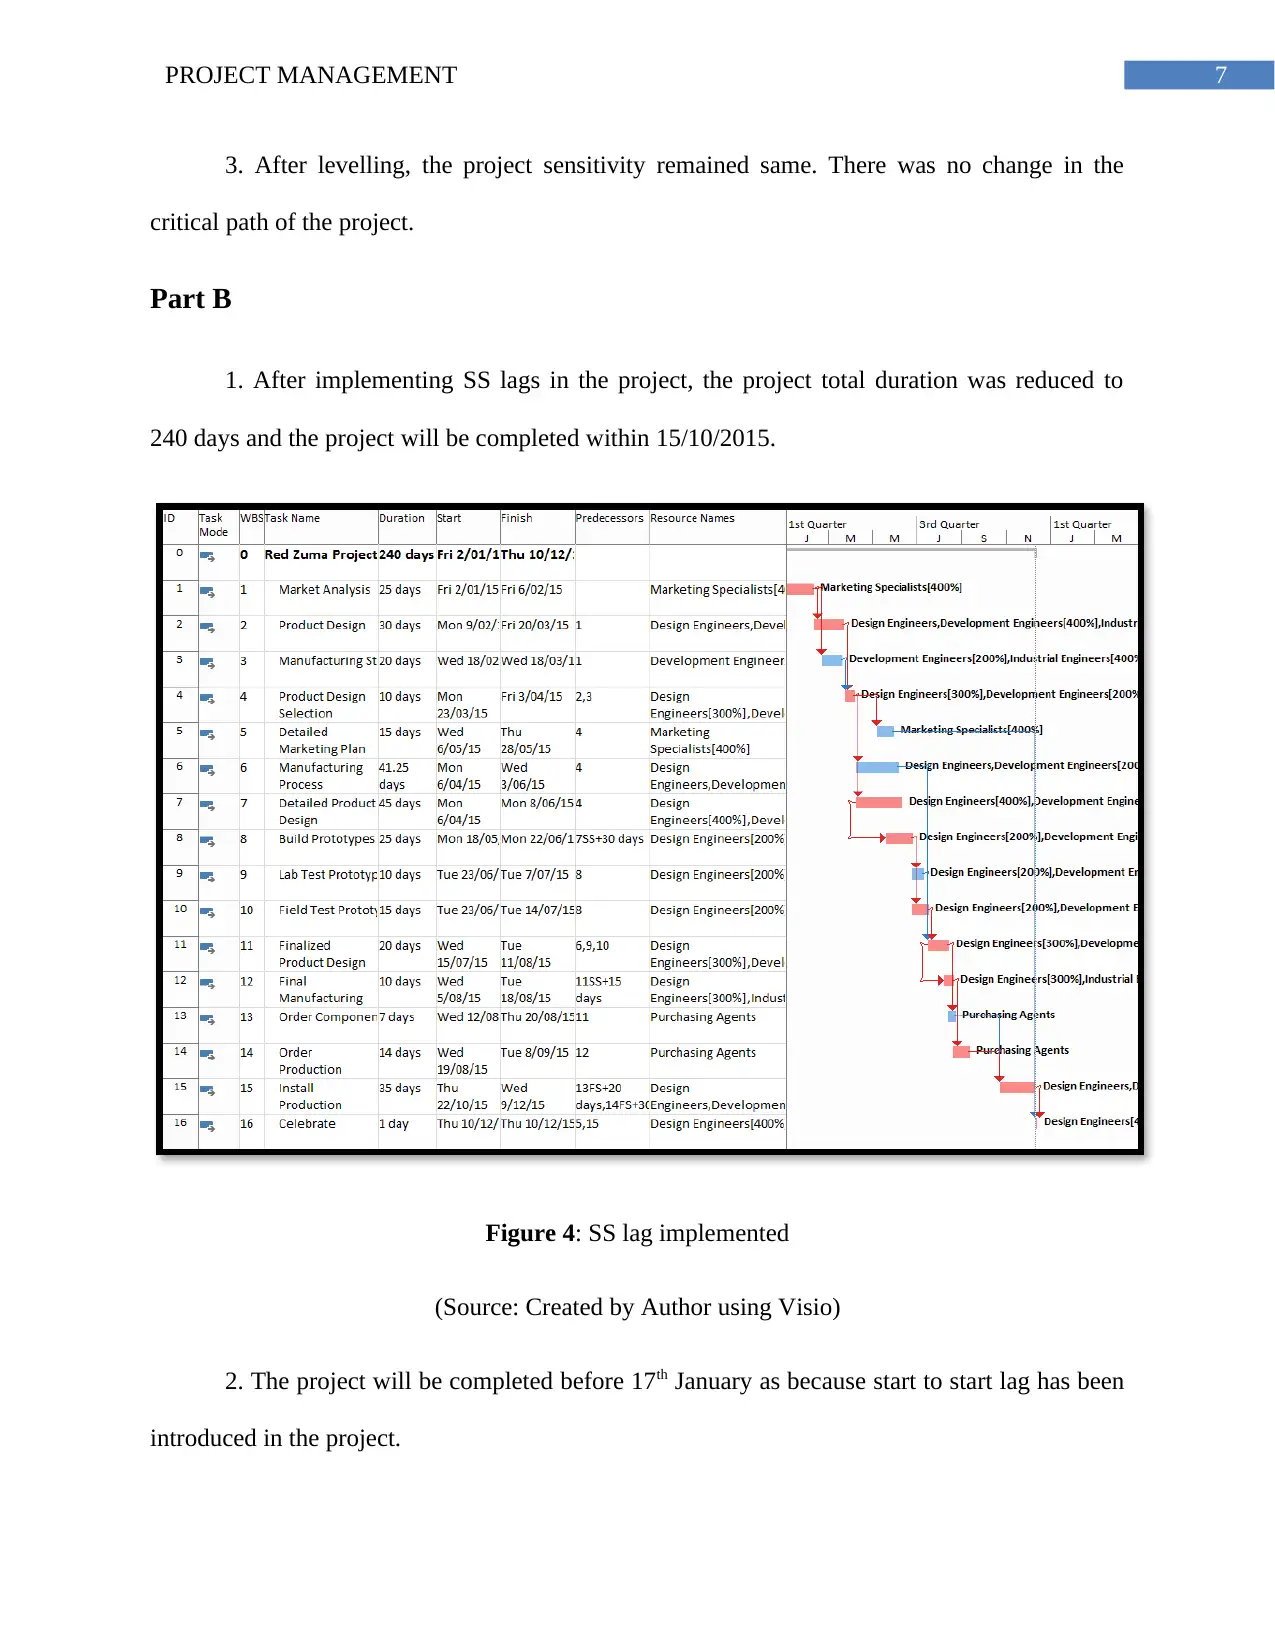
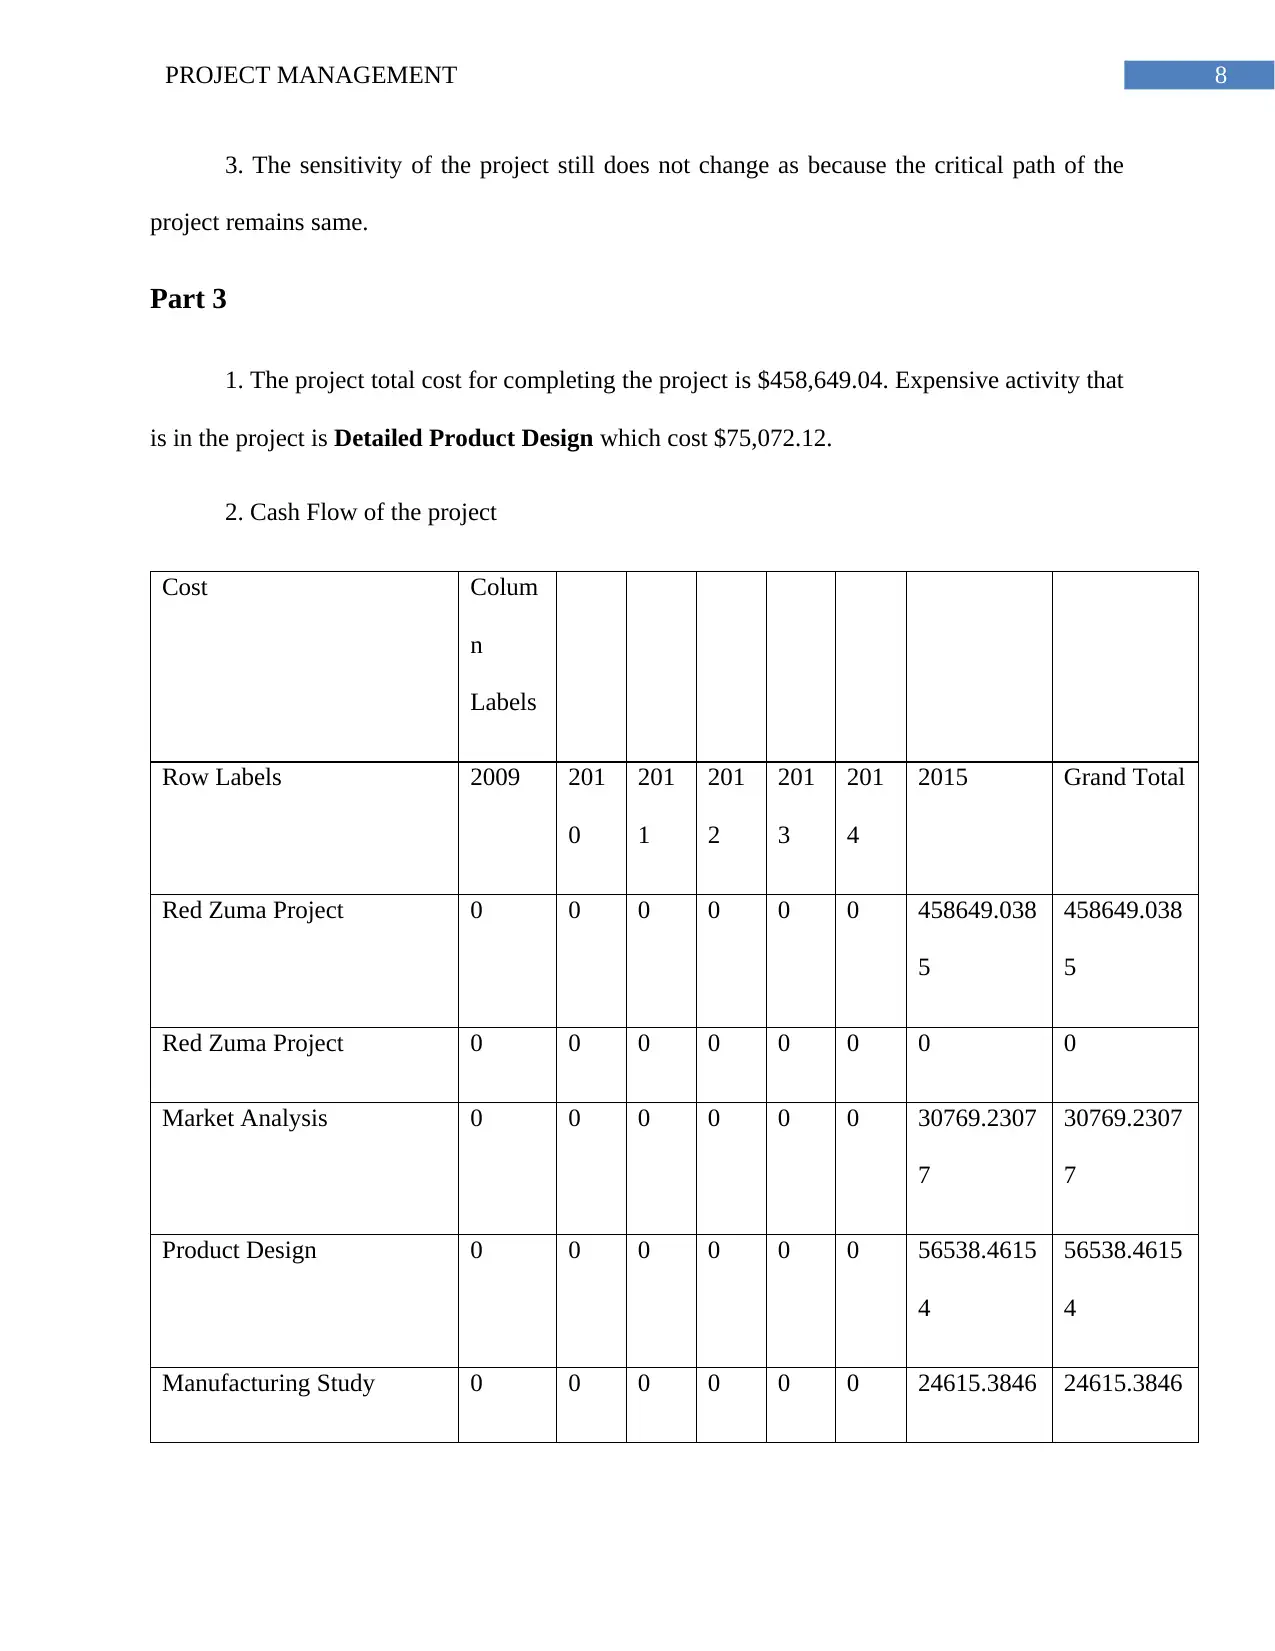
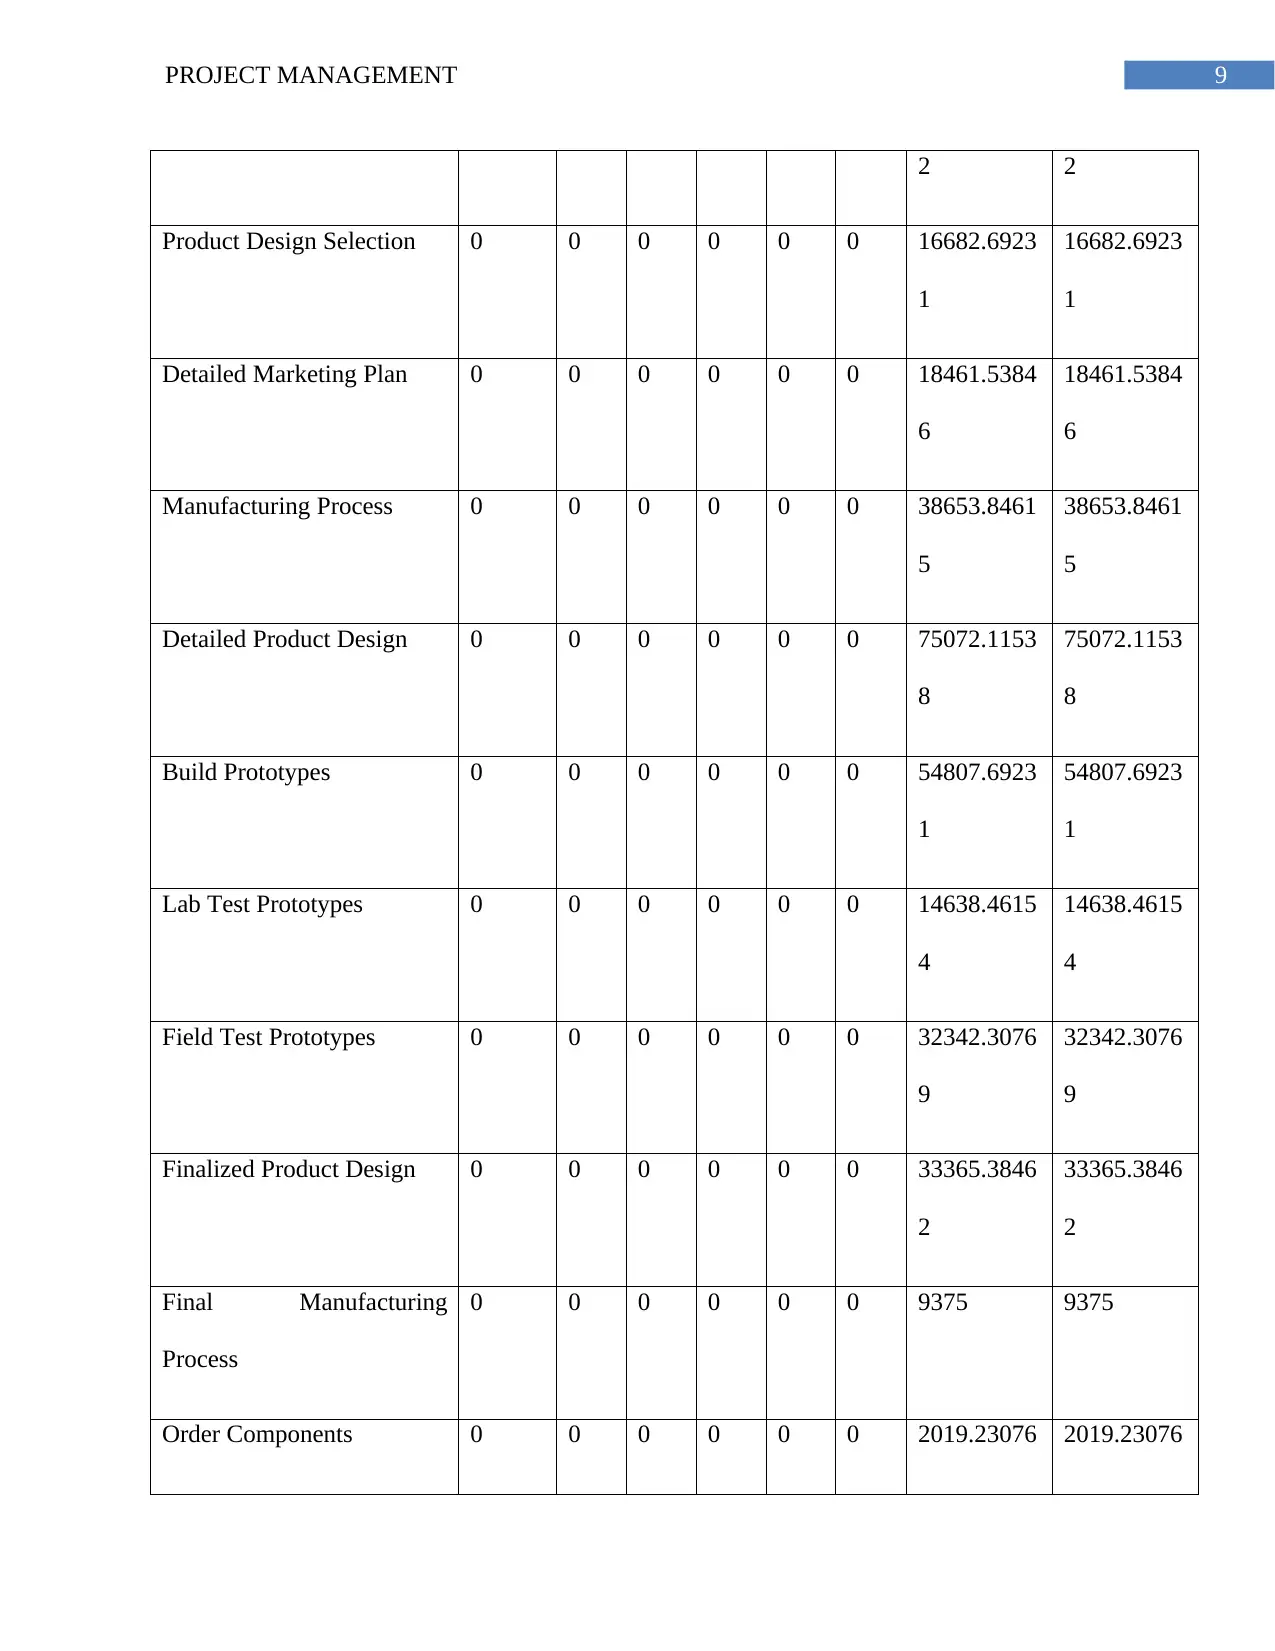
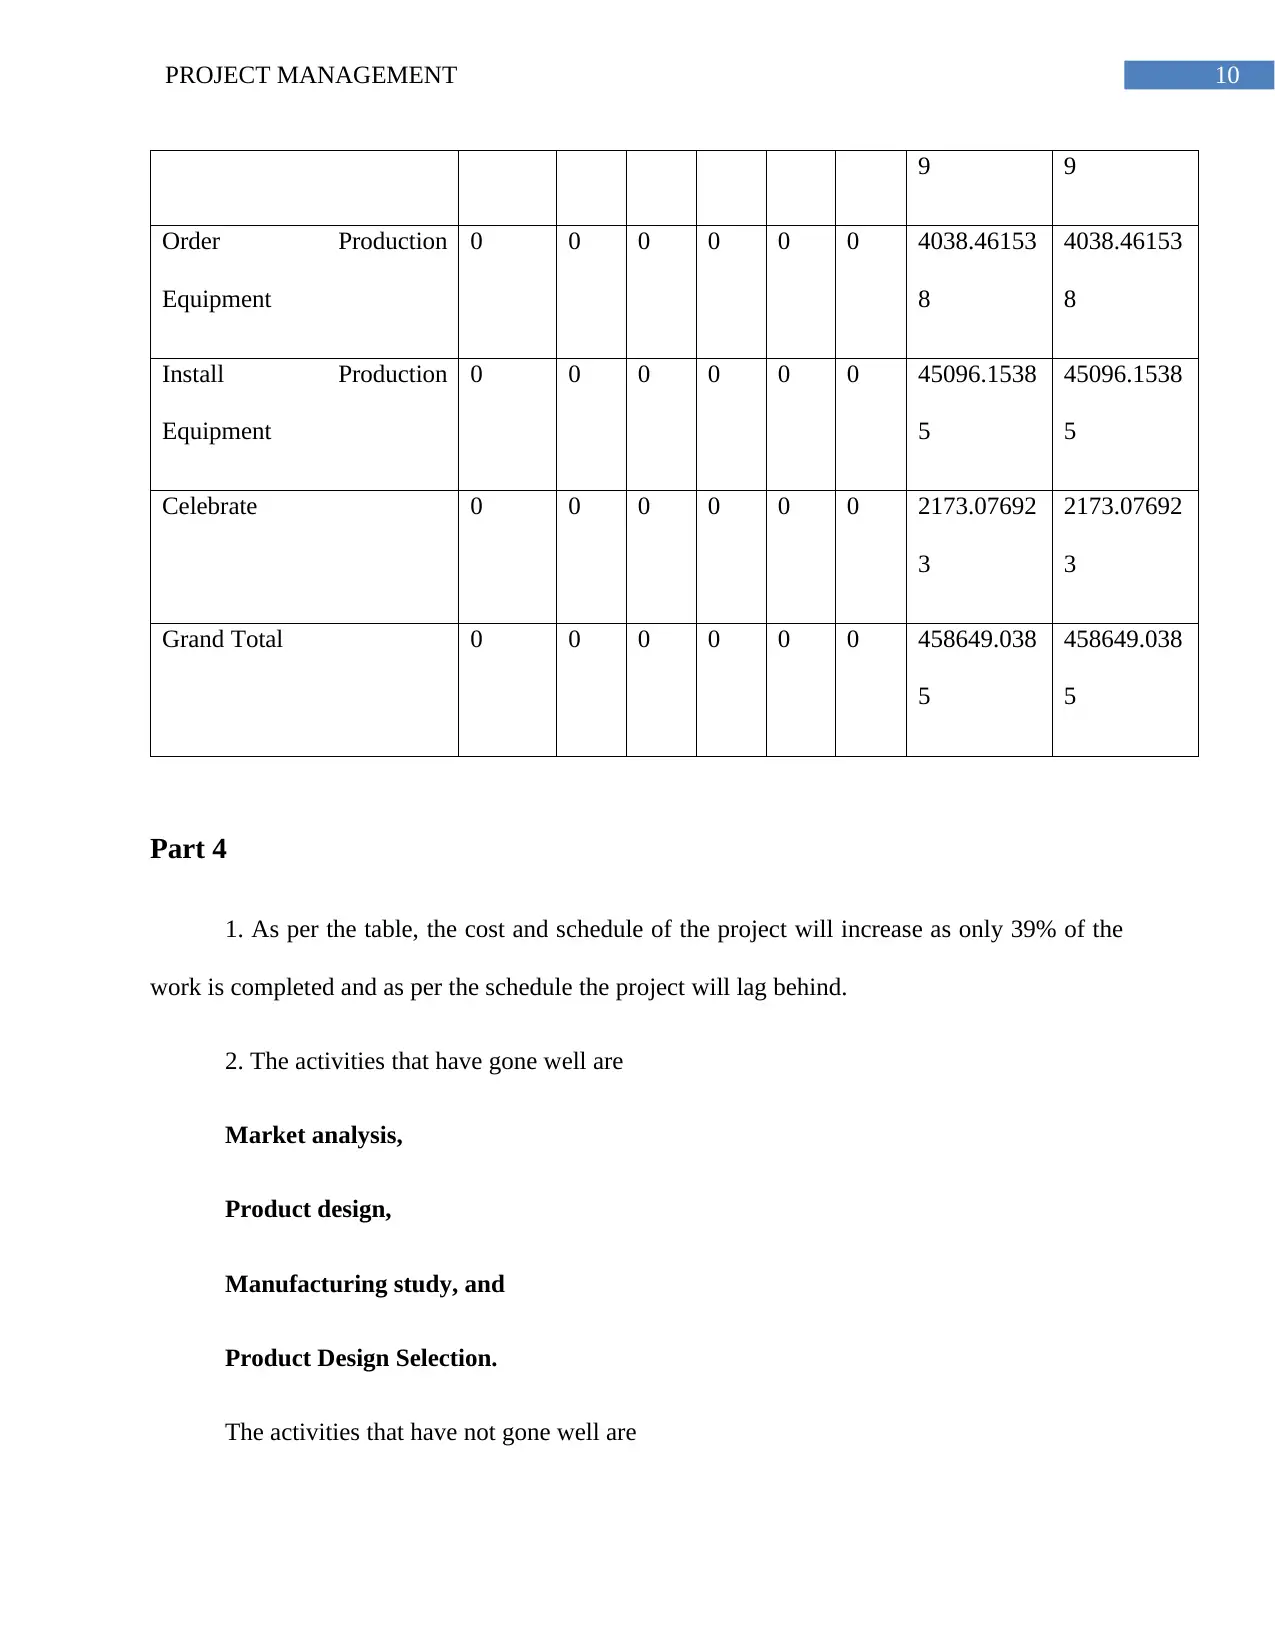
This project management assignment analyzes the Red Zuma Project, covering various aspects of project planning and execution. The assignment includes critical path analysis, Gantt charts, and network diagrams to illustrate project timelines and dependencies. It also addresses resource allocation, identifying over-allocated resources and the impact of slack leveling. The project's cost is examined, including a detailed cost breakdown and cash flow analysis. Furthermore, the assignment evaluates project progress, comparing the earned value with actual costs to assess schedule and cost variances. Finally, the assignment explores the effects of implementing start-to-start lags and provides recommendations based on the project's performance, including whether to invest additional funds and maintain the project's schedule and cost. The assignment also includes the use of MS Project and Visio to create the various charts and diagrams.
Document Page
Running head: PROJECT MANAGEMENT
Project Management
Name of Student-
Name of University-
Author’s Note-
tabler-icon-diamond-filled.svg

Paraphrase This Document

Need a fresh take? Get an instant paraphrase of this document with our AI Paraphraser
Document Page
1PROJECT MANAGEMENT
Part 1:
1. The scheduled project date for completing the project was 7th January, 2016.
2. Critical path for included in the project for project completion are 1 – 2 - 4 – 7 – 8 – 10
– 11 – 12 – 13- 15 – 16.
3. The activity that has highest number of slack in the project is Detailed Marketing
Plan with 179 days slack days.
4. The project network for the Red Zuma Project is insensitive because the project has
only one particular critical path in project. The project is considered to be to be sensitive if
project has two or more critical. But this project do not have two critical paths. So, the network is
considered as sensitive one.
5. Finalized Product design and Install production equipment can be considered as
two sensible milestones that the project have. In the finalized product design activity, the build
of the prototypes and the lab test prototypes are finalized and all field tests are completed.
Another milestone that can be considered as sensible milestone is Installing production
equipment. After the production equipment being installed, the project is completed and all the
other steps are to be included before this step.
Document Page
2PROJECT MANAGEMENT
Gantt chart
Figure 1: Gantt chart
(Source: Created by Author using MS project)
Document Page
3PROJECT MANAGEMENT
Network Diagram
Figure 2: Network Diagram
(Source: Created by Author using MS project)
tabler-icon-diamond-filled.svg

Paraphrase This Document

Need a fresh take? Get an instant paraphrase of this document with our AI Paraphraser
Document Page
4PROJECT MANAGEMENT
Table showing ES, LS, EF, LF and slack
Figure 3: PERT Chart
(Source: Created by Author using Visio)
Document Page
5PROJECT MANAGEMENT
Part A
1. The resources that are over allocated are
Marketing Specialists
Design Engineers
Development Engineers, and
Industrial Engineers.
2. Before slack leveling in the project, the project was
Document Page
6PROJECT MANAGEMENT
For levelling the slack the following procedure was followed: When slack leveling was
done
After slack levelling
tabler-icon-diamond-filled.svg

Paraphrase This Document

Need a fresh take? Get an instant paraphrase of this document with our AI Paraphraser
Document Page
7PROJECT MANAGEMENT
3. After levelling, the project sensitivity remained same. There was no change in the
critical path of the project.
Part B
1. After implementing SS lags in the project, the project total duration was reduced to
240 days and the project will be completed within 15/10/2015.
Figure 4: SS lag implemented
(Source: Created by Author using Visio)
2. The project will be completed before 17th January as because start to start lag has been
introduced in the project.
Document Page
8PROJECT MANAGEMENT
3. The sensitivity of the project still does not change as because the critical path of the
project remains same.
Part 3
1. The project total cost for completing the project is $458,649.04. Expensive activity that
is in the project is Detailed Product Design which cost $75,072.12.
2. Cash Flow of the project
Cost Colum
n
Labels
Row Labels 2009 201
0
201
1
201
2
201
3
201
4
2015 Grand Total
Red Zuma Project 0 0 0 0 0 0 458649.038
5
458649.038
5
Red Zuma Project 0 0 0 0 0 0 0 0
Market Analysis 0 0 0 0 0 0 30769.2307
7
30769.2307
7
Product Design 0 0 0 0 0 0 56538.4615
4
56538.4615
4
Manufacturing Study 0 0 0 0 0 0 24615.3846 24615.3846
Document Page
9PROJECT MANAGEMENT
2 2
Product Design Selection 0 0 0 0 0 0 16682.6923
1
16682.6923
1
Detailed Marketing Plan 0 0 0 0 0 0 18461.5384
6
18461.5384
6
Manufacturing Process 0 0 0 0 0 0 38653.8461
5
38653.8461
5
Detailed Product Design 0 0 0 0 0 0 75072.1153
8
75072.1153
8
Build Prototypes 0 0 0 0 0 0 54807.6923
1
54807.6923
1
Lab Test Prototypes 0 0 0 0 0 0 14638.4615
4
14638.4615
4
Field Test Prototypes 0 0 0 0 0 0 32342.3076
9
32342.3076
9
Finalized Product Design 0 0 0 0 0 0 33365.3846
2
33365.3846
2
Final Manufacturing
Process
0 0 0 0 0 0 9375 9375
Order Components 0 0 0 0 0 0 2019.23076 2019.23076
tabler-icon-diamond-filled.svg

Paraphrase This Document

Need a fresh take? Get an instant paraphrase of this document with our AI Paraphraser
Document Page
10PROJECT MANAGEMENT
9 9
Order Production
Equipment
0 0 0 0 0 0 4038.46153
8
4038.46153
8
Install Production
Equipment
0 0 0 0 0 0 45096.1538
5
45096.1538
5
Celebrate 0 0 0 0 0 0 2173.07692
3
2173.07692
3
Grand Total 0 0 0 0 0 0 458649.038
5
458649.038
5
Part 4
1. As per the table, the cost and schedule of the project will increase as only 39% of the
work is completed and as per the schedule the project will lag behind.
2. The activities that have gone well are
Market analysis,
Product design,
Manufacturing study, and
Product Design Selection.
The activities that have not gone well are
Document Page
11PROJECT MANAGEMENT
Detailed marketing Plan,
Manufacturing process, and
Build prototypes.
3. The project been accomplished is 46% and the project will lag behind as per the
project schedule.
4. EAC of the project = BAC (Budget at completion) / Cost performance index (CPI)
CPI = Earned value / actual Cost
Earned value = Total project budget * % of project completion
= $458,649.04 * 43%
= $197219.0872
CPI = 197219.0872 / 230,918.27
CPI = 0.85
BAC = $ 458,649
EAC = BAC / CPI
EAC = 458,649 / 0.85 = 5, 37,019
5. Estimated Completion date of the project is 15/10/2015.
chevron_up_icon
1 out of 15
circle_padding
hide_on_mobile
zoom_out_icon
[object Object]