Project Management Assignment Report - [University Name]

Verified

Added on  2022/08/22

|9
|845
|25
Project
AI Summary
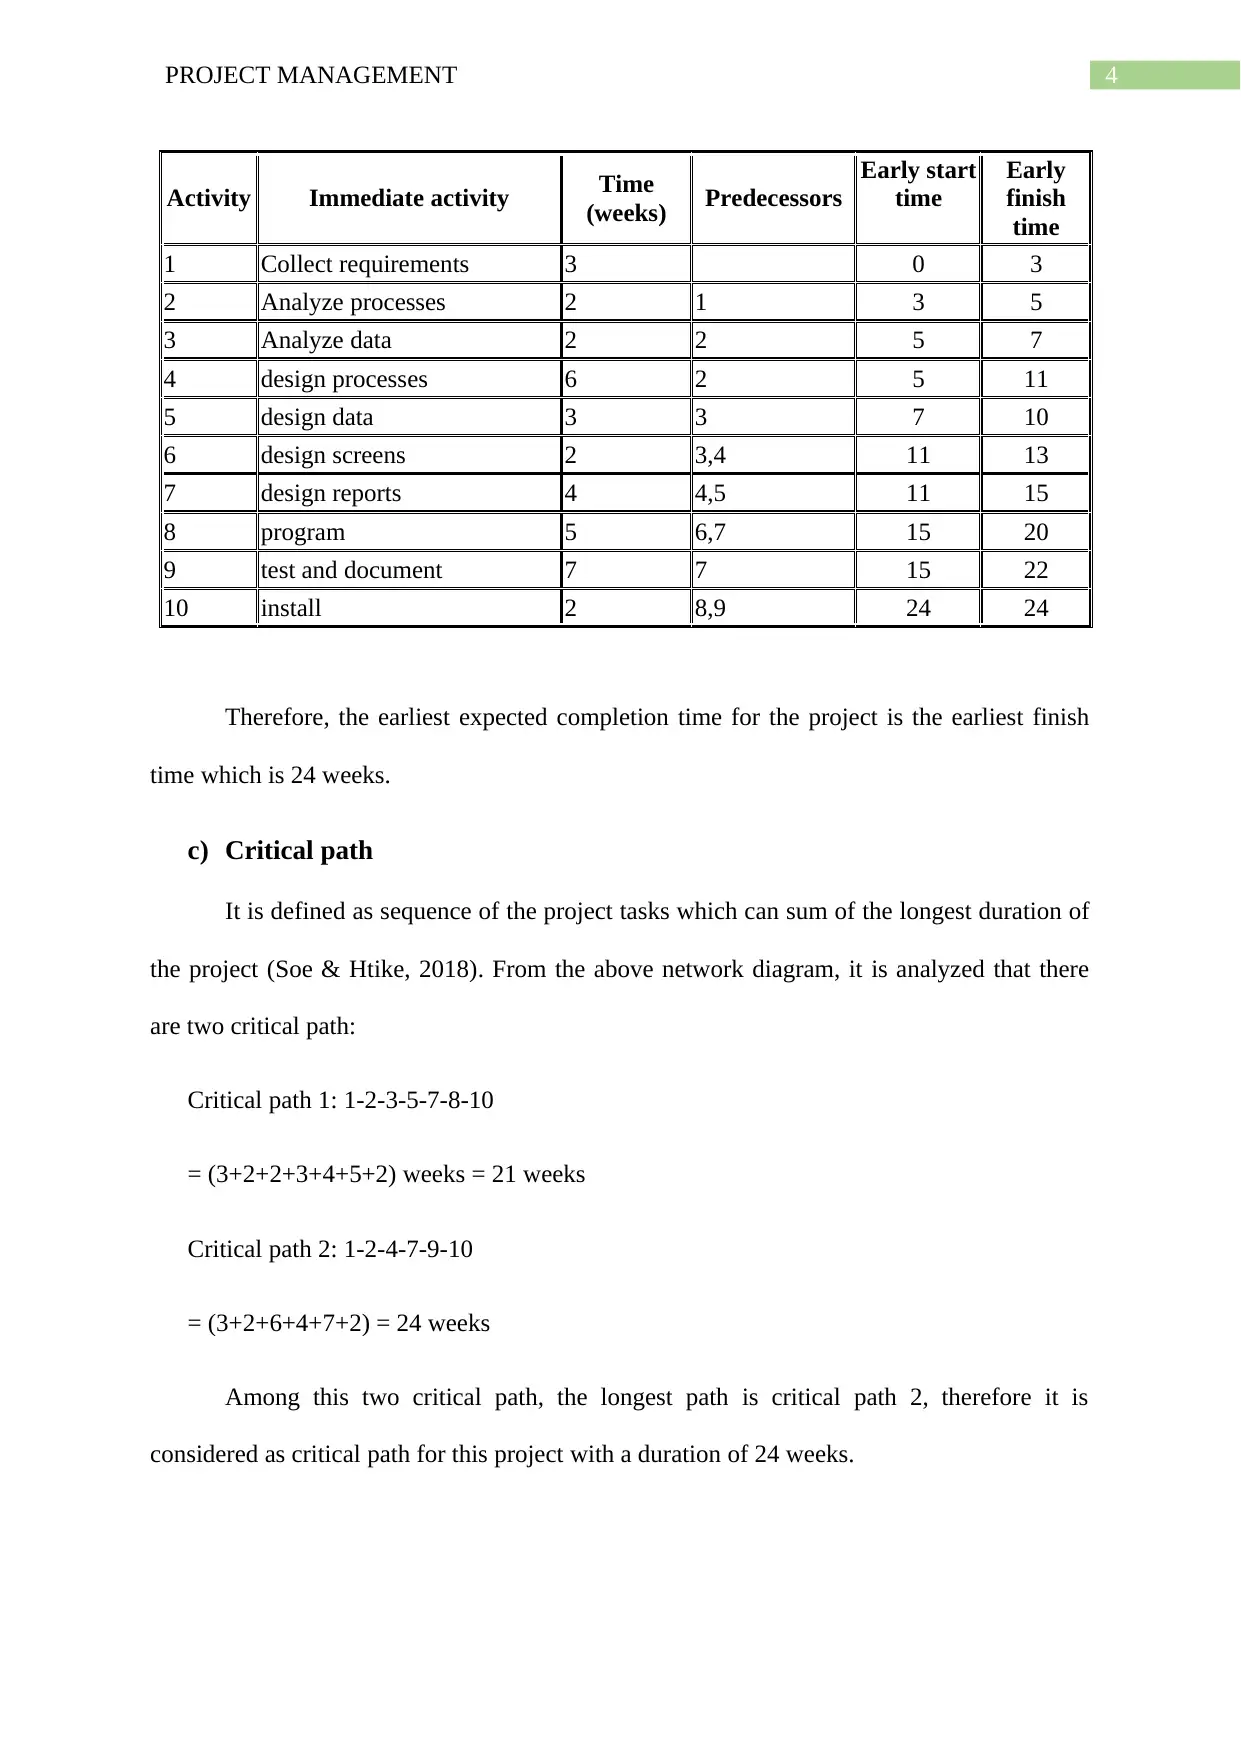
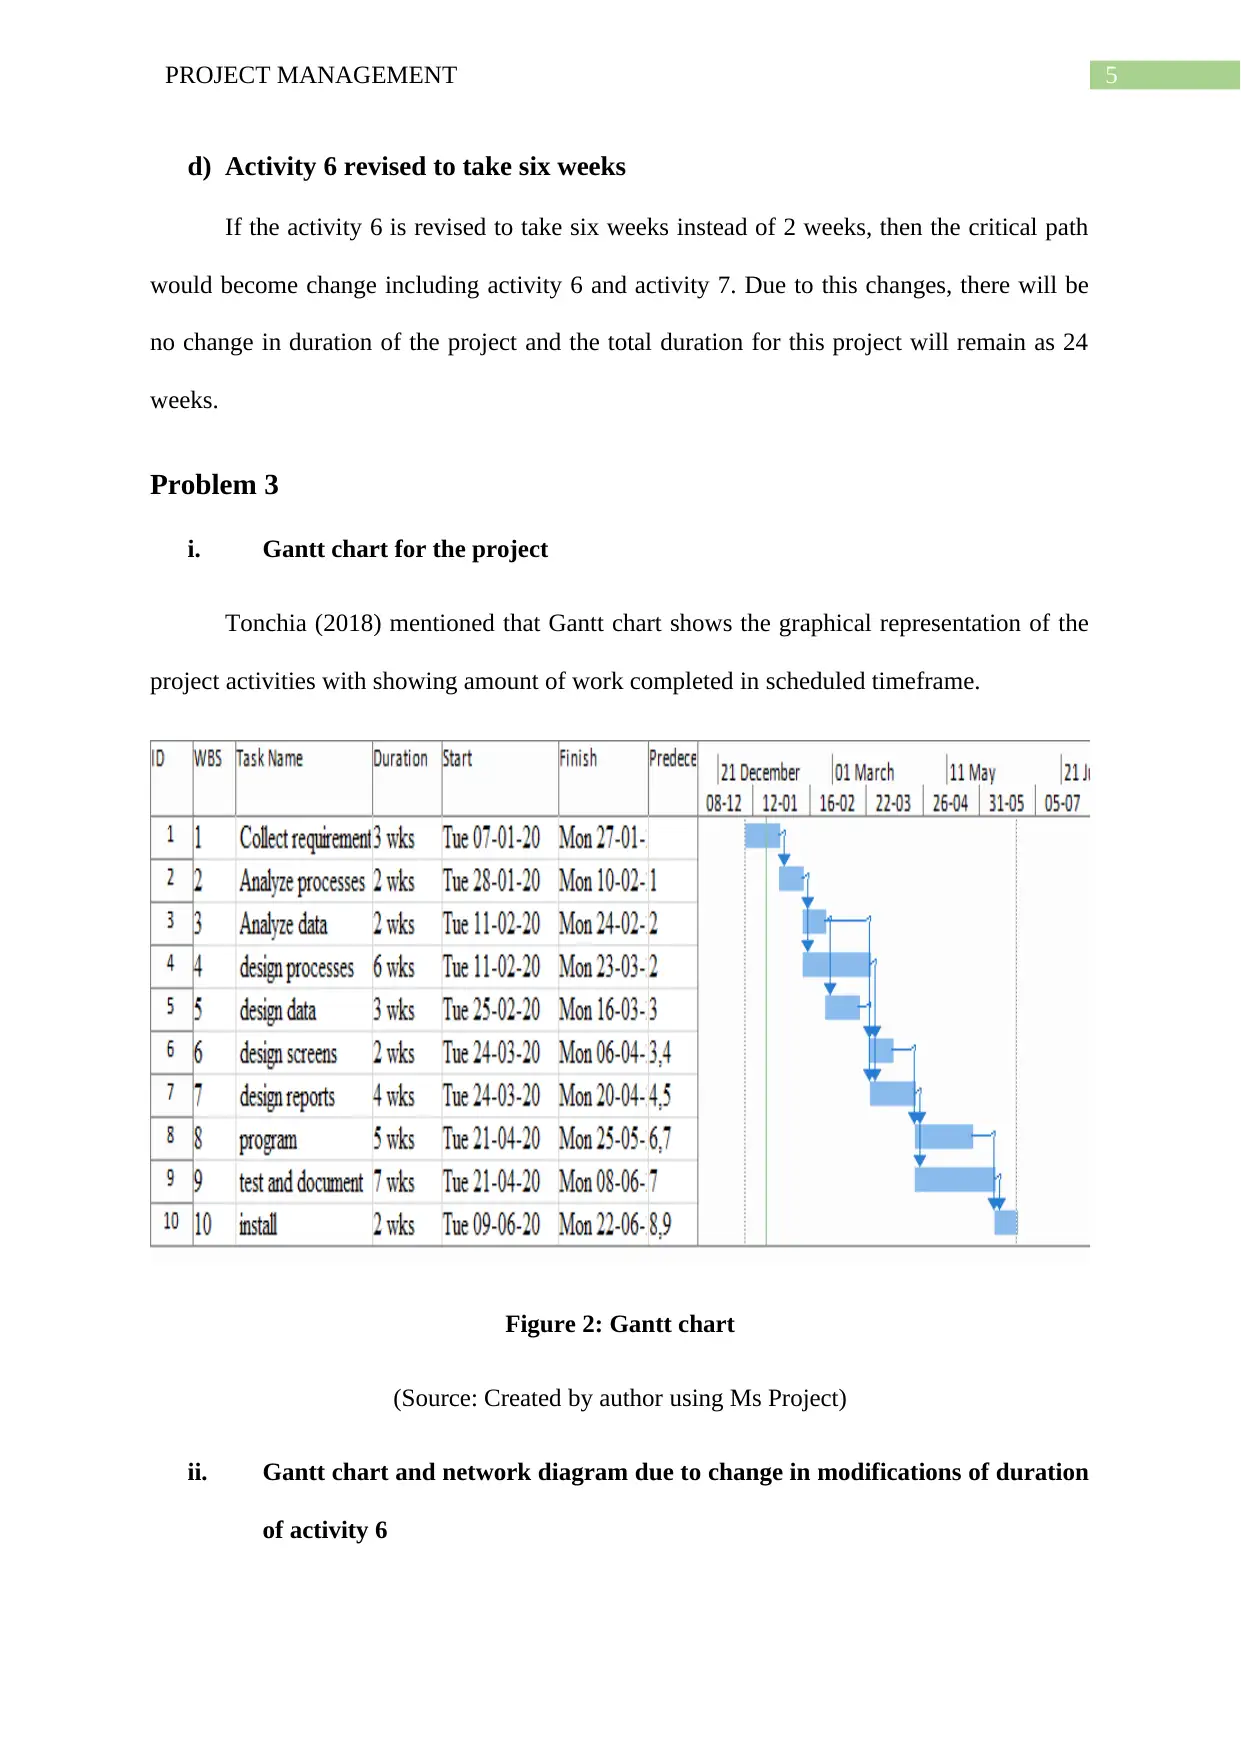
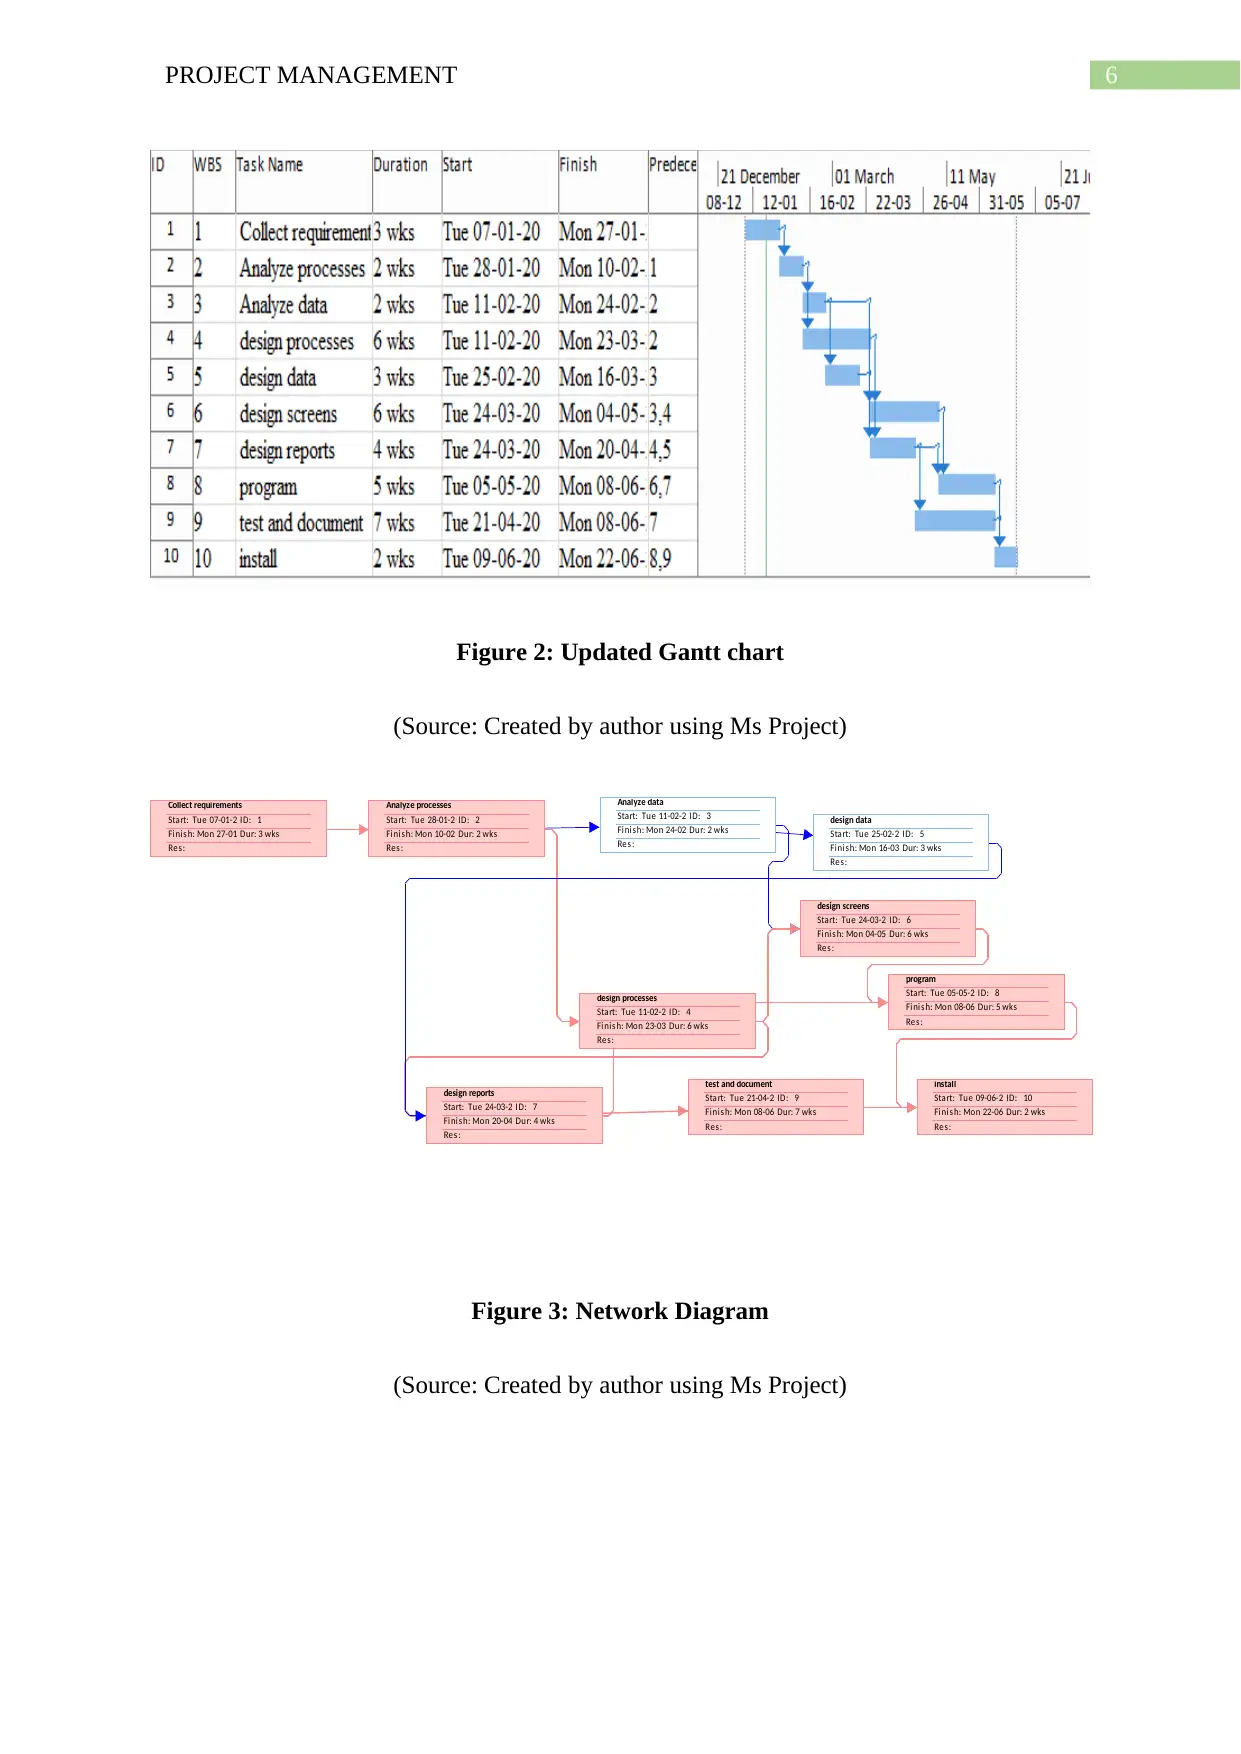
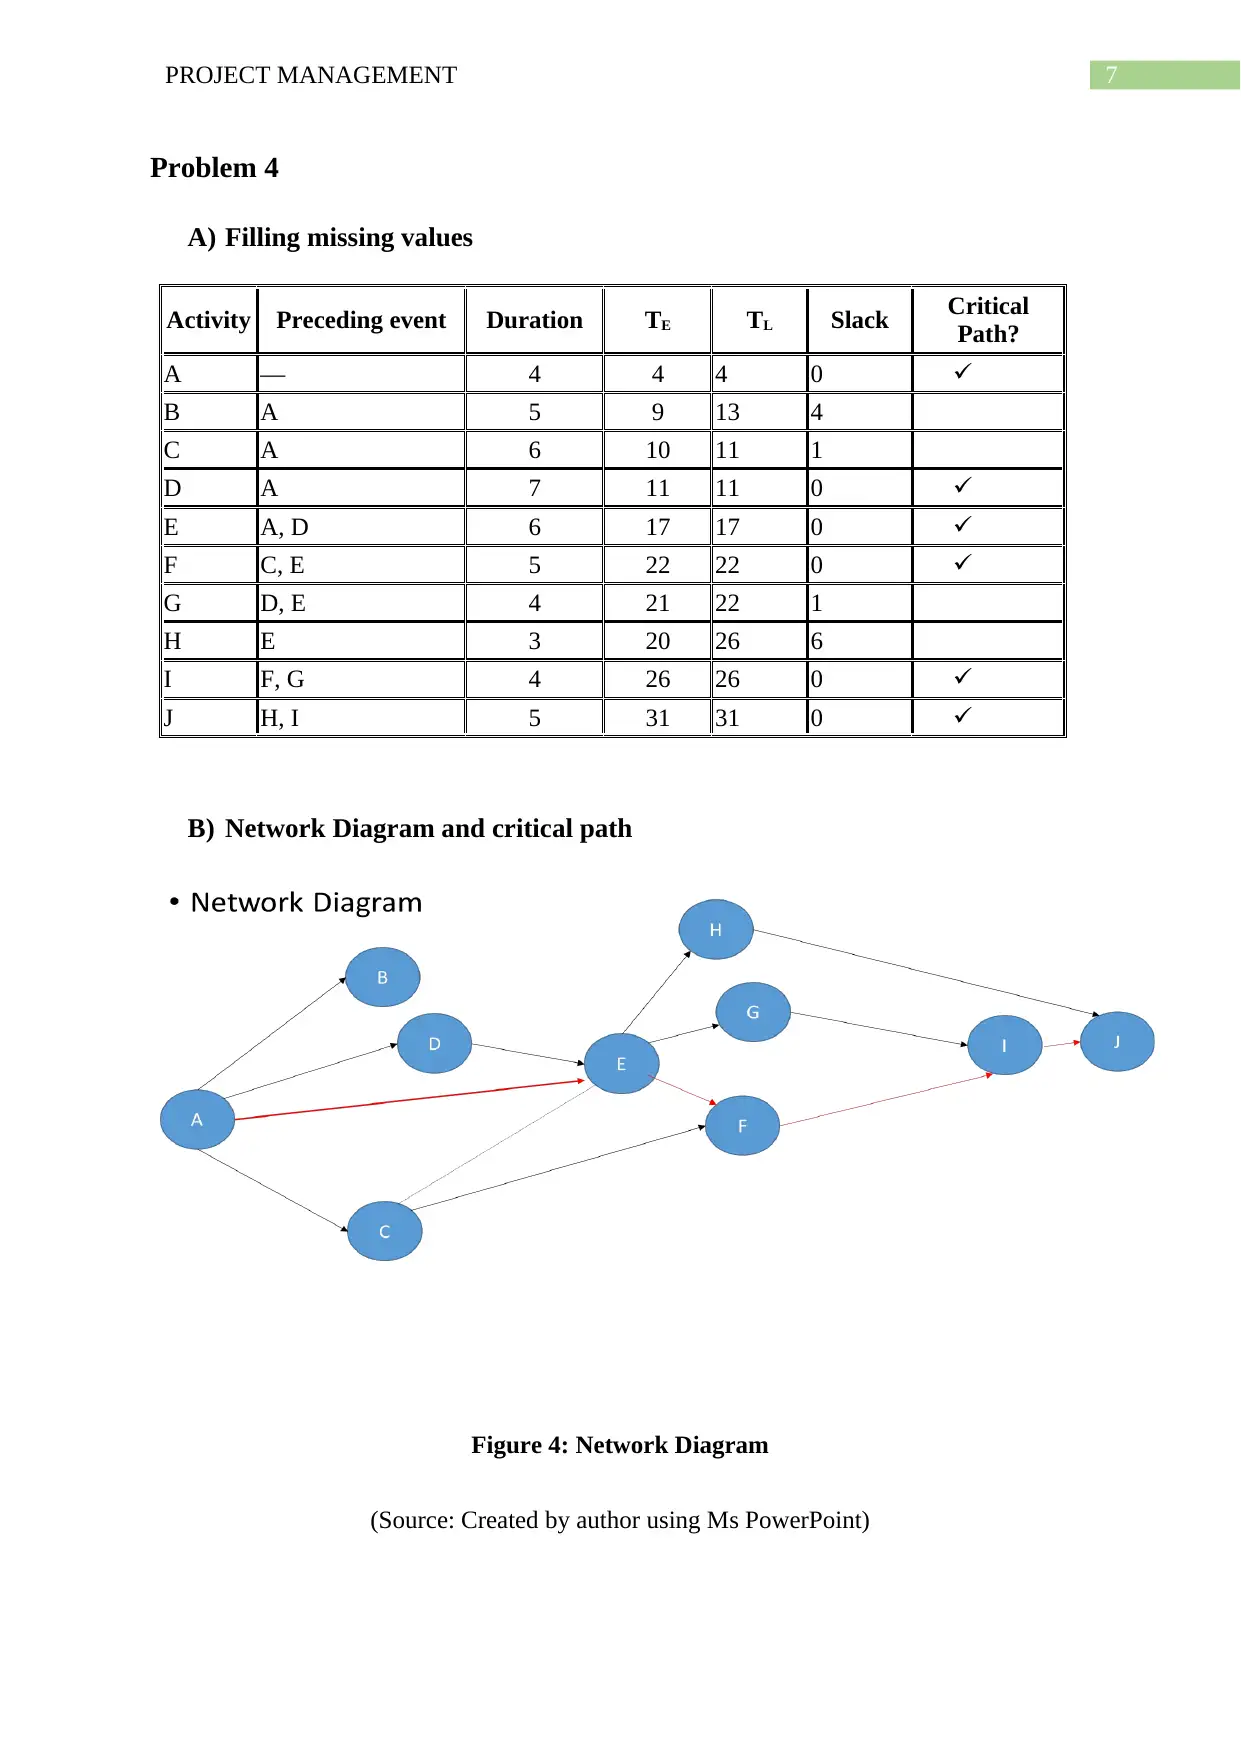
This document presents a comprehensive solution to a project management assignment. The solution encompasses various aspects of project management, including the calculation of expected time for project activities using formulas and tables, the creation and analysis of network diagrams to visualize project tasks, dependencies, and critical paths, and the determination of the earliest expected completion time. The solution also addresses the impact of changes in activity durations, such as revising activity 6 to take six weeks, and how these changes affect the critical path and project timeline. Furthermore, the assignment includes the development of Gantt charts to represent project activities and their schedules. The solution also involves filling in missing values in project tables and constructing network diagrams and critical paths for problem 4. The document references key project management concepts and methodologies, supported by relevant academic sources.
tabler-icon-diamond-filled.svg

Contribute Materials

Your contribution can guide someone’s learning journey. Share your documents today.
Document Page
Running head: PROJECT MANAGEMENT
Project Management
Name of the Student:
Name of the University:
tabler-icon-diamond-filled.svg

Secure Best Marks with AI Grader

Need help grading? Try our AI Grader for instant feedback on your assignments.
Document Page
1PROJECT MANAGEMENT
Table of Contents
Problem 1...................................................................................................................................2
Problem 2...................................................................................................................................3
a) Network Diagram............................................................................................................3
b) Earliest expected completion time...............................................................................3
c) Critical path.....................................................................................................................4
d) Activity 6 revised to take six weeks............................................................................5
Problem 3...................................................................................................................................5
Problem 4...................................................................................................................................7
A) Filling missing values..................................................................................................7
B) Network Diagram and critical path.............................................................................7
References..................................................................................................................................8
Document Page
2PROJECT MANAGEMENT
Problem 1
The expected time is calculated by using the formula:
Expected time = (Ot+ 4* Mt + Pt) / 6
Ot = Optimistic time
Mt = Most likely time
Pt = Pessimistic time
The below table shows the expected time for each of the activities:
Activity Optimistic
Time
Most Likely
Time
Pessimistic
Time Expected Time
A 4 7 10 7
B 6 8 11 8.16
C 3 6 7 5.67
D 5 7 12 7.5
E 1 5 8 4.83
Document Page
3PROJECT MANAGEMENT
Problem 2
a) Network Diagram
The network diagram shows the graphical representation of the project tasks, its
dependences as well as critical path of the project. It is mapping out the project structure of
network with various symbols in addition to line connections (Kerzner, 2018).
Figure 1: Network Diagram
(Source: Created by author using Ms PowerPoint)
b) Earliest expected completion time
The earliest expected completion time is the activity which shows the finishing time
of the project. It is equal to the earliest time which all the project activities are to be
completed (Lock, 2017).
tabler-icon-diamond-filled.svg

Secure Best Marks with AI Grader

Need help grading? Try our AI Grader for instant feedback on your assignments.
Document Page
4PROJECT MANAGEMENT
Activity Immediate activity Time
(weeks) Predecessors
Early start
time
Early
finish
time
1 Collect requirements 3 0 3
2 Analyze processes 2 1 3 5
3 Analyze data 2 2 5 7
4 design processes 6 2 5 11
5 design data 3 3 7 10
6 design screens 2 3,4 11 13
7 design reports 4 4,5 11 15
8 program 5 6,7 15 20
9 test and document 7 7 15 22
10 install 2 8,9 24 24
Therefore, the earliest expected completion time for the project is the earliest finish
time which is 24 weeks.
c) Critical path
It is defined as sequence of the project tasks which can sum of the longest duration of
the project (Soe & Htike, 2018). From the above network diagram, it is analyzed that there
are two critical path:
Critical path 1: 1-2-3-5-7-8-10
= (3+2+2+3+4+5+2) weeks = 21 weeks
Critical path 2: 1-2-4-7-9-10
= (3+2+6+4+7+2) = 24 weeks
Among this two critical path, the longest path is critical path 2, therefore it is
considered as critical path for this project with a duration of 24 weeks.
Document Page
5PROJECT MANAGEMENT
d) Activity 6 revised to take six weeks
If the activity 6 is revised to take six weeks instead of 2 weeks, then the critical path
would become change including activity 6 and activity 7. Due to this changes, there will be
no change in duration of the project and the total duration for this project will remain as 24
weeks.
Problem 3
i. Gantt chart for the project
Tonchia (2018) mentioned that Gantt chart shows the graphical representation of the
project activities with showing amount of work completed in scheduled timeframe.
Figure 2: Gantt chart
(Source: Created by author using Ms Project)
ii. Gantt chart and network diagram due to change in modifications of duration
of activity 6
Document Page
6PROJECT MANAGEMENT
Figure 2: Updated Gantt chart
(Source: Created by author using Ms Project)
Analyze processes
Sta rt: Tue 28-01-20ID: 2
Fi ni s h: Mon 10-02-20Dur: 2 wks
Res :
Analyze data
Start: Tue 11-02-20ID: 3
Fi ni s h: Mon 24-02-20Dur: 2 wks
Re s :
design data
Start: Tue 25-02-20ID: 5
Fi ni s h: Mon 16-03-20Dur: 3 wks
Re s :
design processes
Start: Tue 11-02-20ID: 4
Fi ni s h: Mon 23-03-20Dur: 6 wks
Re s :
design screens
Start: Tue 24-03-20ID: 6
Fi ni s h: Mon 04-05-20Dur: 6 wks
Re s :
design reports
Start: Tue 24-03-20ID: 7
Fi ni s h: Mon 20-04-20Dur: 4 wks
Re s :
test and document
Sta rt: Tue 21-04-20ID: 9
Fi ni s h: Mon 08-06-20Dur: 7 wks
Res :
Collect requirements
Start: Tue 07-01-20ID: 1
Fi ni s h: Mon 27-01-20Dur: 3 wks
Re s :
install
Sta rt: Tue 09-06-20ID: 10
Fi ni s h: Mon 22-06-20Dur: 2 wks
Res :
program
Start: Tue 05-05-20ID: 8
Fi ni s h: Mon 08-06-20Dur: 5 wks
Re s :
Figure 3: Network Diagram
(Source: Created by author using Ms Project)
tabler-icon-diamond-filled.svg

Paraphrase This Document

Need a fresh take? Get an instant paraphrase of this document with our AI Paraphraser
Document Page
7PROJECT MANAGEMENT
Problem 4
A) Filling missing values
Activity Preceding event Duration TE TL Slack Critical
Path?
A 4 4 4 0
B A 5 9 13 4
C A 6 10 11 1
D A 7 11 11 0
E A, D 6 17 17 0
F C, E 5 22 22 0
G D, E 4 21 22 1
H E 3 20 26 6
I F, G 4 26 26 0
J H, I 5 31 31 0
B) Network Diagram and critical path
Figure 4: Network Diagram
(Source: Created by author using Ms PowerPoint)
Document Page
8PROJECT MANAGEMENT
References
Kerzner, H. (2018). Project management best practices: Achieving global excellence. John
Wiley & Sons.
Lock, D. (2017). The essentials of project management. Routledge.
Soe, P. H., & Htike, T. M. (2018). Critical path analysis programming method without
network diagram. In MATEC Web of Conferences (Vol. 192, p. 01027). EDP
Sciences.
Tonchia, S. (2018). Project Time Management. In Industrial Project Management (pp. 117-
129). Springer, Berlin, Heidelberg.
chevron_up_icon
1 out of 9
circle_padding
hide_on_mobile
zoom_out_icon
logo.png

Your All-in-One AI-Powered Toolkit for Academic Success.

Available 24*7 on WhatsApp / Email

[object Object]