Construction Project Management: Design, Evidence & Specifications
VerifiedAdded on 2023/03/31
|15
|1142
|105
Project
AI Summary
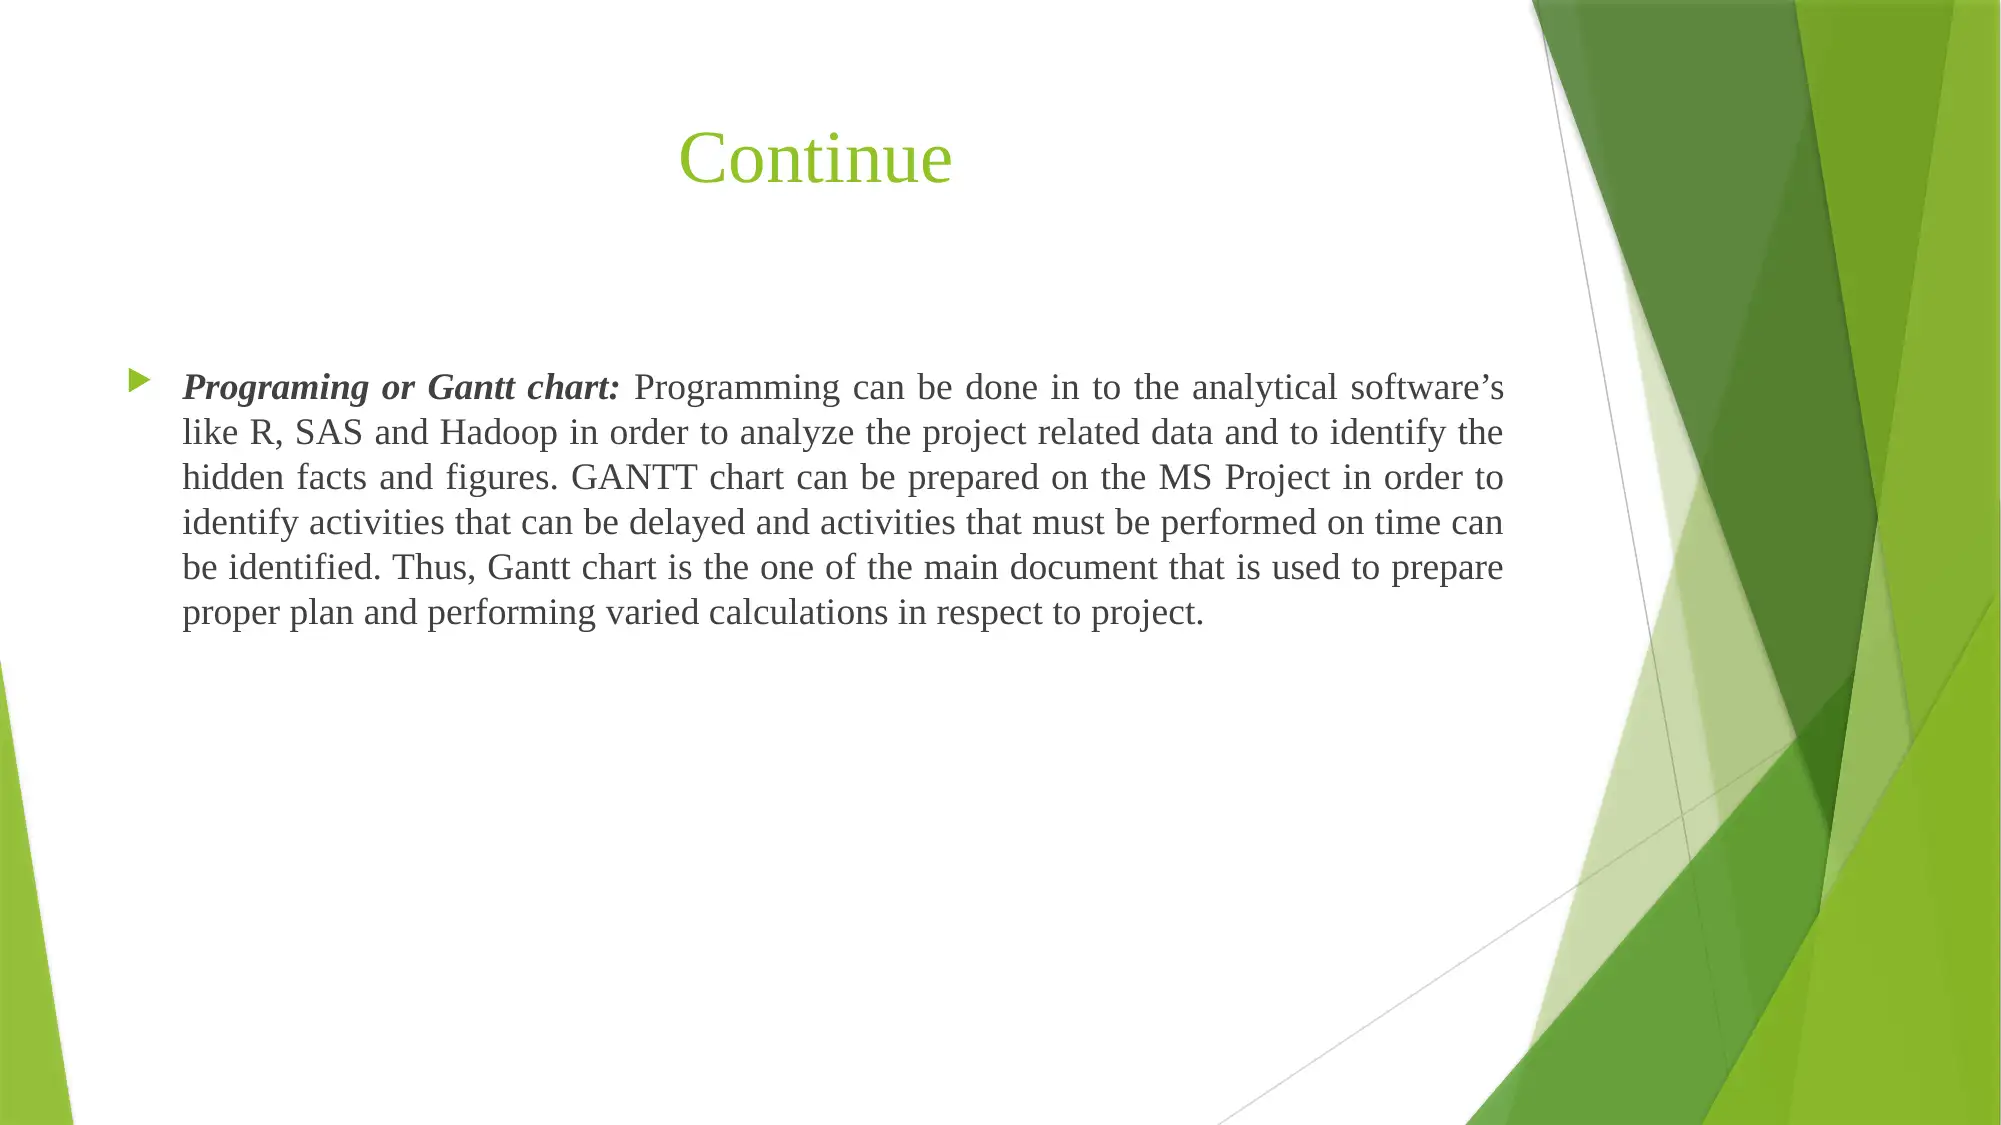
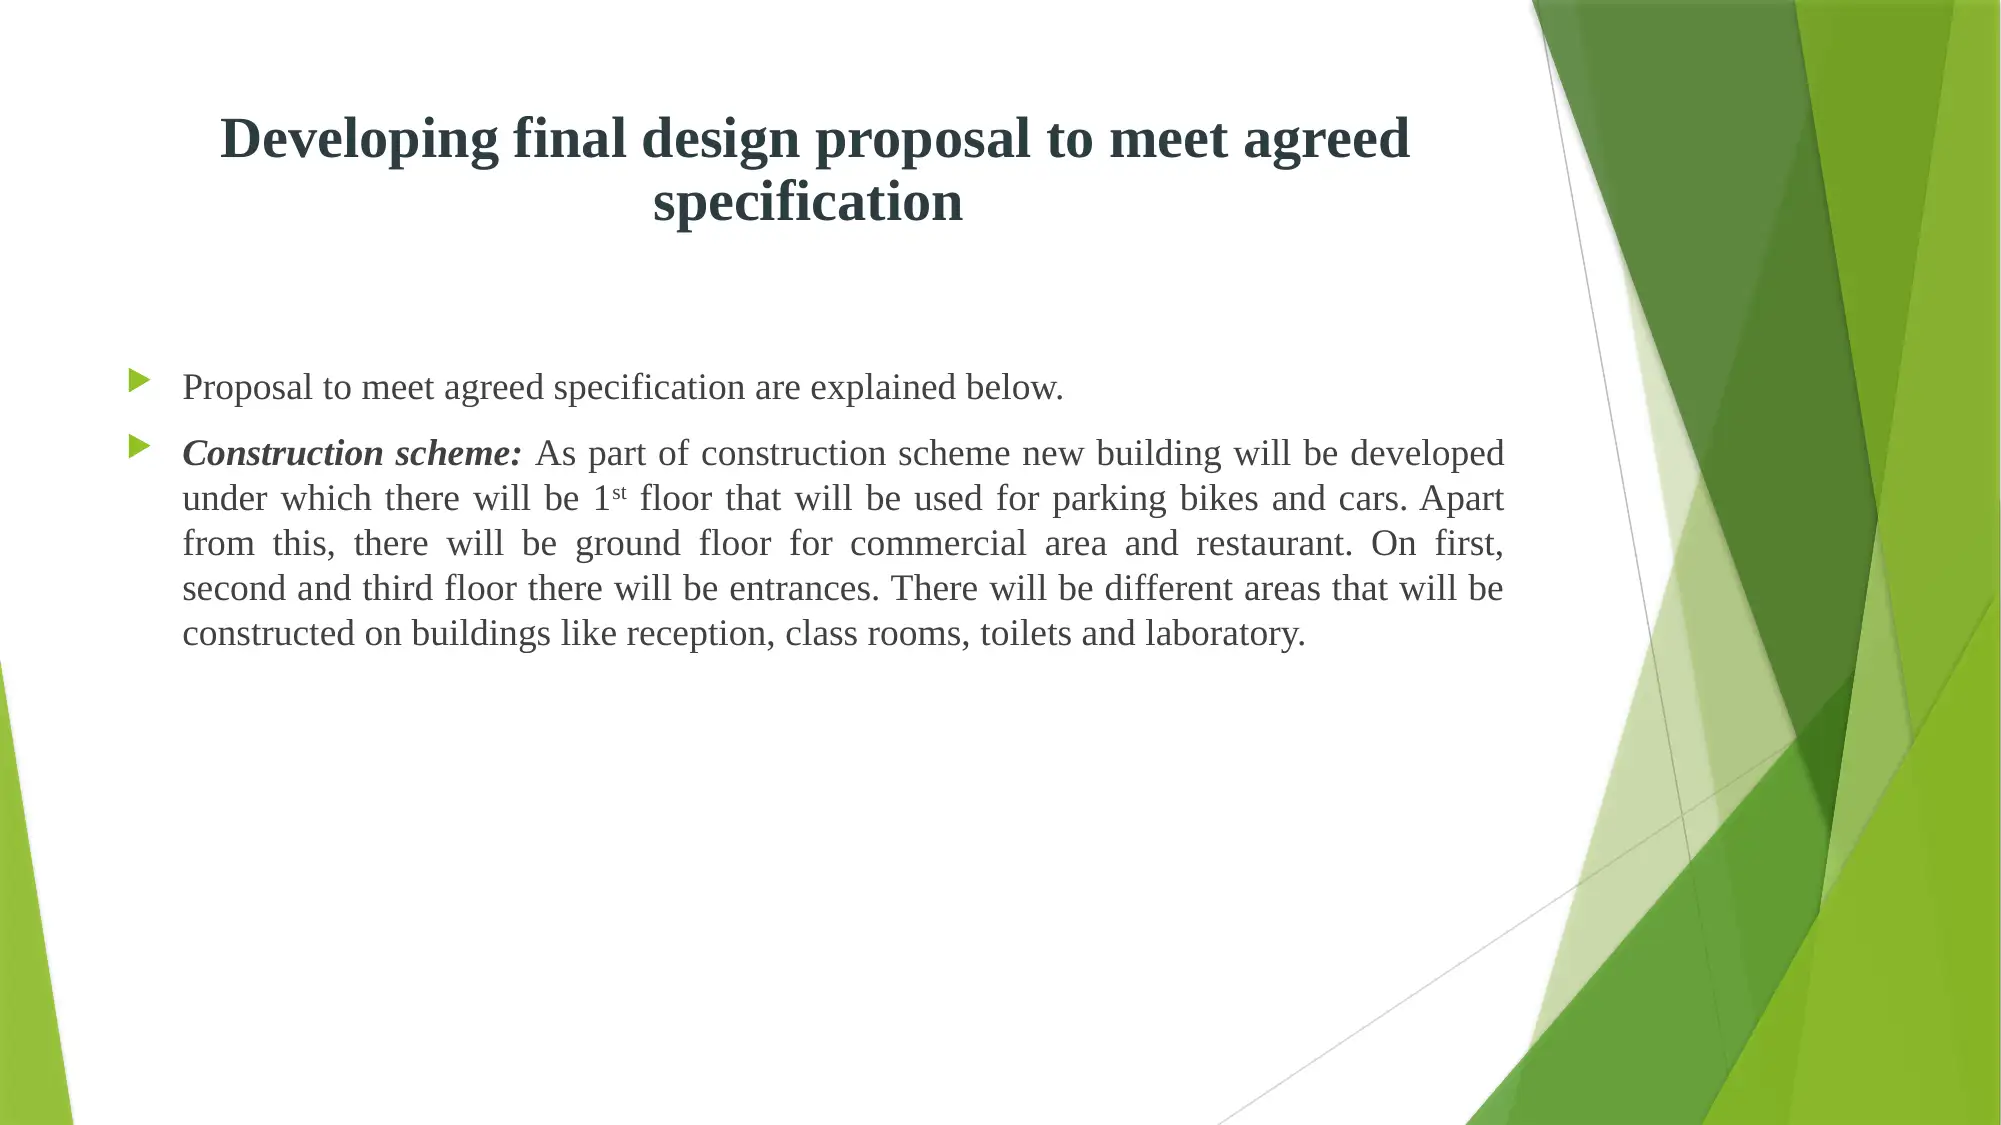
This document provides a comprehensive overview of a construction project, detailing documentary evidence related to product development, including field data, geotechnical information, statistical data, drawings, calculations, costing information, risk assessment, and Gantt charts. It outlines a construction scheme with specific quality control procedures, emphasizing the use of statistical tools for risk management and coordination. The project employs software like Tableau and Excel simulation models for cost monitoring and risk assessment, highlighting the importance of mitigation strategies. References to relevant research articles are also included, enriching the understanding of project management principles in construction.

Project management
construction of building
Paraphrase This Document
Need a fresh take? Get an instant paraphrase of this document with our AI Paraphraser

Documentary evidence of product
development
In respect to the building of construction there are number of documentary
evidence that are given below.
 Field data: Field data is collected from the market and under this sample of specific
people is taken for the present research as sample units. Specific sampling method is
used in the present research study in order to take sample units from the population.
Field data in respect to construction industry is collected and analyzed in the present
research study.
 Geotechnical information: From the relevant database data related to geotechnical
information is gathered which is very useful in making decisions. There are number of
factors that need to be taken in to consideration in respect to construction site. Relevant
decisions are made on the basis of geotechnical information by the project manager.

Continue
 Statistical data: Through primary research varied sort of facts and figures are obtained
and same are analyzed by using statistical tools. These tools help project manager in
identifying the relationship that exist between different variables and on that basis
decisions are made by the project managers.
 Drawing and graphical displays: While operating project graphs were prepared in
order to track the development that happened in the project. In the software different
charts were prepared and same were aligned to each other in the dashboard. In this way
time to time tracking of project is done.
 Calculations: In respect to the construction site different calculations are performed
and in this way project is evaluated in systematic manner by the project manager.
Documentation on project in respect to calculations is done which ensured that
randomly decisions are not made in respect to construction of project.
⊘ This is a preview!⊘
Do you want full access?
Subscribe today to unlock all pages.

Trusted by 1+ million students worldwide

Continue
 Costing information: In the plan that is related to construction of project costing
related data is prepared that will be beard in different stages of project. This document
revealed the breakdown of the cost at different phase of the project. It can be said that
costing information is very important for making decisions.
 Risk assessment: There are different sort of risks that are associated with the current
project. Construction project is one of the project which is exposed to number of risks.
Some of the risks that are associated to the construction project are sudden plunge in
the price of raw materials or shortage of money. Apart from this, strike by labor or
death of any labor is the one of the risk that is associated with the current project.
Paraphrase This Document
Need a fresh take? Get an instant paraphrase of this document with our AI Paraphraser

Continue
 Programing or Gantt chart: Programming can be done in to the analytical software’s
like R, SAS and Hadoop in order to analyze the project related data and to identify the
hidden facts and figures. GANTT chart can be prepared on the MS Project in order to
identify activities that can be delayed and activities that must be performed on time can
be identified. Thus, Gantt chart is the one of the main document that is used to prepare
proper plan and performing varied calculations in respect to project.

Developing final design proposal to meet agreed
specification
 Proposal to meet agreed specification are explained below.
 Construction scheme: As part of construction scheme new building will be developed
under which there will be 1st floor that will be used for parking bikes and cars. Apart
from this, there will be ground floor for commercial area and restaurant. On first,
second and third floor there will be entrances. There will be different areas that will be
constructed on buildings like reception, class rooms, toilets and laboratory.
⊘ This is a preview!⊘
Do you want full access?
Subscribe today to unlock all pages.

Trusted by 1+ million students worldwide

Continue
 There is a specific quality control procedure that need to be followed in respect to the current
construction project. Under this, some of the statistical tools can be used by the project managers. Under
this statistical data tools can be applied on data set and on this basis relationship between different
variables can be identified.
 On the basis of calculated values appropriate decisions will be taken by the managers in terms of
formation of plan in respect to the current project. Quality control tools or relevant statistical methods
helps a lot firm to promote coordination at the workplace.
 This is because by applying statistical tools relationship among different variables is identified and
accordingly focus that needs to be given on the specific tasks is determined. Thus, coordinate promoted
in terms of performance of the business tasks.
 There are number of risks that are associated with the current project. It is the quality control method that
is used by the business managers to control risks in the business. By using quality control procedure
interrelationship between various things are identified and risks that are related to specific variable in the
projects are identified. It can be said that there is due importance of the quality control procedures for the
project managers.
Paraphrase This Document
Need a fresh take? Get an instant paraphrase of this document with our AI Paraphraser

Network diagram

Continue
⊘ This is a preview!⊘
Do you want full access?
Subscribe today to unlock all pages.

Trusted by 1+ million students worldwide

Continue
Paraphrase This Document
Need a fresh take? Get an instant paraphrase of this document with our AI Paraphraser

Continue

Solution for project
 As part of the risk management mechanism Tableau software and simulation models that are
built on excel will be used and close monitoring of cost will be done. Point where it is
identified that cost is increasing at rapid pace action will be taken.
 Apart from this, in the mentioned software cost that is incurred on specific activity or group
of activity will be identified. By using LOD functions in Tableau software granularity of data
will be done and it will be identified whether elevation in cost is within tolerable limit or not.
 In the software attractive charts can be prepared and by using IF statement and LOD
calculations like include, fixed and exclude in different manner impact that happened on cost
when considering multiple variables can be identified. It can be said that by doing so close
eye can be kept on the cost.
 Thus, relationship between different variables in terms of cost can be identified by using
Tableau software. In this way points were risk originate due to elevation in cost can be
identified and strict action can be taken to solve the problem.
⊘ This is a preview!⊘
Do you want full access?
Subscribe today to unlock all pages.

Trusted by 1+ million students worldwide
1 out of 15
Related Documents

Your All-in-One AI-Powered Toolkit for Academic Success.
+13062052269
info@desklib.com
Available 24*7 on WhatsApp / Email
Unlock your academic potential
Copyright © 2020–2025 A2Z Services. All Rights Reserved. Developed and managed by ZUCOL.


