Project Management: CPM, PERT, PDM, Crashing, and LOB

Verified

Added on  2020/04/21

|14
|1545
|76
Project
AI Summary
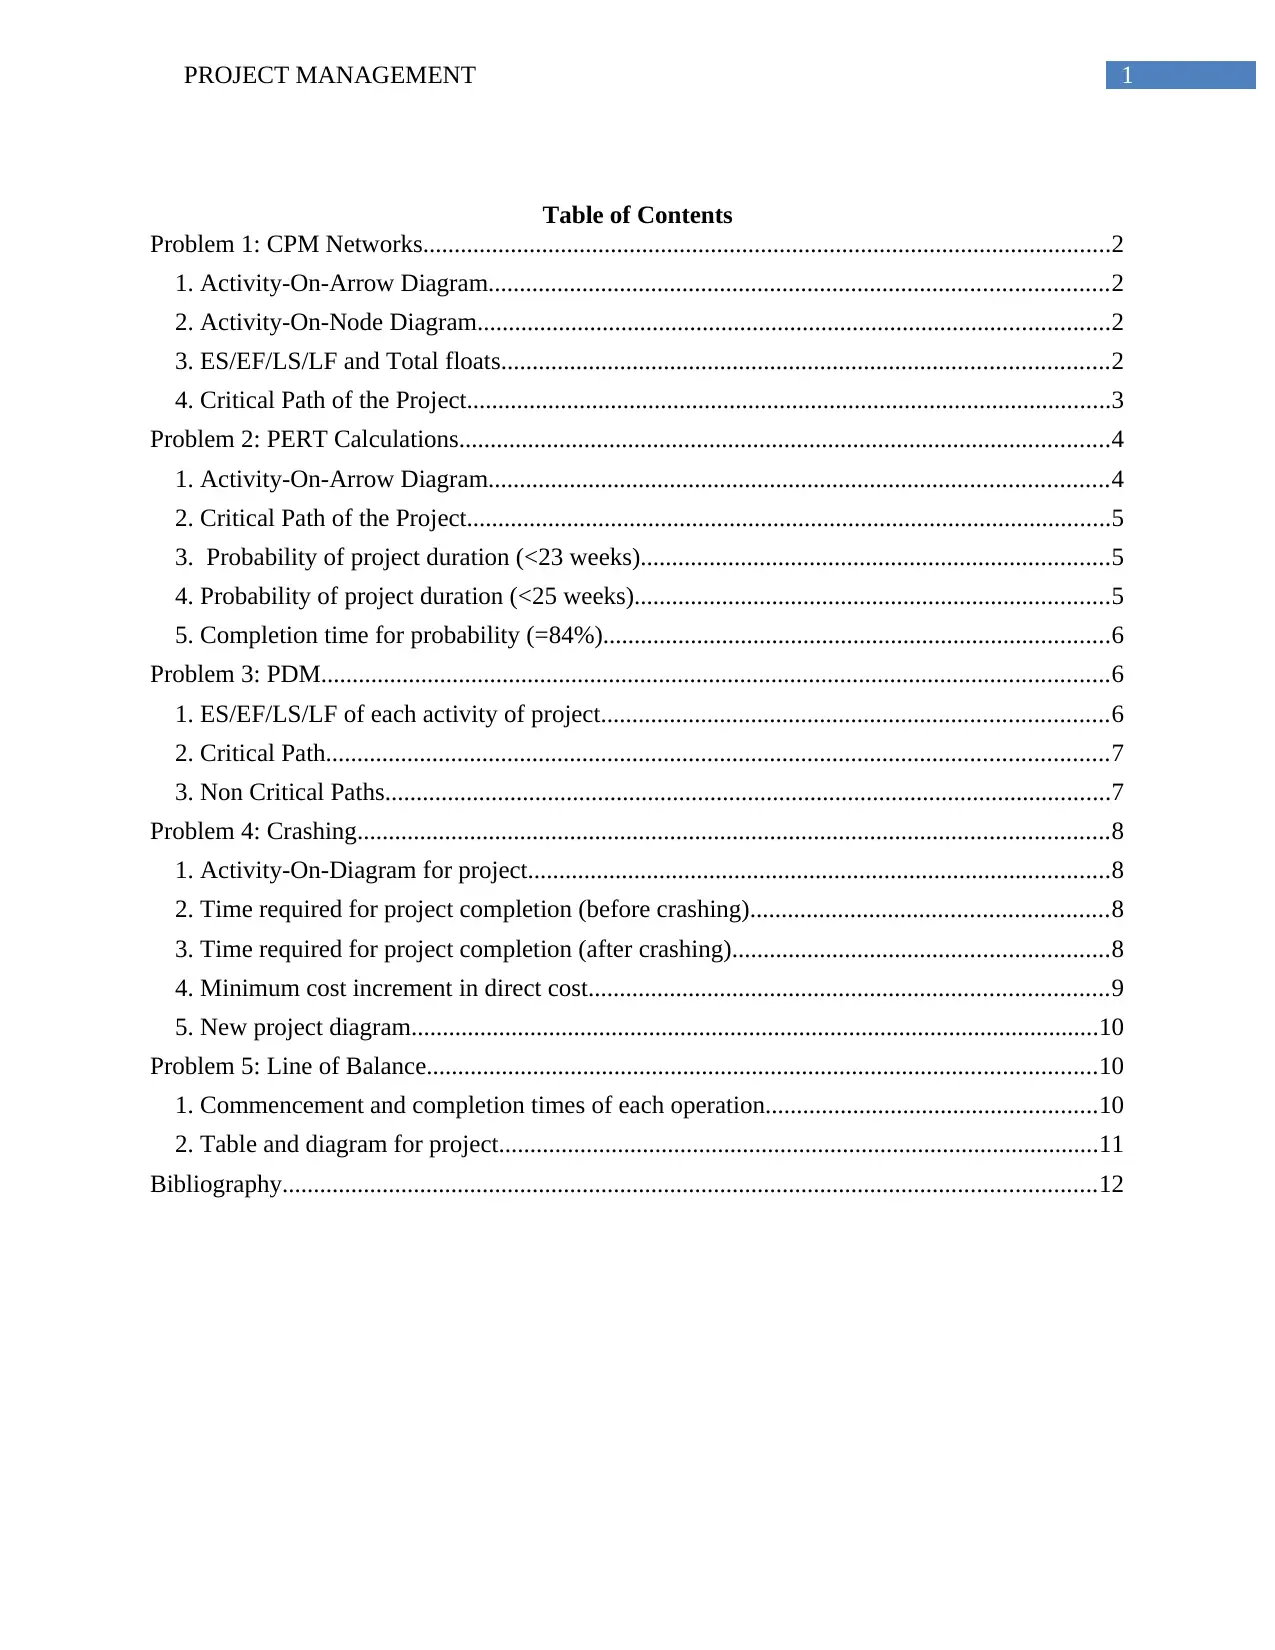
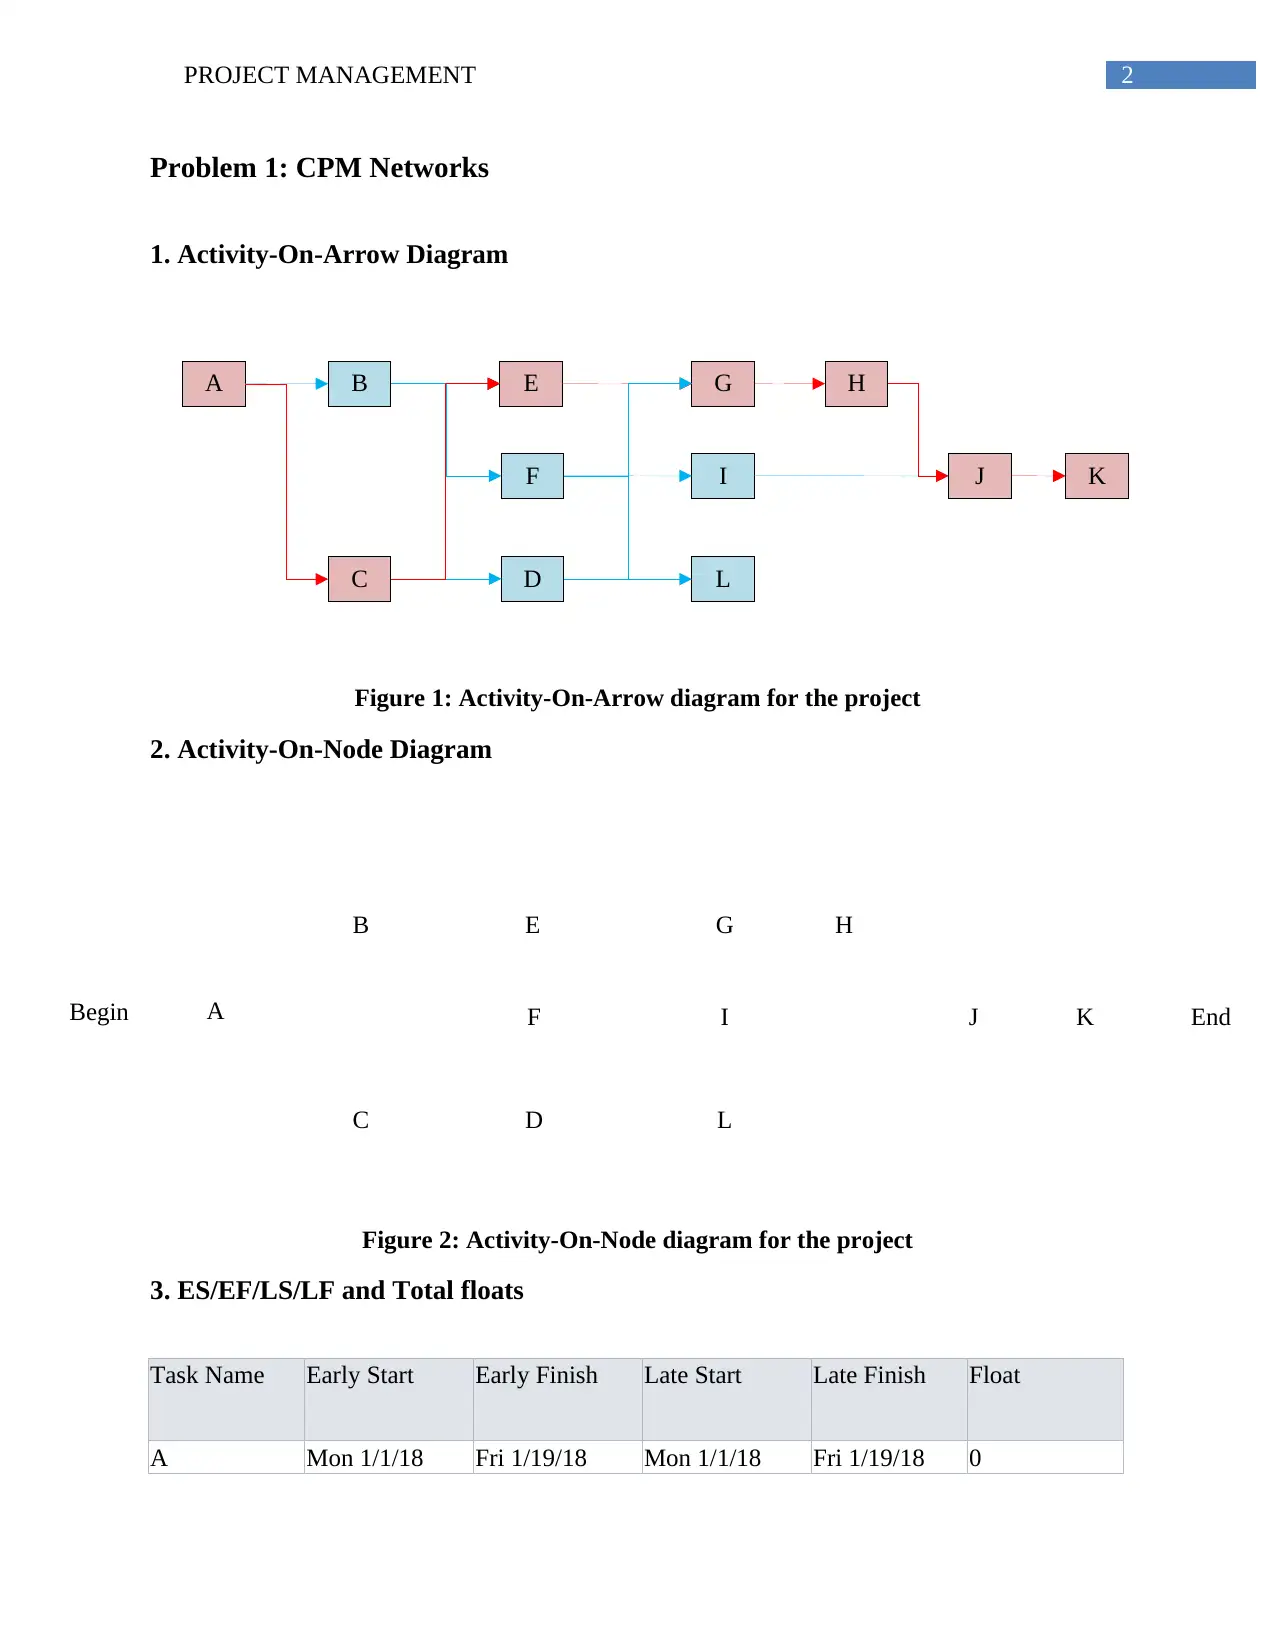
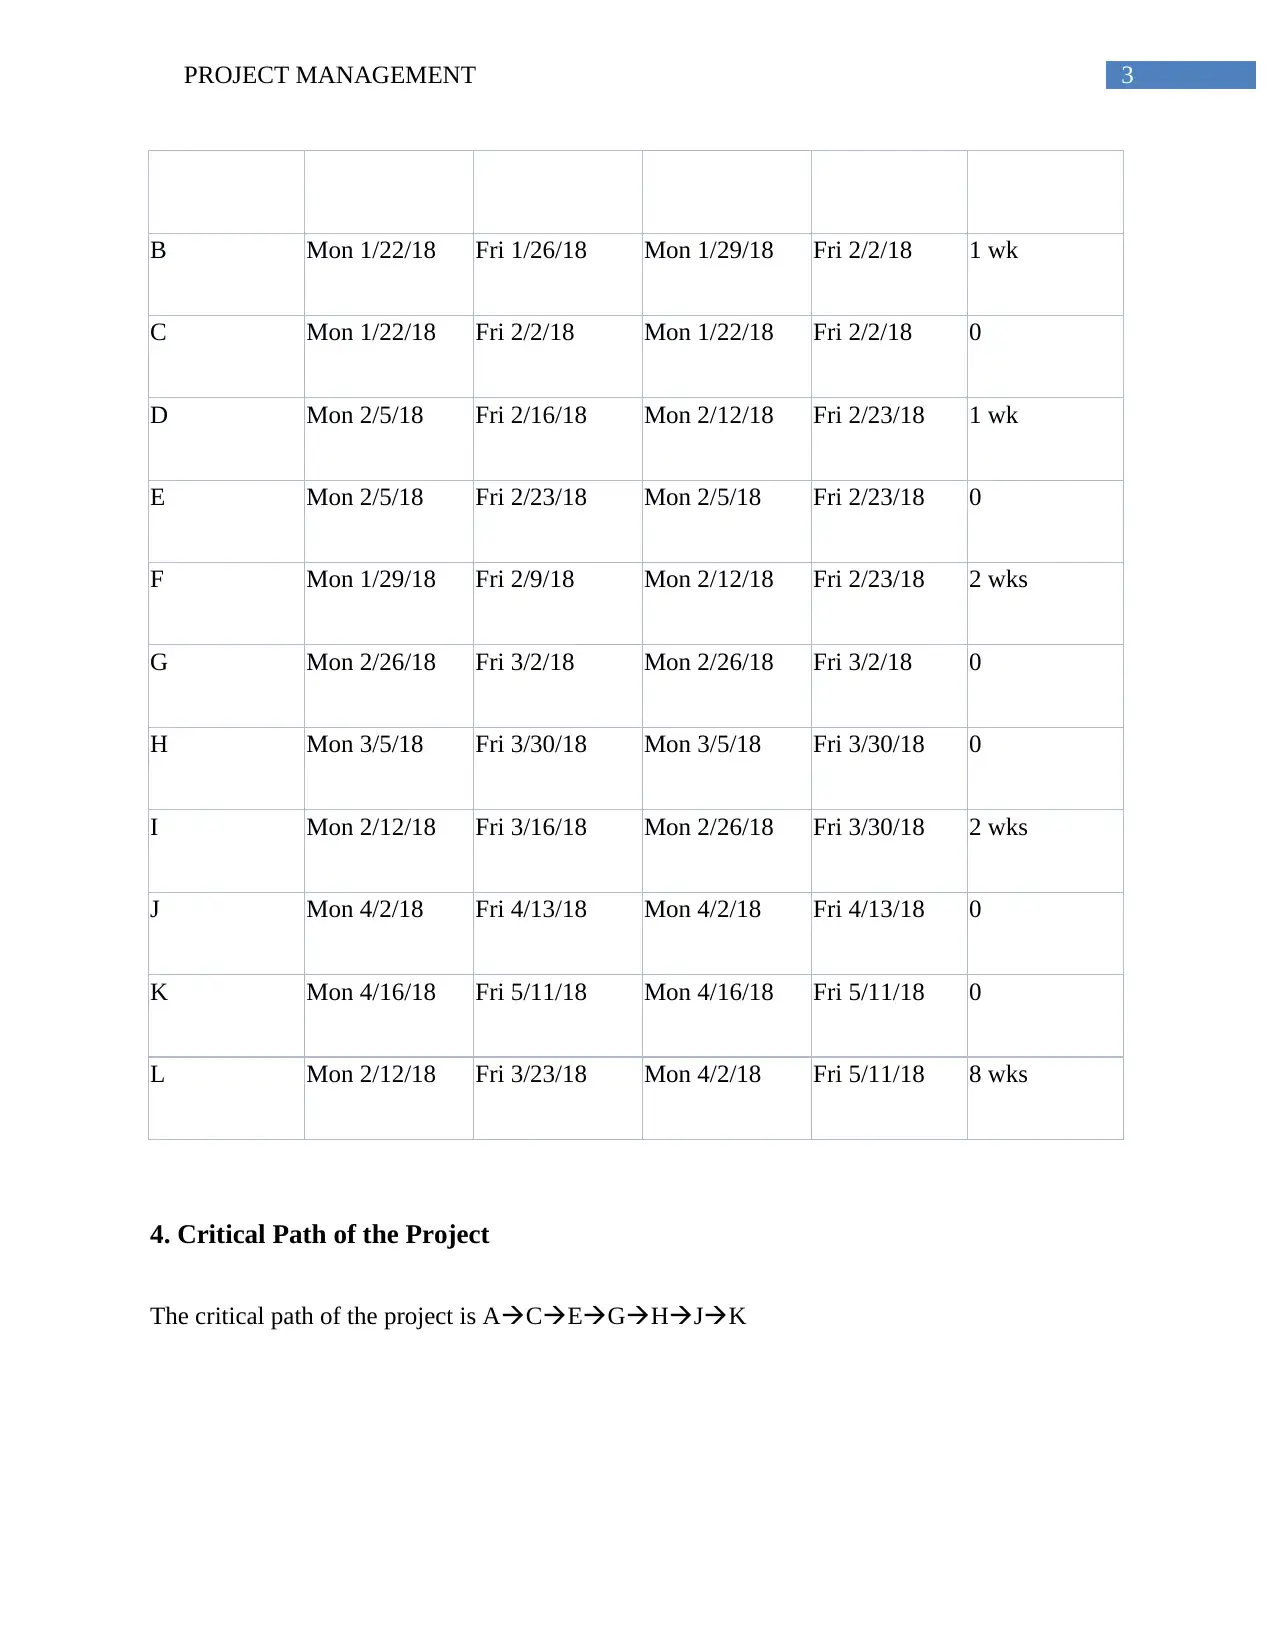
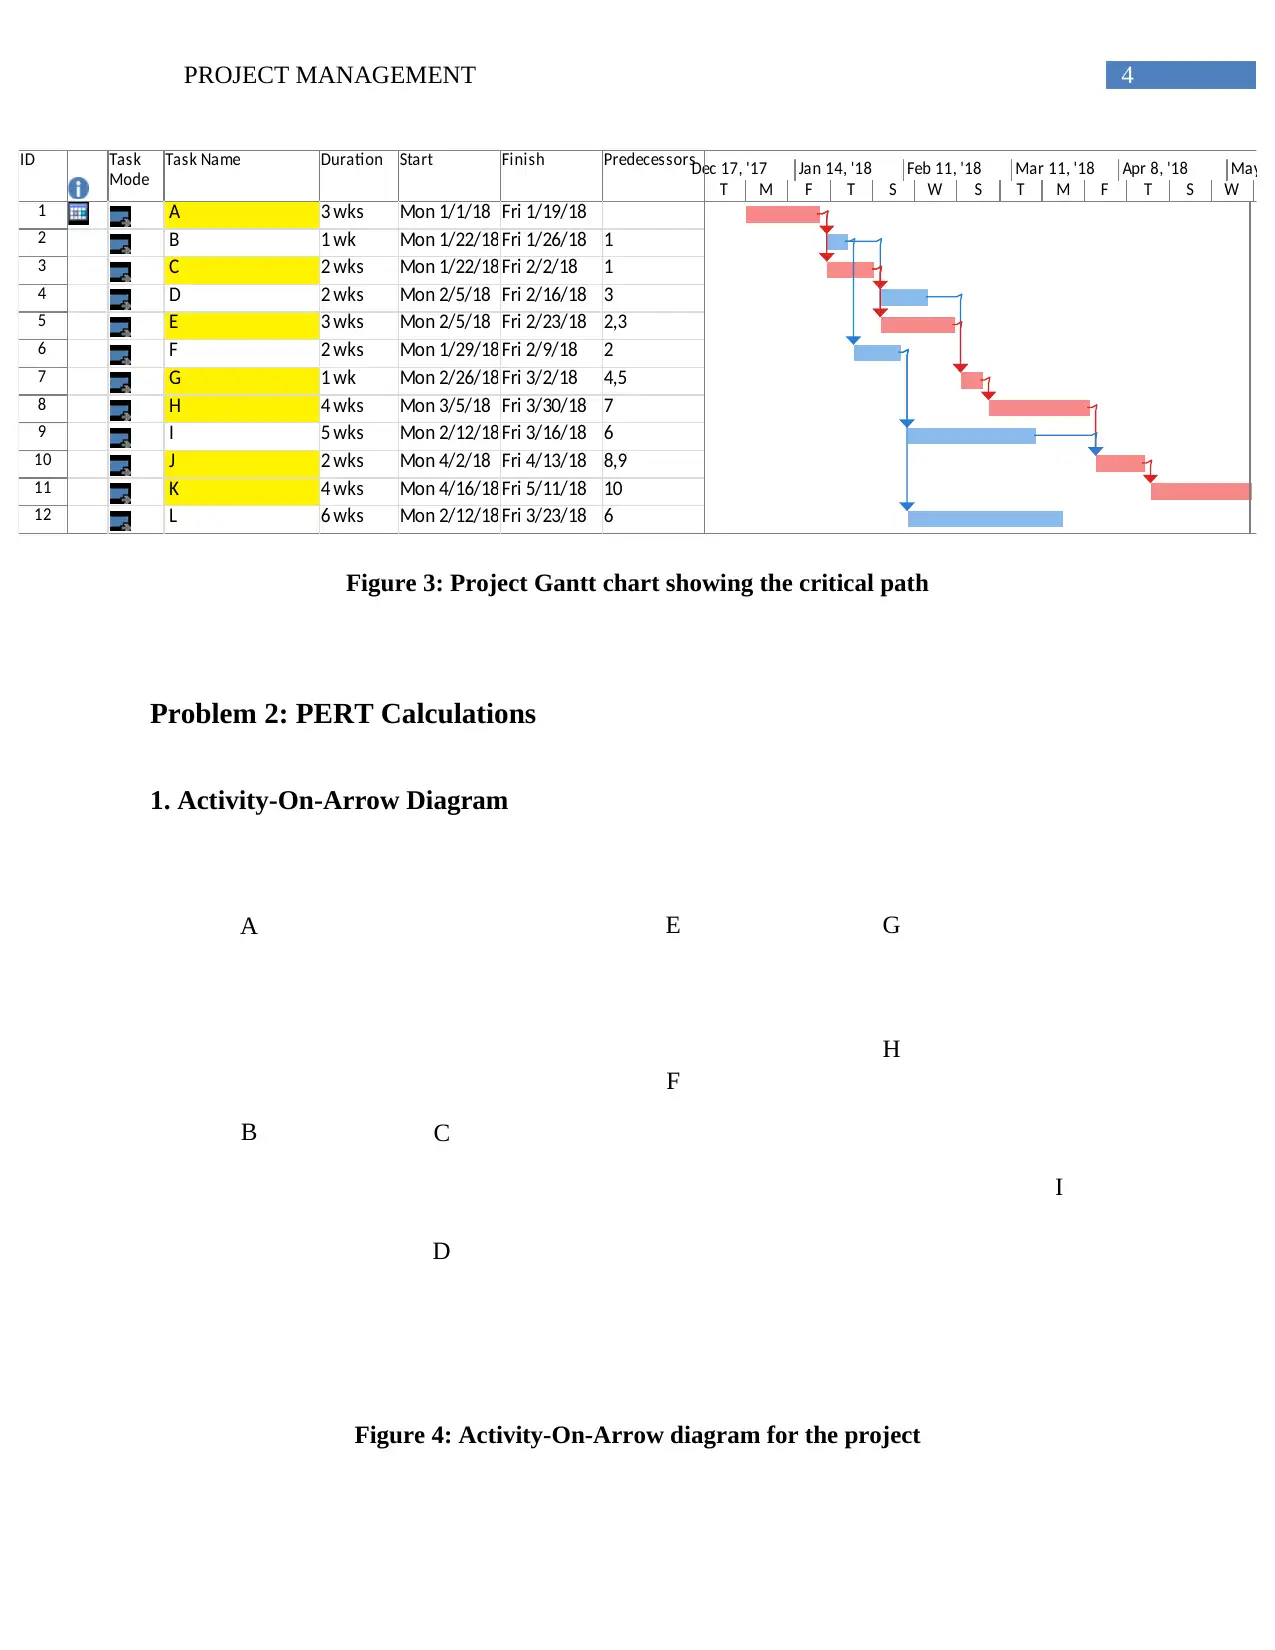
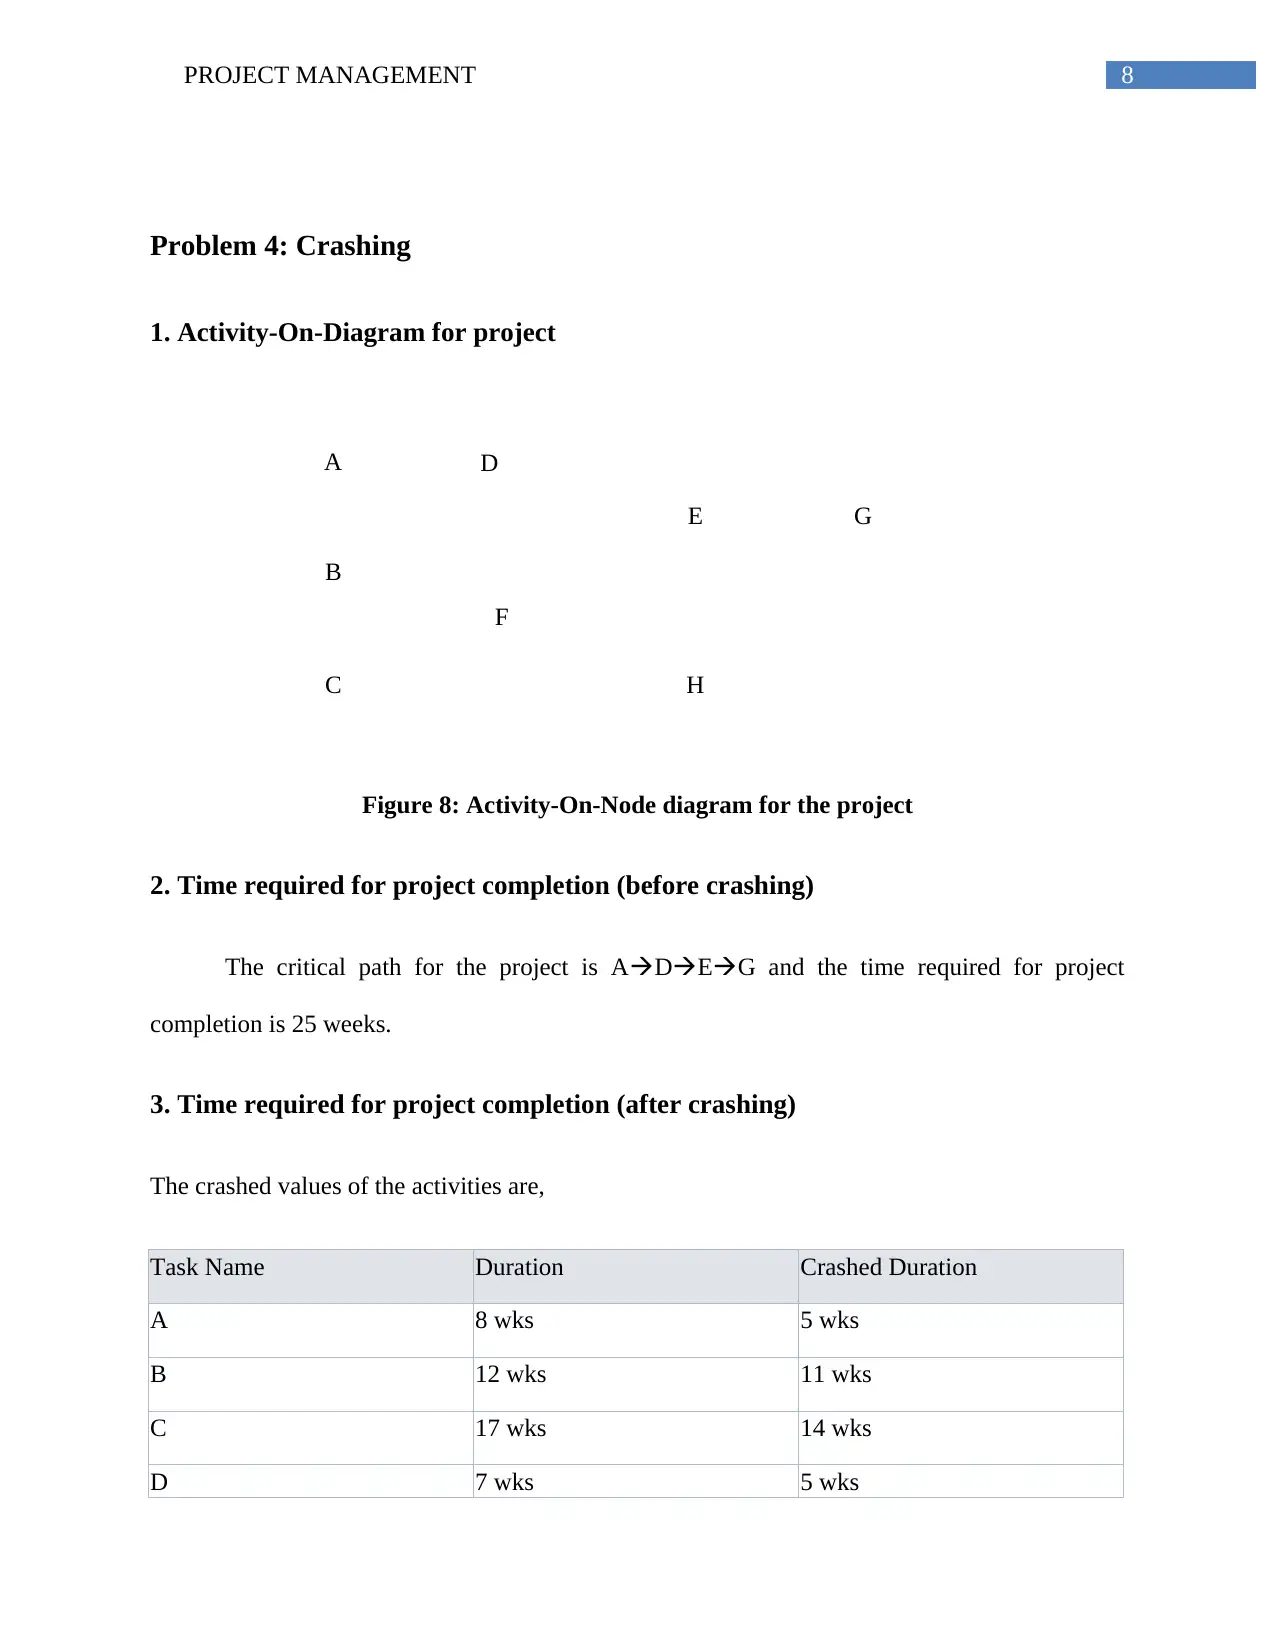
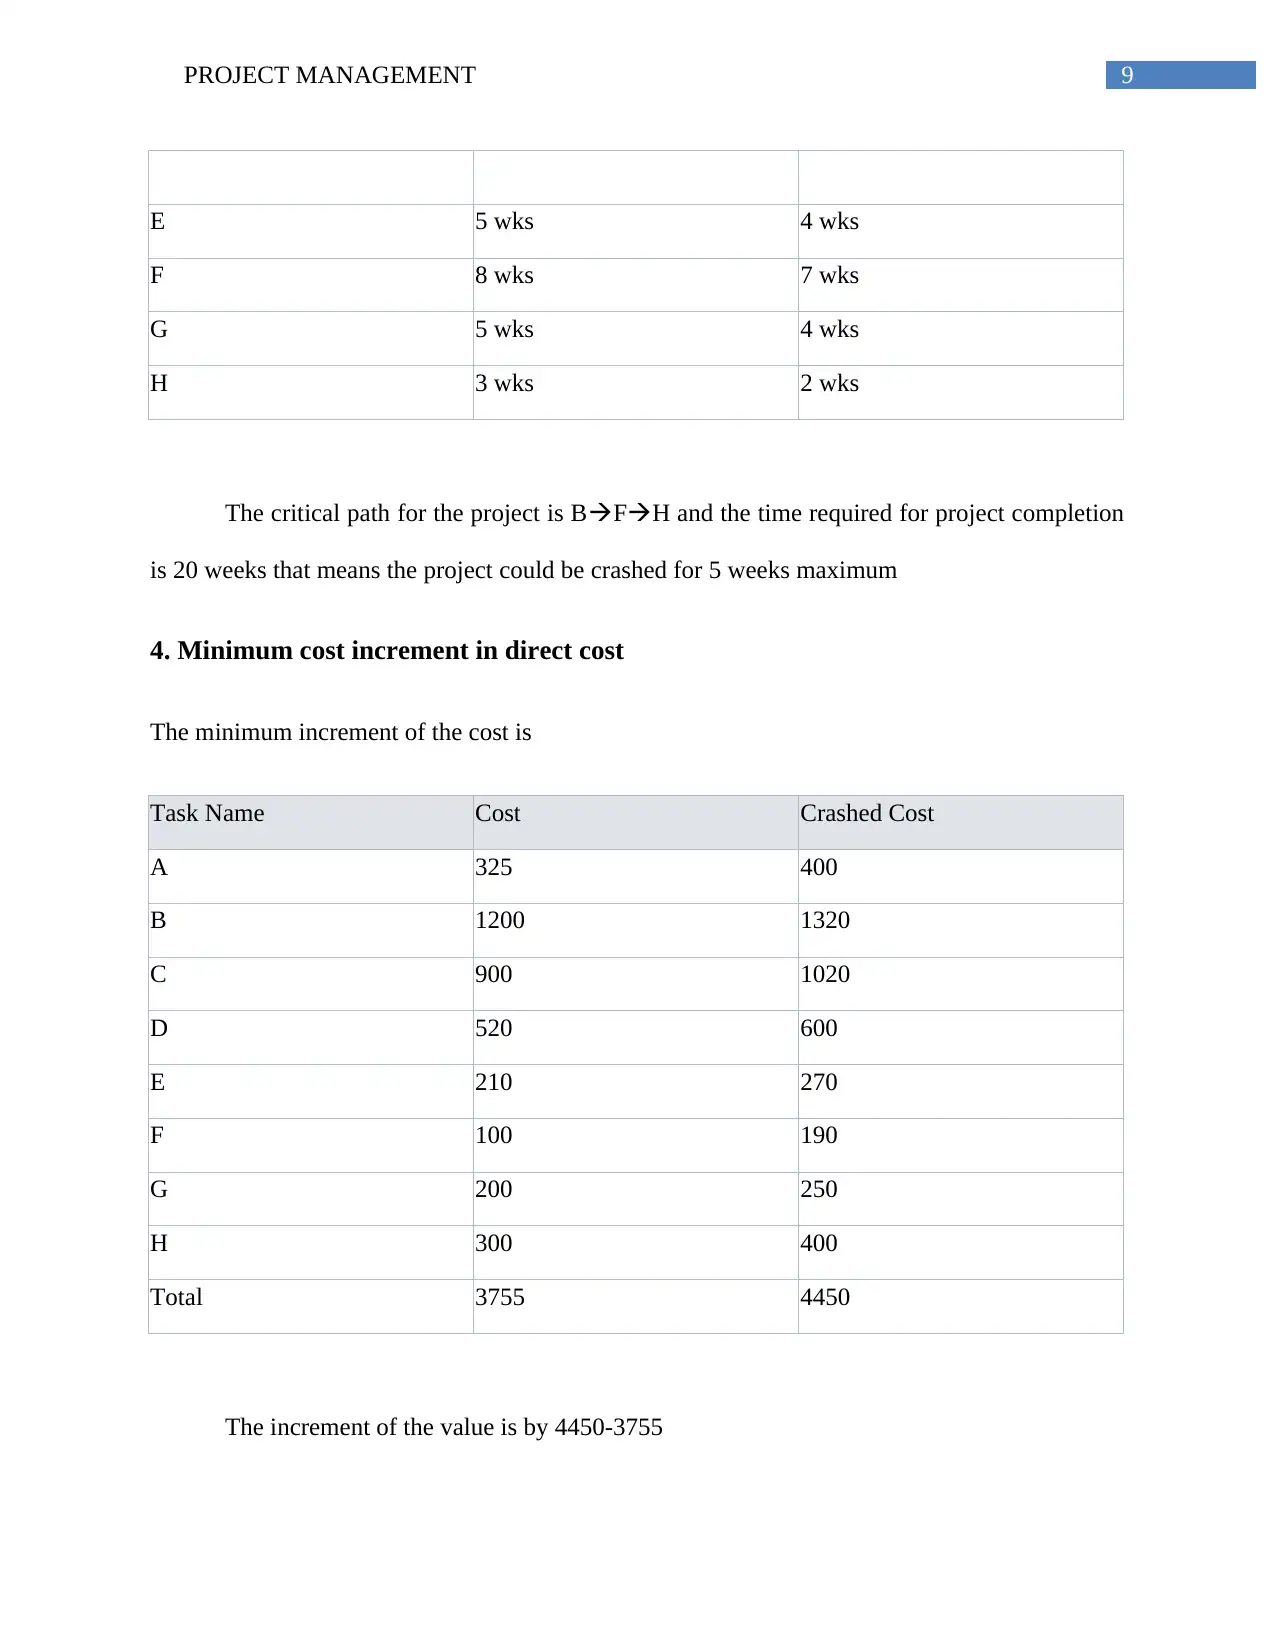
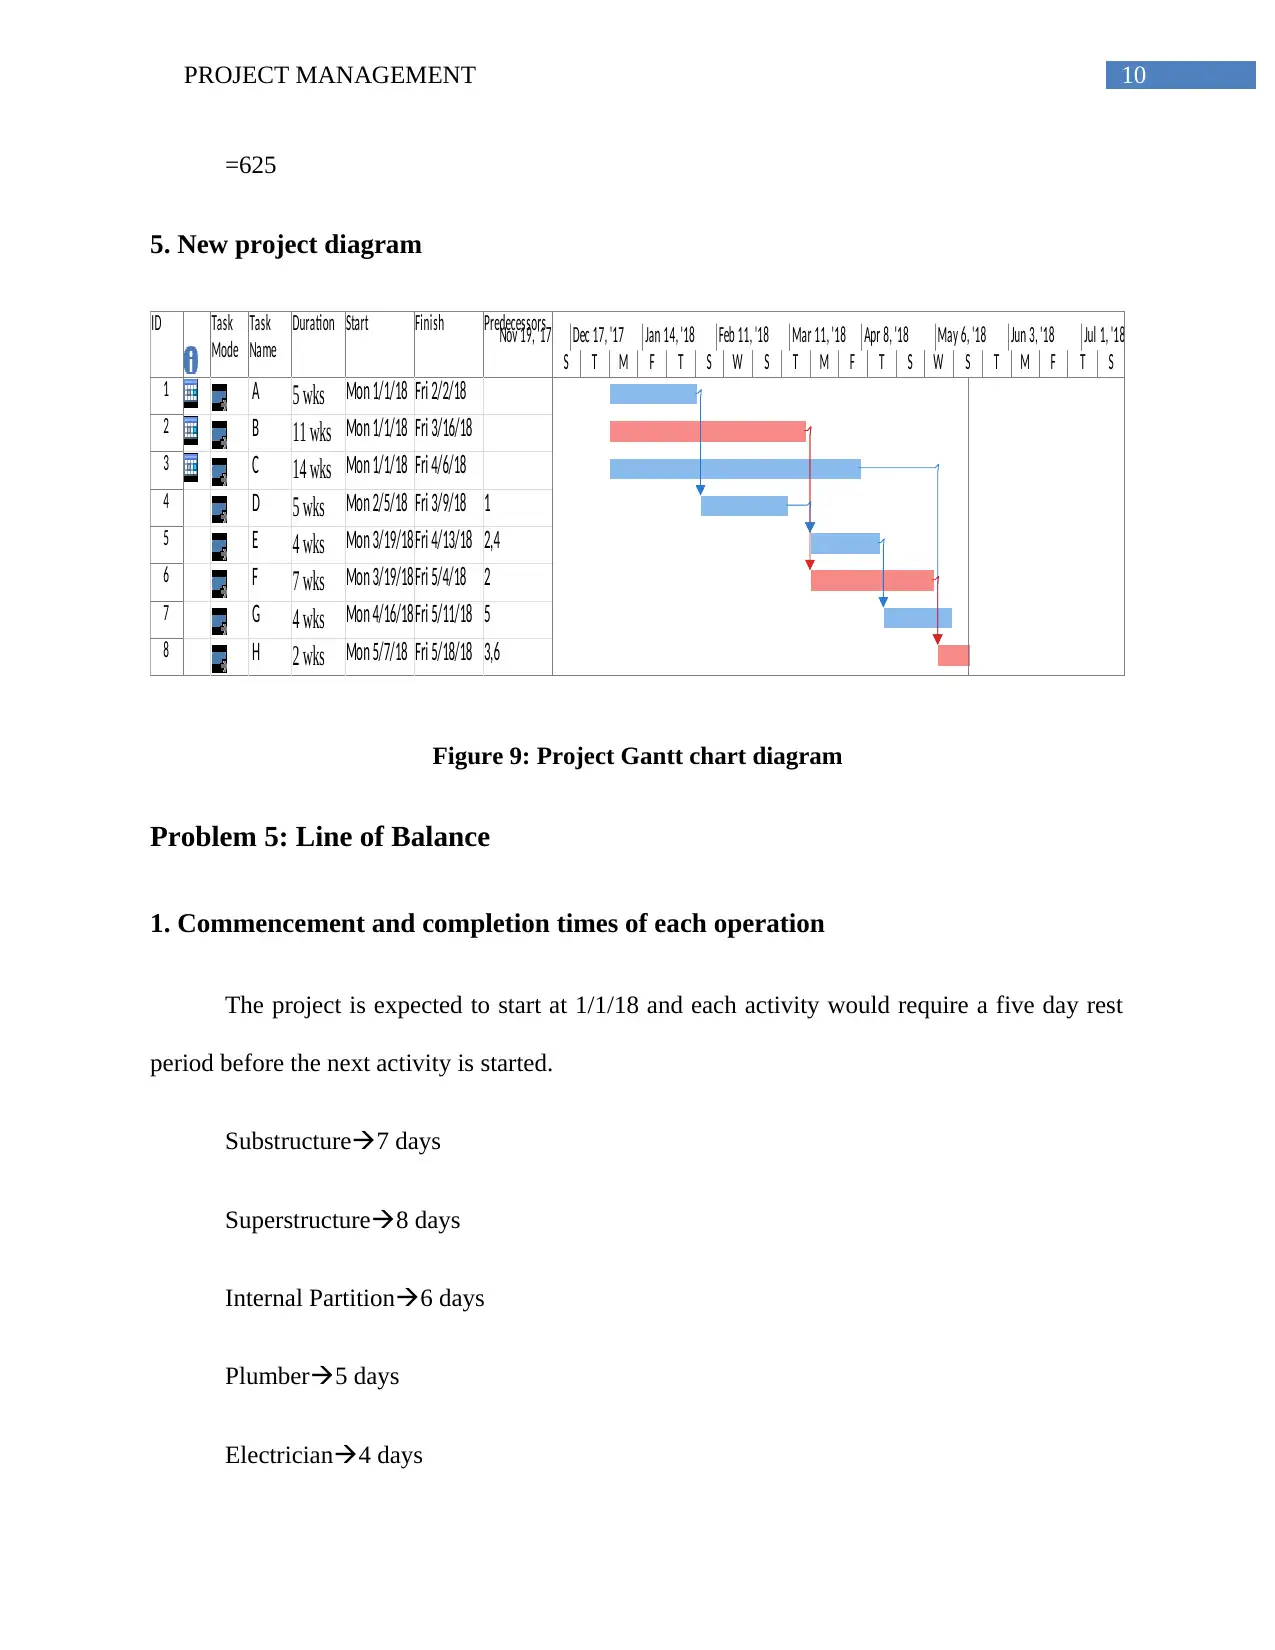
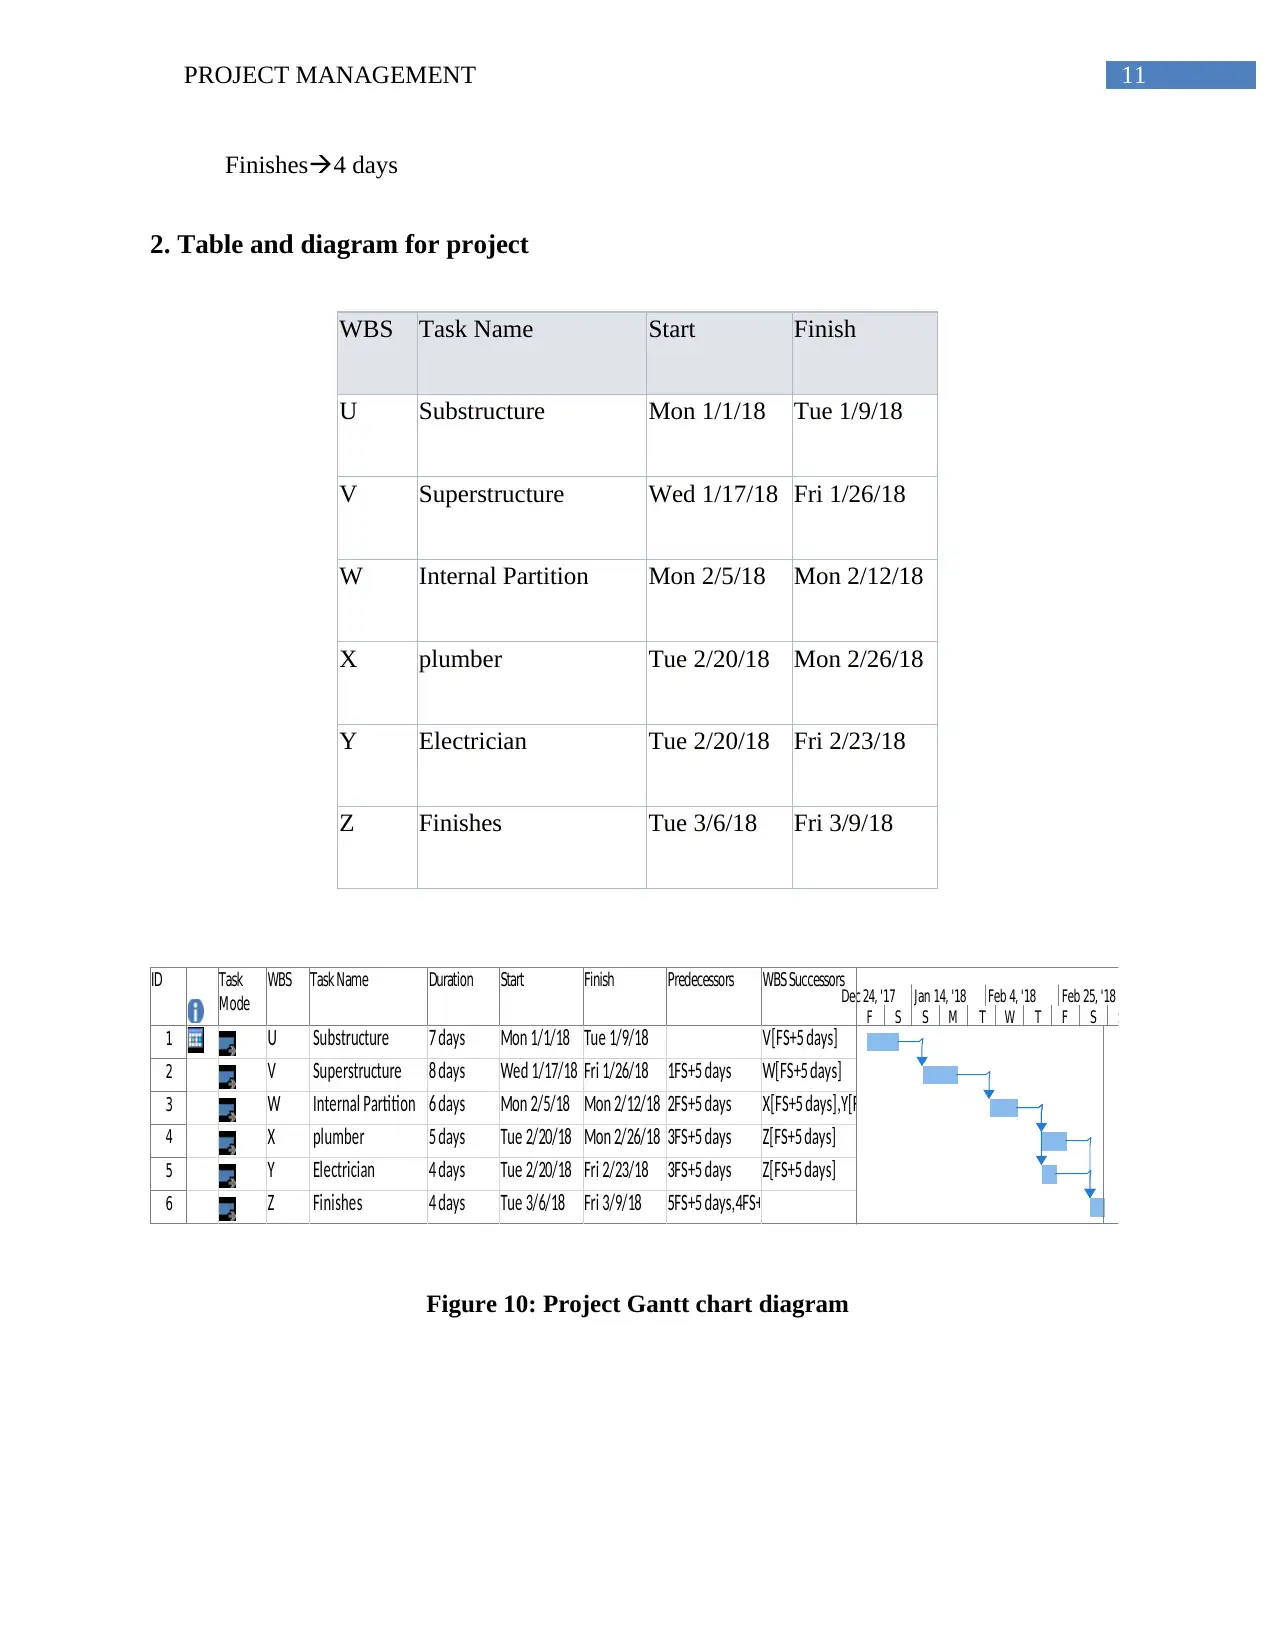
This project management assignment provides a comprehensive analysis of various project management techniques. It includes detailed solutions for Critical Path Method (CPM), Program Evaluation and Review Technique (PERT), Precedence Diagramming Method (PDM), project crashing, and Line of Balance (LOB). The assignment features activity-on-arrow and activity-on-node diagrams, calculations for early start/finish, late start/finish, and total floats. It also covers critical path identification, probability calculations for project duration, and cost analysis related to project crashing. The assignment concludes with a Line of Balance analysis, including commencement and completion times, tables, and diagrams. The document contains a bibliography of relevant project management resources.
Document Page
Running head: PROJECT MANAGEMENT
Project Management
Name of the Student:
Student ID:
Name of the University:
Author’s note:
tabler-icon-diamond-filled.svg

Paraphrase This Document

Need a fresh take? Get an instant paraphrase of this document with our AI Paraphraser
Document Page
1PROJECT MANAGEMENT
Table of Contents
Problem 1: CPM Networks..............................................................................................................2
1. Activity-On-Arrow Diagram...................................................................................................2
2. Activity-On-Node Diagram.....................................................................................................2
3. ES/EF/LS/LF and Total floats.................................................................................................2
4. Critical Path of the Project.......................................................................................................3
Problem 2: PERT Calculations........................................................................................................4
1. Activity-On-Arrow Diagram...................................................................................................4
2. Critical Path of the Project.......................................................................................................5
3. Probability of project duration (<23 weeks)...........................................................................5
4. Probability of project duration (<25 weeks)............................................................................5
5. Completion time for probability (=84%).................................................................................6
Problem 3: PDM..............................................................................................................................6
1. ES/EF/LS/LF of each activity of project.................................................................................6
2. Critical Path.............................................................................................................................7
3. Non Critical Paths....................................................................................................................7
Problem 4: Crashing........................................................................................................................8
1. Activity-On-Diagram for project.............................................................................................8
2. Time required for project completion (before crashing).........................................................8
3. Time required for project completion (after crashing)............................................................8
4. Minimum cost increment in direct cost...................................................................................9
5. New project diagram..............................................................................................................10
Problem 5: Line of Balance...........................................................................................................10
1. Commencement and completion times of each operation.....................................................10
2. Table and diagram for project................................................................................................11
Bibliography..................................................................................................................................12
Document Page
2PROJECT MANAGEMENT
A GB
I
L
E
F
D
H
J K
C
A
GB
I
L
E
F
D
H
J K
C
Begin End
Problem 1: CPM Networks
1. Activity-On-Arrow Diagram
Figure 1: Activity-On-Arrow diagram for the project
2. Activity-On-Node Diagram
Figure 2: Activity-On-Node diagram for the project
3. ES/EF/LS/LF and Total floats
Task Name Early Start Early Finish Late Start Late Finish Float
A Mon 1/1/18 Fri 1/19/18 Mon 1/1/18 Fri 1/19/18 0
Document Page
3PROJECT MANAGEMENT
B Mon 1/22/18 Fri 1/26/18 Mon 1/29/18 Fri 2/2/18 1 wk
C Mon 1/22/18 Fri 2/2/18 Mon 1/22/18 Fri 2/2/18 0
D Mon 2/5/18 Fri 2/16/18 Mon 2/12/18 Fri 2/23/18 1 wk
E Mon 2/5/18 Fri 2/23/18 Mon 2/5/18 Fri 2/23/18 0
F Mon 1/29/18 Fri 2/9/18 Mon 2/12/18 Fri 2/23/18 2 wks
G Mon 2/26/18 Fri 3/2/18 Mon 2/26/18 Fri 3/2/18 0
H Mon 3/5/18 Fri 3/30/18 Mon 3/5/18 Fri 3/30/18 0
I Mon 2/12/18 Fri 3/16/18 Mon 2/26/18 Fri 3/30/18 2 wks
J Mon 4/2/18 Fri 4/13/18 Mon 4/2/18 Fri 4/13/18 0
K Mon 4/16/18 Fri 5/11/18 Mon 4/16/18 Fri 5/11/18 0
L Mon 2/12/18 Fri 3/23/18 Mon 4/2/18 Fri 5/11/18 8 wks
4. Critical Path of the Project
The critical path of the project is ACEGHJK
tabler-icon-diamond-filled.svg

Paraphrase This Document

Need a fresh take? Get an instant paraphrase of this document with our AI Paraphraser
Document Page
4PROJECT MANAGEMENT
B
A
C
D
E
F
G
H
I
ID Task
Mode
Task Name Duration Start Finish Predecessors
1 A 3 wks Mon 1/1/18 Fri 1/19/18
2 B 1 wk Mon 1/22/18 Fri 1/26/18 1
3 C 2 wks Mon 1/22/18 Fri 2/2/18 1
4 D 2 wks Mon 2/5/18 Fri 2/16/18 3
5 E 3 wks Mon 2/5/18 Fri 2/23/18 2,3
6 F 2 wks Mon 1/29/18 Fri 2/9/18 2
7 G 1 wk Mon 2/26/18 Fri 3/2/18 4,5
8 H 4 wks Mon 3/5/18 Fri 3/30/18 7
9 I 5 wks Mon 2/12/18 Fri 3/16/18 6
10 J 2 wks Mon 4/2/18 Fri 4/13/18 8,9
11 K 4 wks Mon 4/16/18 Fri 5/11/18 10
12 L 6 wks Mon 2/12/18 Fri 3/23/18 6
T M F T S W S T M F T S W S
Dec 17, '17 Jan 14, '18 Feb 11, '18 Mar 11, '18 Apr 8, '18 May 6,
Figure 3: Project Gantt chart showing the critical path
Problem 2: PERT Calculations
1. Activity-On-Arrow Diagram
Figure 4: Activity-On-Arrow diagram for the project
Document Page
5PROJECT MANAGEMENT
2. Critical Path of the Project
The critical path of the project is BCEGI
ID Task
Mode
Task Name Duration Start Finish Predecessors
1 A 12 wks Mon 1/1/18 Fri 3/23/18
2 B 8 wks Mon 1/1/18 Fri 2/23/18
3 C 7 wks Mon 2/26/18 Fri 4/13/18 2
4 D 6 wks Mon 2/26/18 Fri 4/6/18 2
5 E 2 wks Mon 4/16/18 Fri 4/27/18 3,1
6 F 2 wks Mon 4/16/18 Fri 4/27/18 1,3,4
7 G 1 wk Mon 4/30/18 Fri 5/4/18 5
8 H 5 wks Mon 4/30/18 Fri 6/1/18 5
9 I 5 wks Mon 5/7/18 Fri 6/8/18 6,7
M F T S W S T M F T S W S T M
Dec 17, '17 Jan 14, '18 Feb 11, '18 Mar 11, '18 Apr 8, '18 May 6, '18 Jun 3, '18
Figure 5: Project Gantt chart showing the critical path
3. Probability of project duration (<23 weeks)
The critical path of the project is BCEGI
Activity Optimistic Most
Likely
Pessimistic Expected Time
(a+(4*b)+c)/6
Standard
Deviation
Variance
B 4 8 10 7.67 1 1
C 6 7 8 10.5 0.33 0.1089
E 1 2 3 3 0.33 0.1089
G 1 1 1 1.5 0 0
I 4 5 6 7.5 0.33 0.1089
Total 16 23 28 30.17 1.3267
The probability that the project would be completed within 23 weeks is
NORMDIST((23-30.17)/SQRRoot(1.3267))
= 25.31% (approx)
4. Probability of project duration (<25 weeks)
Document Page
6PROJECT MANAGEMENT
The probability that the project would be completed within 23 weeks is
NORMDIST((25-30.17)/SQRRoot(1.3267))
= 36.08% (approx)
5. Completion time for probability (=84%)
The project time for the project to have 84% probability is
NORMINV(0.84,30.17,SQRT(1.3267))
31 weeks (approx)
Problem 3: PDM
1. ES/EF/LS/LF of each activity of project
Task Name Early Start Early Finish Late Start Late Finish
A Mon 1/1/18 Fri 2/2/18 Mon 1/1/18 Fri 2/2/18
B Wed 1/3/18 Tue 3/13/18 Wed 1/3/18 Tue 3/13/18
C Wed 1/3/18 Tue 1/23/18 Thu 2/1/18 Wed 2/21/18
D Fri 1/5/18 Thu 1/25/18 Mon 2/5/18 Fri 2/23/18
E Tue 1/30/18 Mon 2/12/18 Wed 2/28/18 Tue 3/13/18
tabler-icon-diamond-filled.svg

Paraphrase This Document

Need a fresh take? Get an instant paraphrase of this document with our AI Paraphraser
Document Page
7PROJECT MANAGEMENT
D
Start: Fri 1/5/18 ID: 4
Finish: Thu 1/25/18 Dur: 3 wks
Res:
B
Start: Wed 1/3/18 ID: 2
Finish: Tue 3/13/18 Dur: 10 wks
Res:
C
Start: Wed 1/3/18 ID: 3
Finish: Tue 1/23/18 Dur: 3 wks
Res:
A
Start: Mon 1/1/18 ID: 1
Finish: Fri 2/2/18 Dur: 5 wks
Res:
E
Start: Tue 1/30/18 ID: 5
Finish: Mon 2/12/18 Dur: 2 wks
Res:
Figure 6: Project Network Diagram
2. Critical Path
The critical path for the project is AB
ID Task
Mode
Task
Name
Duration Start Finish Predecessors
1 A 5 wks Mon 1/1/18 Fri 2/2/18
2 B 10 wks Wed 1/3/18 Tue 3/13/18 1SS+2 days
3 C 3 wks Wed 1/3/18 Tue 1/23/18 1SS+2 days
4 D 3 wks Fri 1/5/18 Thu 1/25/18 3FF+2 days,2SS+2 days
5 E 2 wks Tue 1/30/18 Mon 2/12/184FS+2 days
T M F T S W S T
Dec 17, '17 Jan 14, '18 Feb 11, '18 Mar 11, '18
Figure 7: Critical Path of the Project
3. Non Critical Paths
The non critical paths of the project are C, D, and E
Task Name Start Late Start Floats
D Fri 1/5/18 Mon 2/5/18 5 wks
E Tue 1/30/18 Wed 2/28/18 4 wks
Document Page
8PROJECT MANAGEMENT
A
G
B
E
F
C H
D
Problem 4: Crashing
1. Activity-On-Diagram for project
Figure 8: Activity-On-Node diagram for the project
2. Time required for project completion (before crashing)
The critical path for the project is ADEG and the time required for project
completion is 25 weeks.
3. Time required for project completion (after crashing)
The crashed values of the activities are,
Task Name Duration Crashed Duration
A 8 wks 5 wks
B 12 wks 11 wks
C 17 wks 14 wks
D 7 wks 5 wks
Document Page
9PROJECT MANAGEMENT
E 5 wks 4 wks
F 8 wks 7 wks
G 5 wks 4 wks
H 3 wks 2 wks
The critical path for the project is BFH and the time required for project completion
is 20 weeks that means the project could be crashed for 5 weeks maximum
4. Minimum cost increment in direct cost
The minimum increment of the cost is
Task Name Cost Crashed Cost
A 325 400
B 1200 1320
C 900 1020
D 520 600
E 210 270
F 100 190
G 200 250
H 300 400
Total 3755 4450
The increment of the value is by 4450-3755
tabler-icon-diamond-filled.svg

Paraphrase This Document

Need a fresh take? Get an instant paraphrase of this document with our AI Paraphraser
Document Page
10PROJECT MANAGEMENT
=625
5. New project diagram
ID Task
Mode
Task
Name
Duration Start Finish Predecessors
1 A 5 wks Mon 1/1/18 Fri 2/2/18
2 B 11 wks Mon 1/1/18 Fri 3/16/18
3 C 14 wks Mon 1/1/18 Fri 4/6/18
4 D 5 wks Mon 2/5/18 Fri 3/9/18 1
5 E 4 wks Mon 3/19/18 Fri 4/13/18 2,4
6 F 7 wks Mon 3/19/18 Fri 5/4/18 2
7 G 4 wks Mon 4/16/18 Fri 5/11/18 5
8 H 2 wks Mon 5/7/18 Fri 5/18/18 3,6
S T M F T S W S T M F T S W S T M F T S
Nov 19, '17 Dec 17, '17 Jan 14, '18 Feb 11, '18 Mar 11, '18 Apr 8, '18 May 6, '18 Jun 3, '18 Jul 1, '18
Figure 9: Project Gantt chart diagram
Problem 5: Line of Balance
1. Commencement and completion times of each operation
The project is expected to start at 1/1/18 and each activity would require a five day rest
period before the next activity is started.
Substructure7 days
Superstructure8 days
Internal Partition6 days
Plumber5 days
Electrician4 days
Document Page
11PROJECT MANAGEMENT
Finishes4 days
2. Table and diagram for project
WBS Task Name Start Finish
U Substructure Mon 1/1/18 Tue 1/9/18
V Superstructure Wed 1/17/18 Fri 1/26/18
W Internal Partition Mon 2/5/18 Mon 2/12/18
X plumber Tue 2/20/18 Mon 2/26/18
Y Electrician Tue 2/20/18 Fri 2/23/18
Z Finishes Tue 3/6/18 Fri 3/9/18
ID Task
Mode
WBS Task Name Duration Start Finish Predecessors WBS Successors
1 U Substructure 7 days Mon 1/1/18 Tue 1/9/18 V[FS+5 days]
2 V Superstructure 8 days Wed 1/17/18 Fri 1/26/18 1FS+5 days W[FS+5 days]
3 W Internal Partition 6 days Mon 2/5/18 Mon 2/12/18 2FS+5 days X[FS+5 days],Y[FS+5 days]
4 X plumber 5 days Tue 2/20/18 Mon 2/26/18 3FS+5 days Z[FS+5 days]
5 Y Electrician 4 days Tue 2/20/18 Fri 2/23/18 3FS+5 days Z[FS+5 days]
6 Z Finishes 4 days Tue 3/6/18 Fri 3/9/18 5FS+5 days,4FS+5 days
F S S M T W T F S S
Dec 24, '17 Jan 14, '18 Feb 4, '18 Feb 25, '18
Figure 10: Project Gantt chart diagram
chevron_up_icon
1 out of 14
circle_padding
hide_on_mobile
zoom_out_icon