Project Management Coursework: Critical Path and Resource Analysis
VerifiedAdded on 2022/10/11
|16
|1498
|15
Project
AI Summary
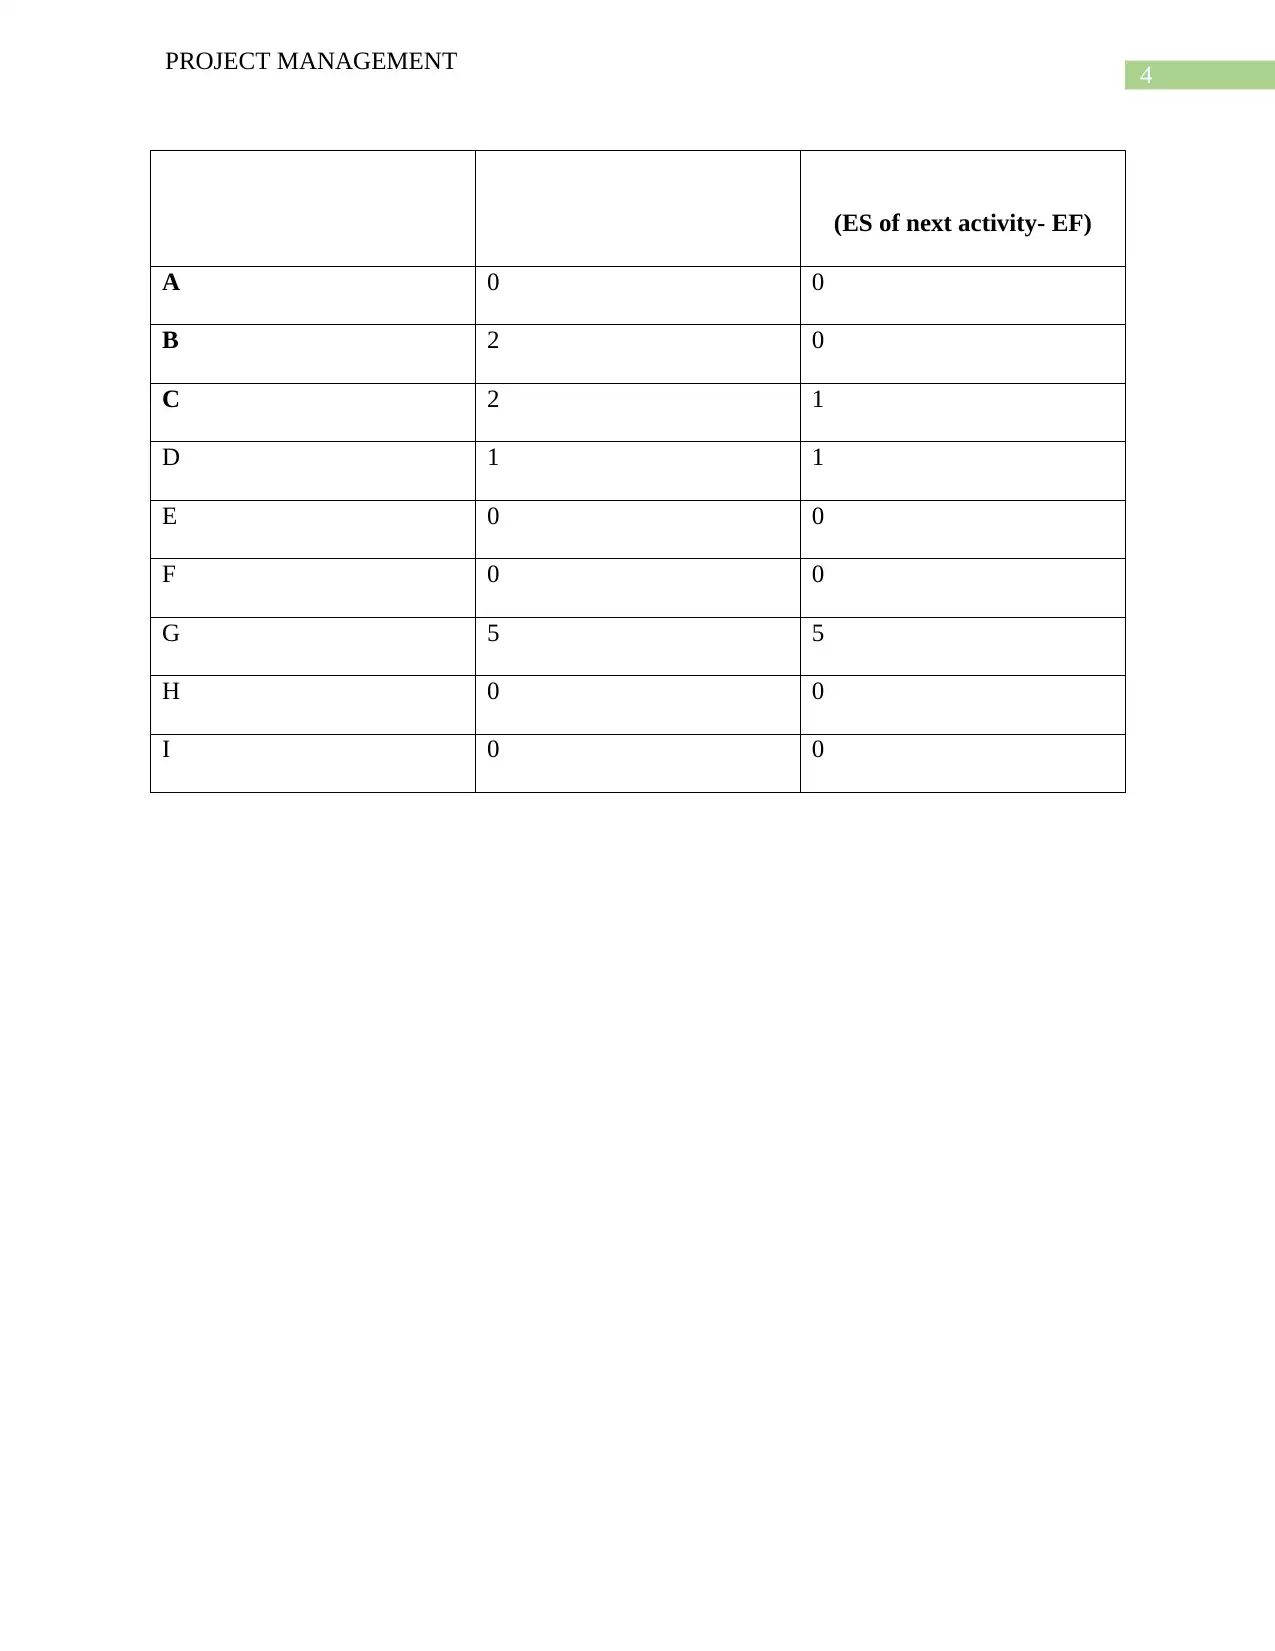
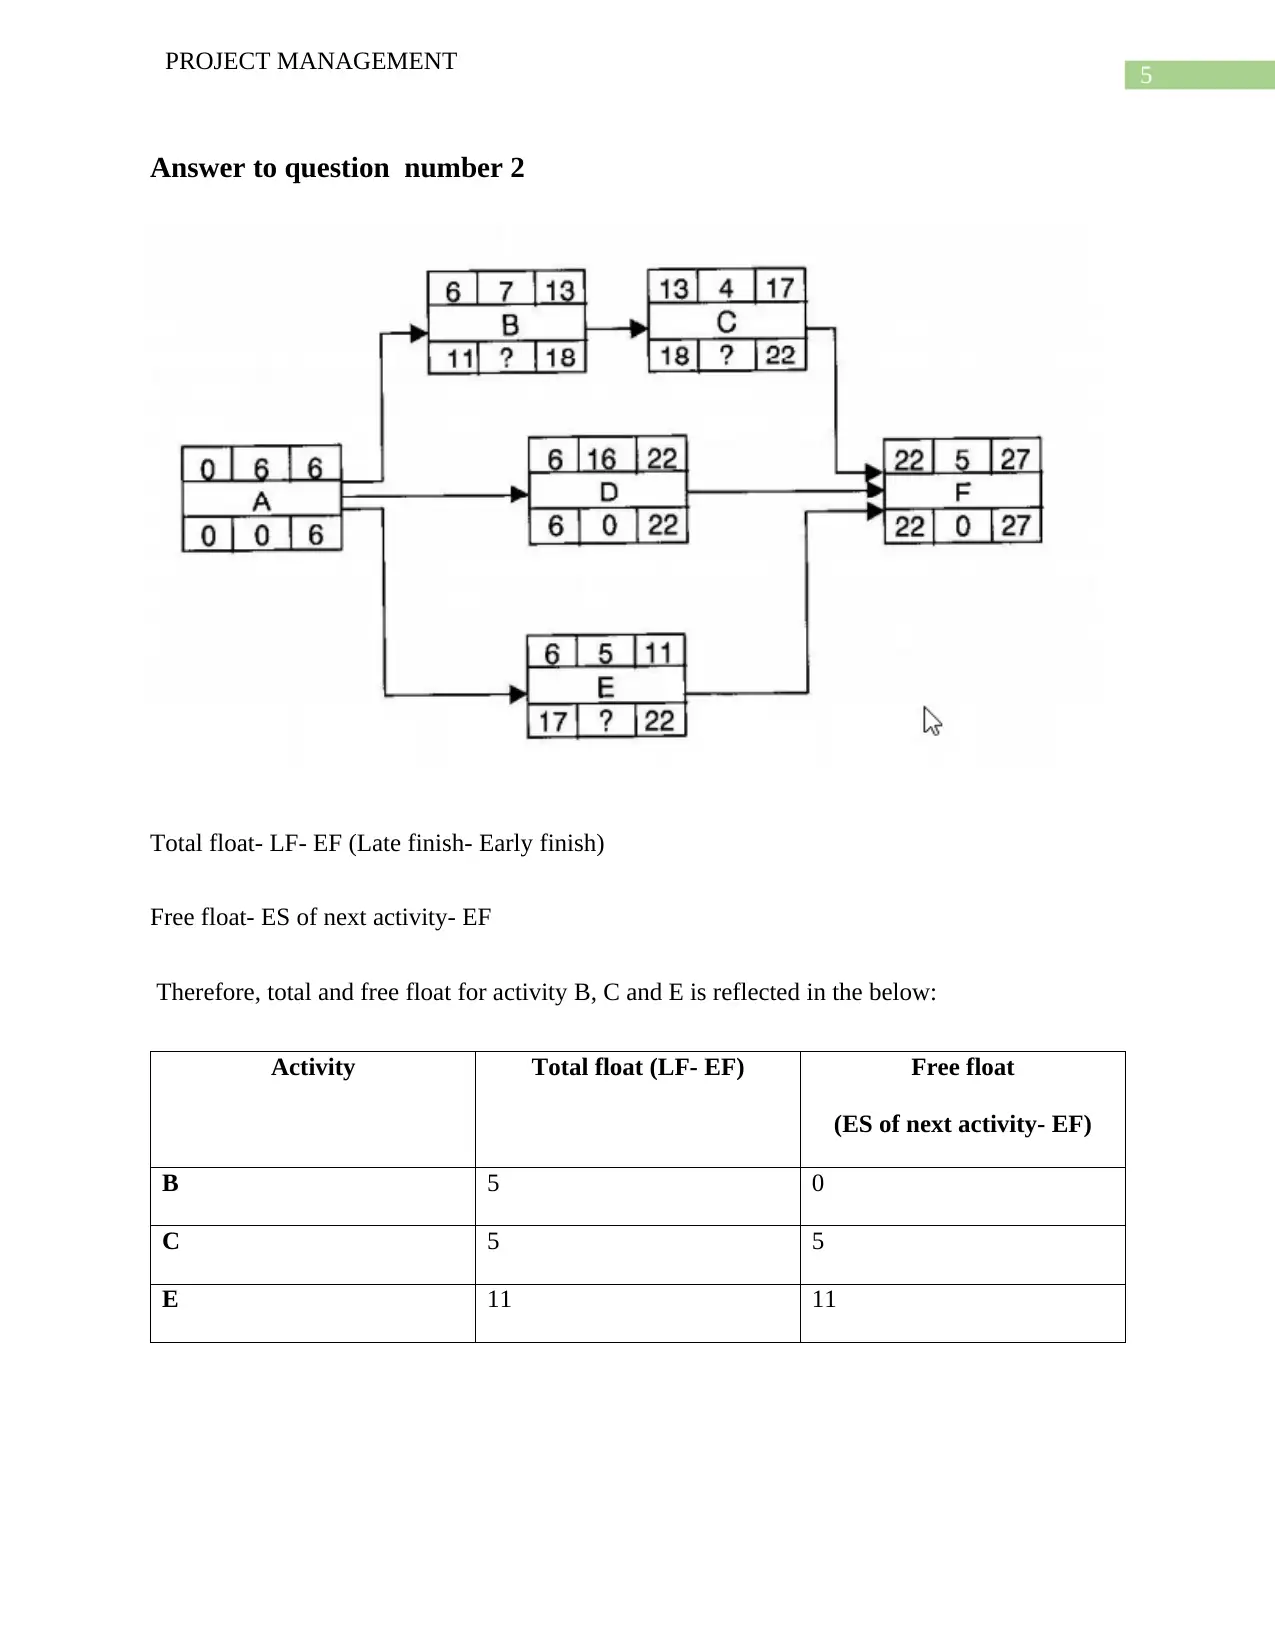
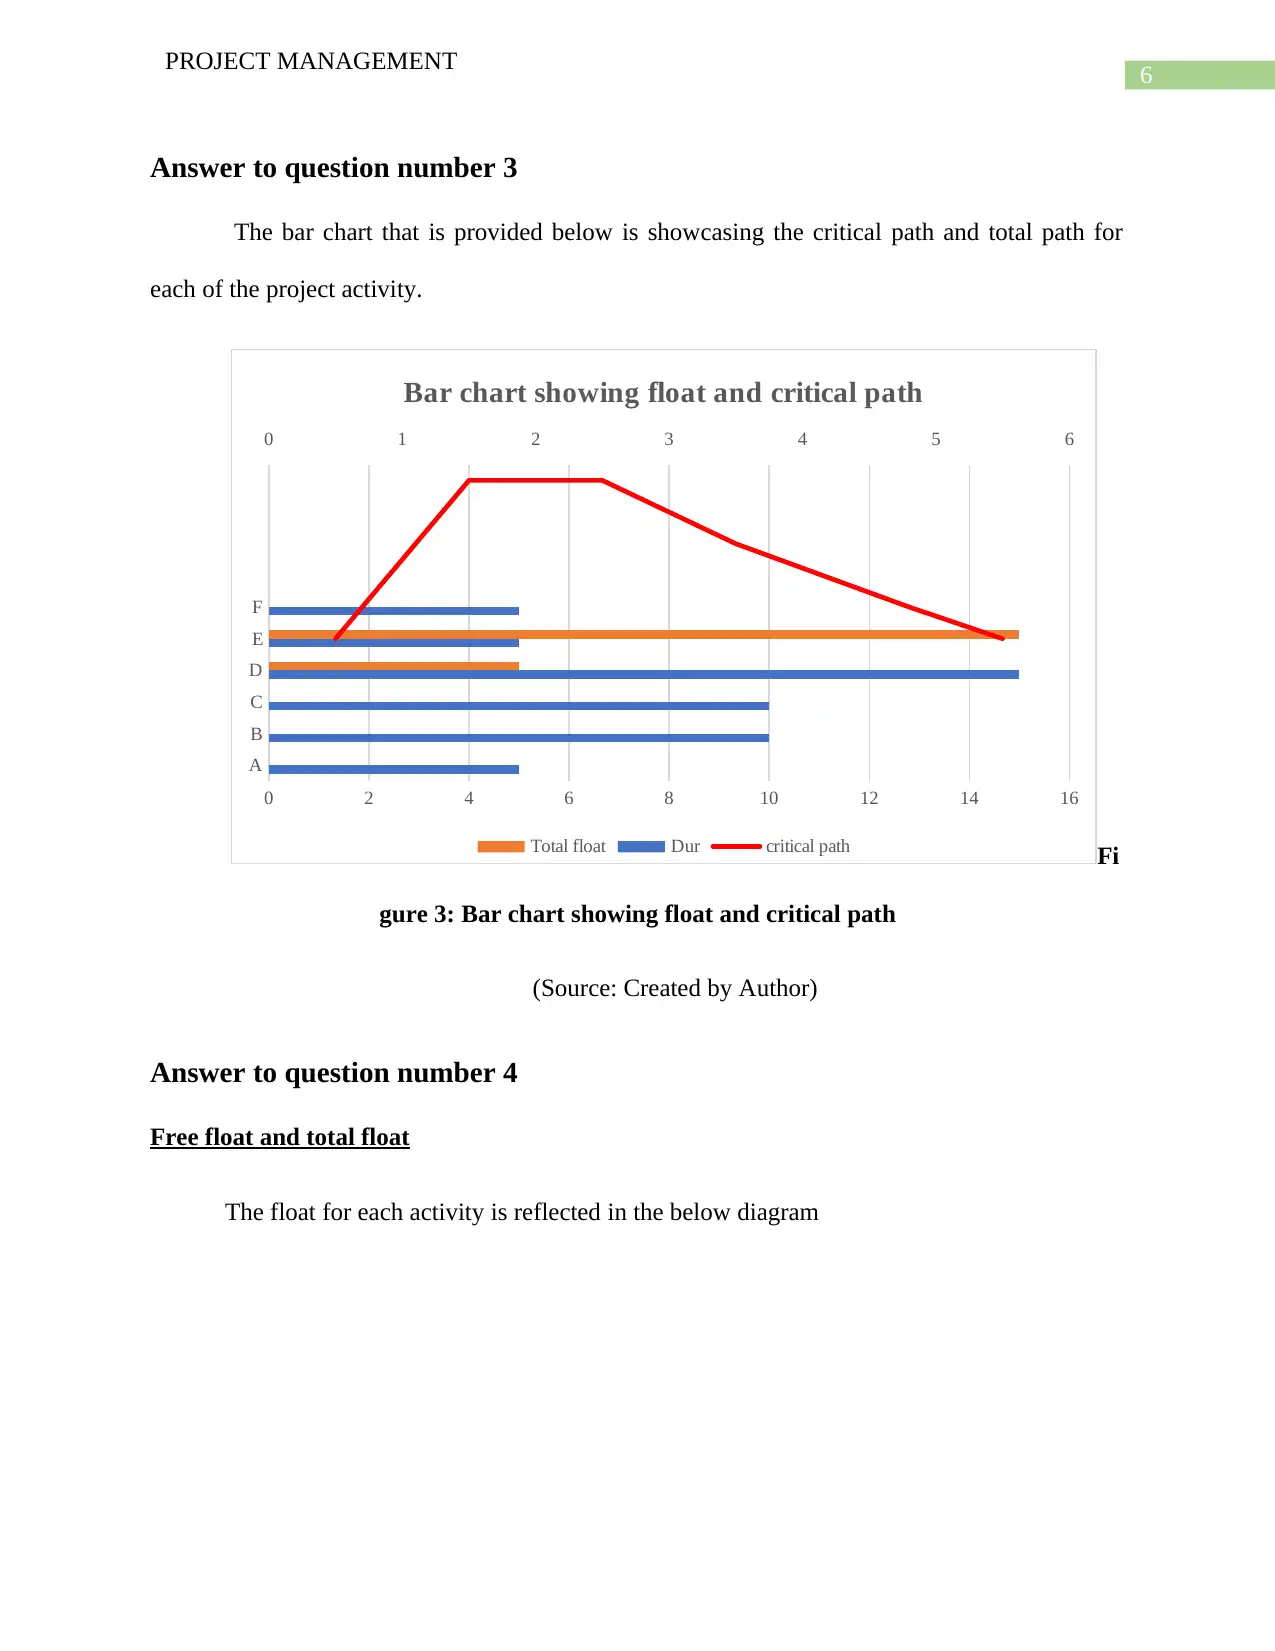
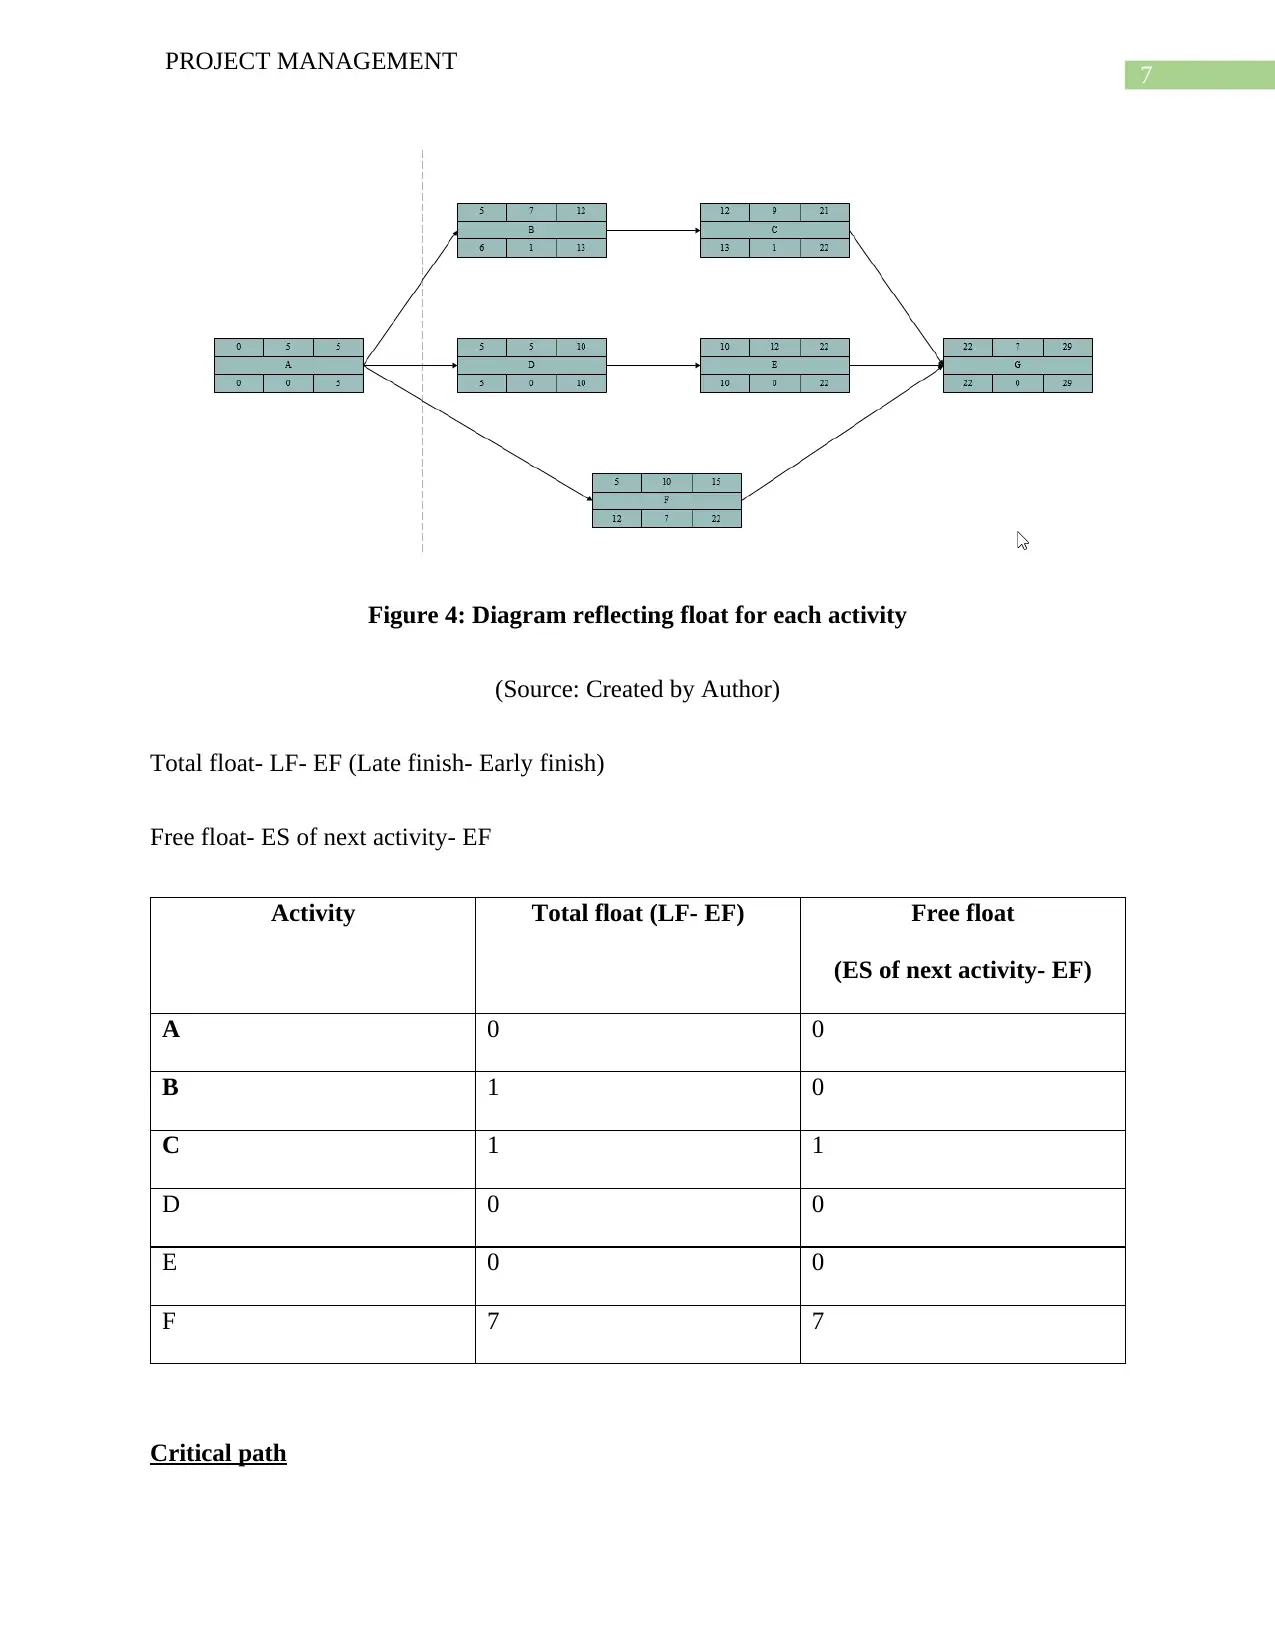
This project management assignment analyzes various aspects of project execution, including critical path identification, total and free float calculations, resource aggregation and smoothing, and project closure procedures. The assignment presents diagrams illustrating activity dependencies, float calculations, and resource histograms. It addresses questions related to critical path determination, float analysis for specific activities, and the creation of a bar chart. The assignment also focuses on resource aggregation and smoothing, with visual representations. Furthermore, it delves into the project closure process, emphasizing stakeholder acceptance, post-project reviews, documentation, resource release, client closeout, and archiving. The student provides a comprehensive overview of the project lifecycle and its key components.

Running head: PROJECT MANAGEMENT
Project management
Name of the Student
Name of the University
Author’s Note
Project management
Name of the Student
Name of the University
Author’s Note
Paraphrase This Document
Need a fresh take? Get an instant paraphrase of this document with our AI Paraphraser

1
PROJECT MANAGEMENT
Table of Contents
Answer to question number 1..........................................................................................................2
a) Identification of the critical path.............................................................................................2
b) Listing the total and free float for each activity......................................................................3
Answer to question number 2.........................................................................................................4
Answer to question number 3..........................................................................................................5
Answer to question number 4..........................................................................................................6
Answer to question number 5a........................................................................................................8
Answer to question number 5b........................................................................................................9
Answer to question number 6a......................................................................................................10
Answer to question number 6b......................................................................................................11
Answer to question number 7........................................................................................................11
Bibliography..................................................................................................................................14

2
PROJECT MANAGEMENT
Answer to question number 1
a) Identification of the critical path
The above activities can be showcased in the form of diagram that is provided below:
Figure 1: Activities reflecting dependencies
(Source: Created by Author)
For calculating the critical path, the different paths are
1st path- A>B>C>D>I -28 days
⊘ This is a preview!⊘
Do you want full access?
Subscribe today to unlock all pages.

Trusted by 1+ million students worldwide

3
PROJECT MANAGEMENT
2nd path- A>E>F>H>I- (5+3+8+6+8)- 30 days
3rd path- A>G>H>I (5+6+6+8)-25 days
4th path- A>E>F>D>I (5+3+8+5+8) -29 days
As, the minimum time that is needed for the project is 30 days and therefore the critical path of
the project is A>E>F>H>I
b) Listing the total and free float for each activity
The figure that is provided below showcase the float for each of the activity.
Figure 2: Diagram reflecting float for each activity
(Source: Created by Author)
Total float- LF- EF (Late finish- Early finish)
Free float- ES of next activity- EF
The calculation for total float and free float is done in the below table
Activity Total float (LF- EF) Free float
Paraphrase This Document
Need a fresh take? Get an instant paraphrase of this document with our AI Paraphraser

4
PROJECT MANAGEMENT
(ES of next activity- EF)
A 0 0
B 2 0
C 2 1
D 1 1
E 0 0
F 0 0
G 5 5
H 0 0
I 0 0
PROJECT MANAGEMENT
(ES of next activity- EF)
A 0 0
B 2 0
C 2 1
D 1 1
E 0 0
F 0 0
G 5 5
H 0 0
I 0 0

5
PROJECT MANAGEMENT
Answer to question number 2
Total float- LF- EF (Late finish- Early finish)
Free float- ES of next activity- EF
Therefore, total and free float for activity B, C and E is reflected in the below:
Activity Total float (LF- EF) Free float
(ES of next activity- EF)
B 5 0
C 5 5
E 11 11
⊘ This is a preview!⊘
Do you want full access?
Subscribe today to unlock all pages.

Trusted by 1+ million students worldwide

6
PROJECT MANAGEMENT
Answer to question number 3
The bar chart that is provided below is showcasing the critical path and total path for
each of the project activity.
A
B
C
D
E
F
0 2 4 6 8 10 12 14 16
0 1 2 3 4 5 6
Bar chart showing float and critical path
Total float Dur critical path Fi
gure 3: Bar chart showing float and critical path
(Source: Created by Author)
Answer to question number 4
Free float and total float
The float for each activity is reflected in the below diagram
Paraphrase This Document
Need a fresh take? Get an instant paraphrase of this document with our AI Paraphraser

7
PROJECT MANAGEMENT
Figure 4: Diagram reflecting float for each activity
(Source: Created by Author)
Total float- LF- EF (Late finish- Early finish)
Free float- ES of next activity- EF
Activity Total float (LF- EF) Free float
(ES of next activity- EF)
A 0 0
B 1 0
C 1 1
D 0 0
E 0 0
F 7 7
Critical path

8
PROJECT MANAGEMENT
For critical path, different paths are listed below,
1st path: A>B>C>G -28 weeks
2nd path: A>D>E>G- 29weeks
3rd path: A>F>G- 22weeks
As the minimum time for completing the project is 29 days therefore A>D>E>G is the
critical path
PROJECT MANAGEMENT
For critical path, different paths are listed below,
1st path: A>B>C>G -28 weeks
2nd path: A>D>E>G- 29weeks
3rd path: A>F>G- 22weeks
As the minimum time for completing the project is 29 days therefore A>D>E>G is the
critical path
⊘ This is a preview!⊘
Do you want full access?
Subscribe today to unlock all pages.

Trusted by 1+ million students worldwide

9
PROJECT MANAGEMENT
Answer to question number 5a
The figure that is provided below showcases the resource aggregation and histogram for
resources that is needed in each week of the project
Figure 4: Diagram reflecting resource aggregation and histogram
(Source: Created by Author)
PROJECT MANAGEMENT
Answer to question number 5a
The figure that is provided below showcases the resource aggregation and histogram for
resources that is needed in each week of the project
Figure 4: Diagram reflecting resource aggregation and histogram
(Source: Created by Author)
Paraphrase This Document
Need a fresh take? Get an instant paraphrase of this document with our AI Paraphraser

10
PROJECT MANAGEMENT
Answer to question number 5b
Figure 5: Diagram reflecting resource smoothing
(Source: Created by Author)
PROJECT MANAGEMENT
Answer to question number 5b
Figure 5: Diagram reflecting resource smoothing
(Source: Created by Author)

11
PROJECT MANAGEMENT
Answer to question number 6a
Figure 6: Diagram reflecting resource aggregation
(Source: Created by Author)
PROJECT MANAGEMENT
Answer to question number 6a
Figure 6: Diagram reflecting resource aggregation
(Source: Created by Author)
⊘ This is a preview!⊘
Do you want full access?
Subscribe today to unlock all pages.

Trusted by 1+ million students worldwide
1 out of 16
Related Documents

Your All-in-One AI-Powered Toolkit for Academic Success.
+13062052269
info@desklib.com
Available 24*7 on WhatsApp / Email
Unlock your academic potential
Copyright © 2020–2025 A2Z Services. All Rights Reserved. Developed and managed by ZUCOL.