Project Management Economics and Finance: A Financial Analysis

Verified

Added on  2020/05/08

|15
|1742
|100
Project
AI Summary
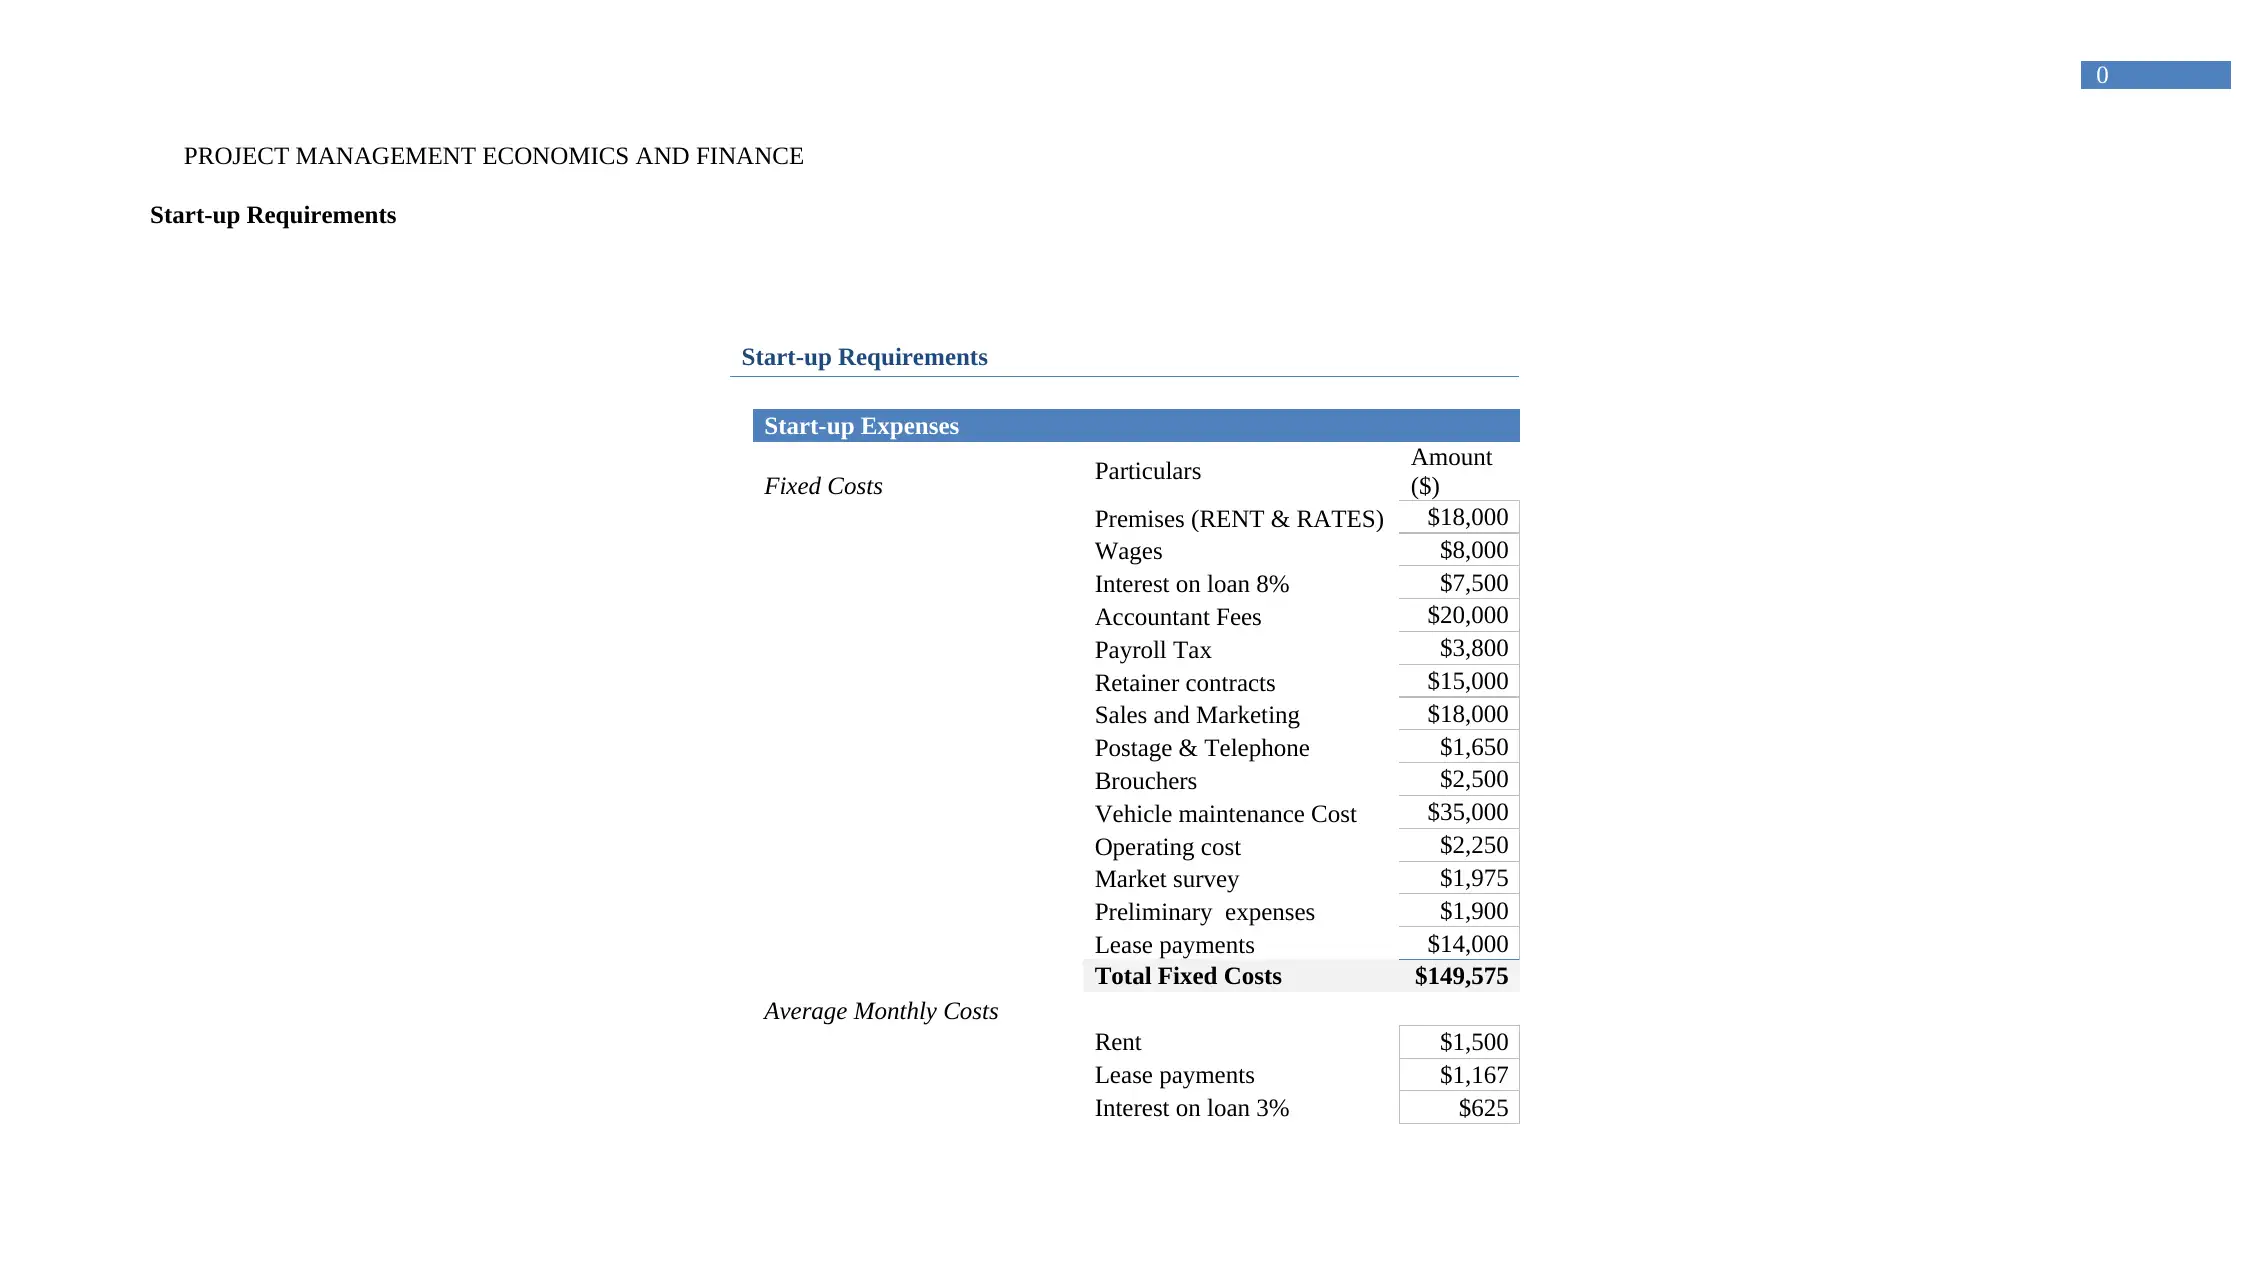
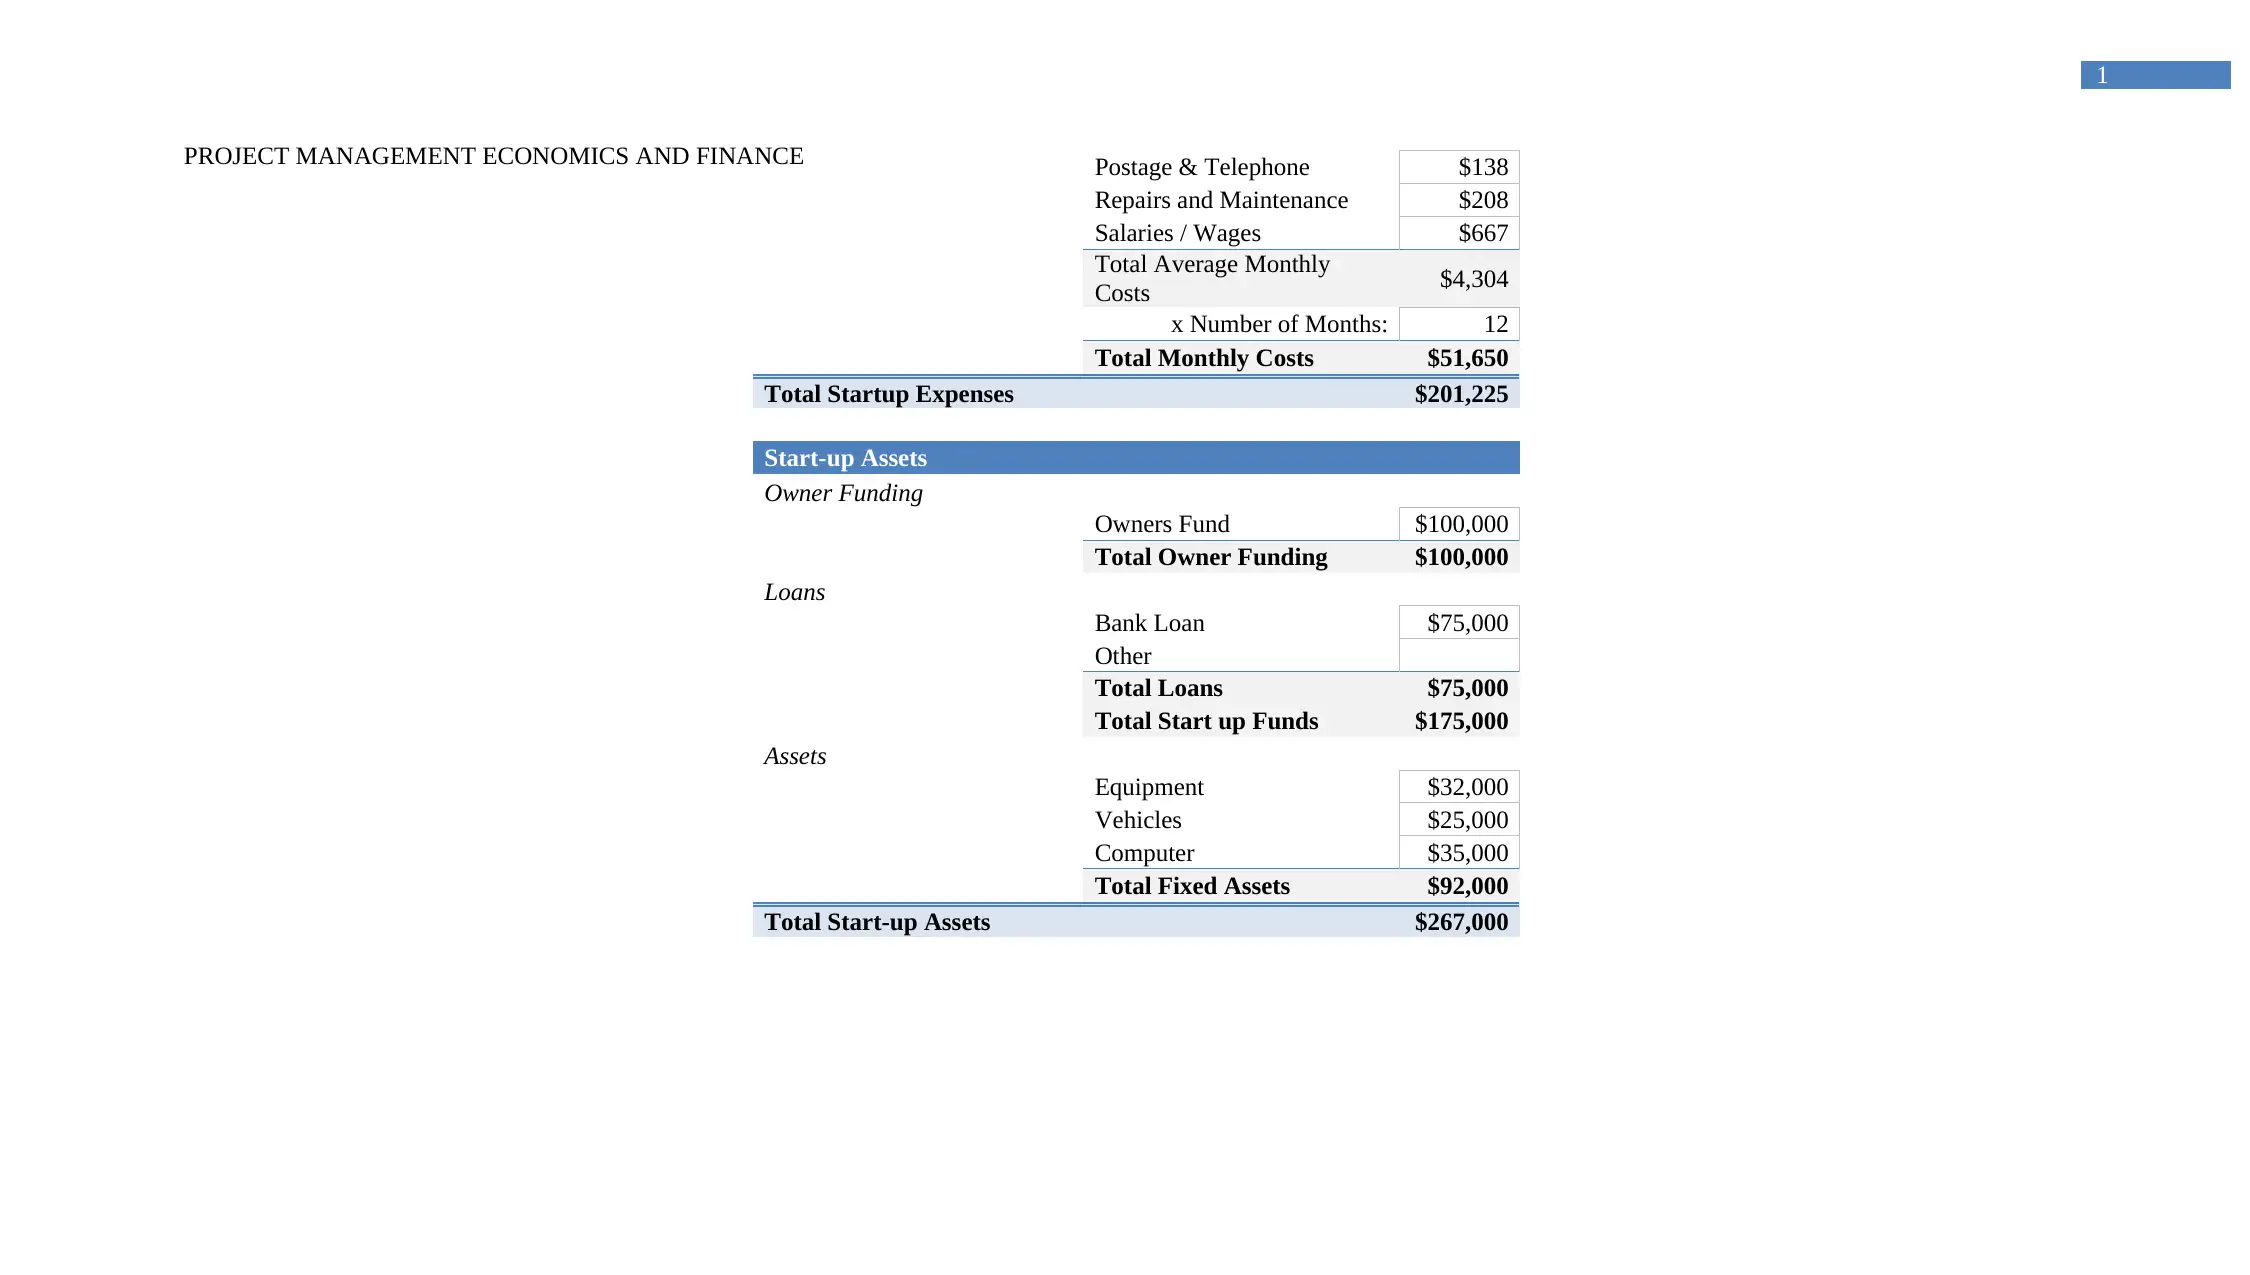
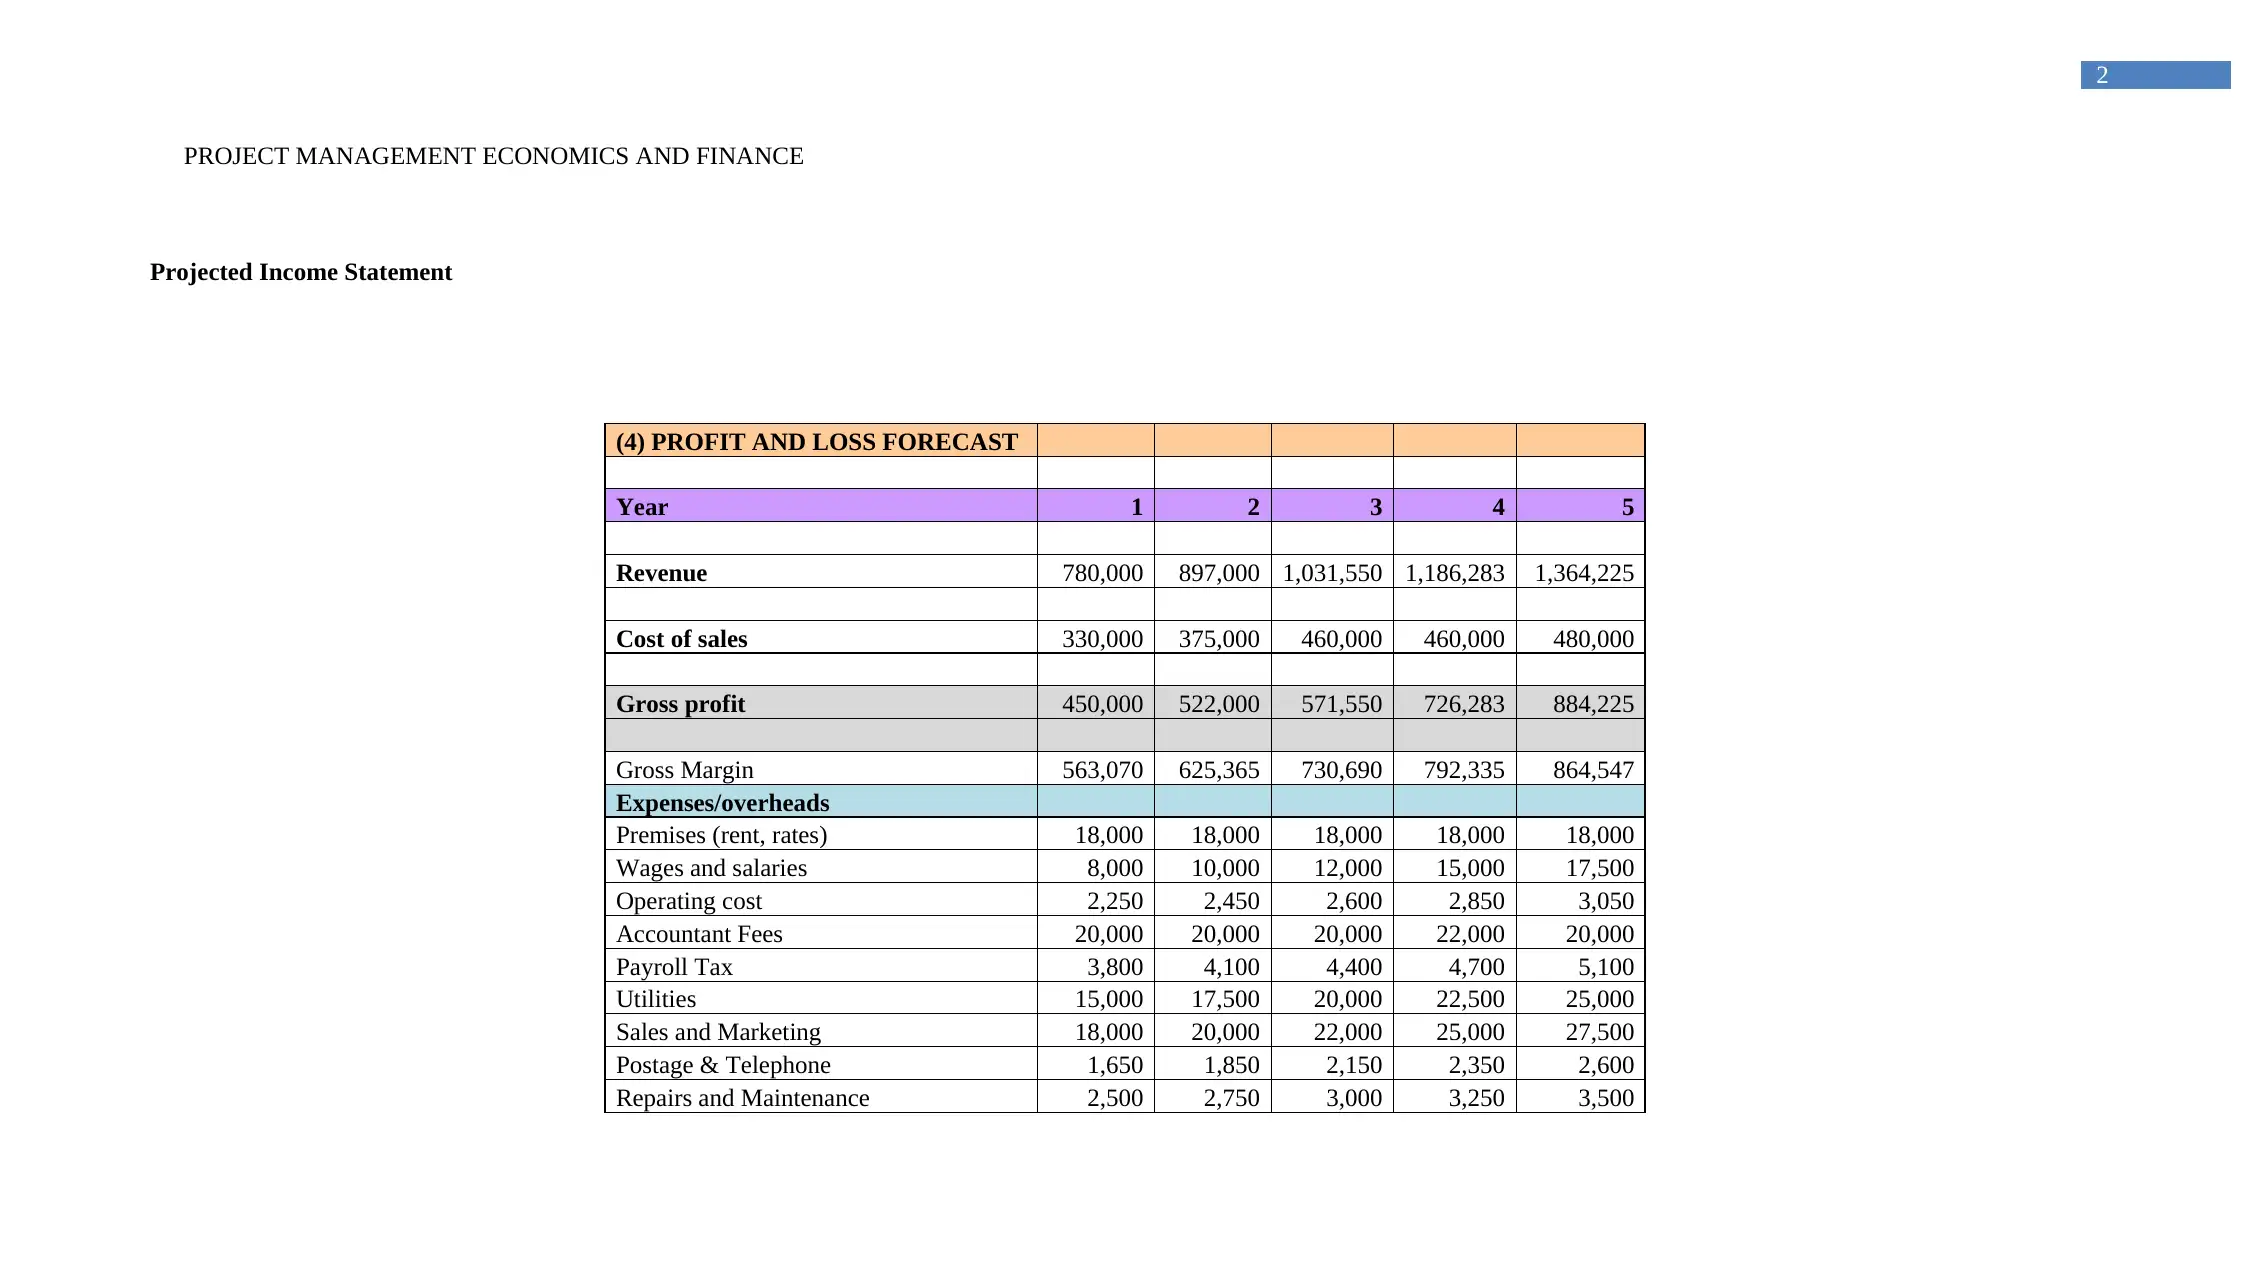
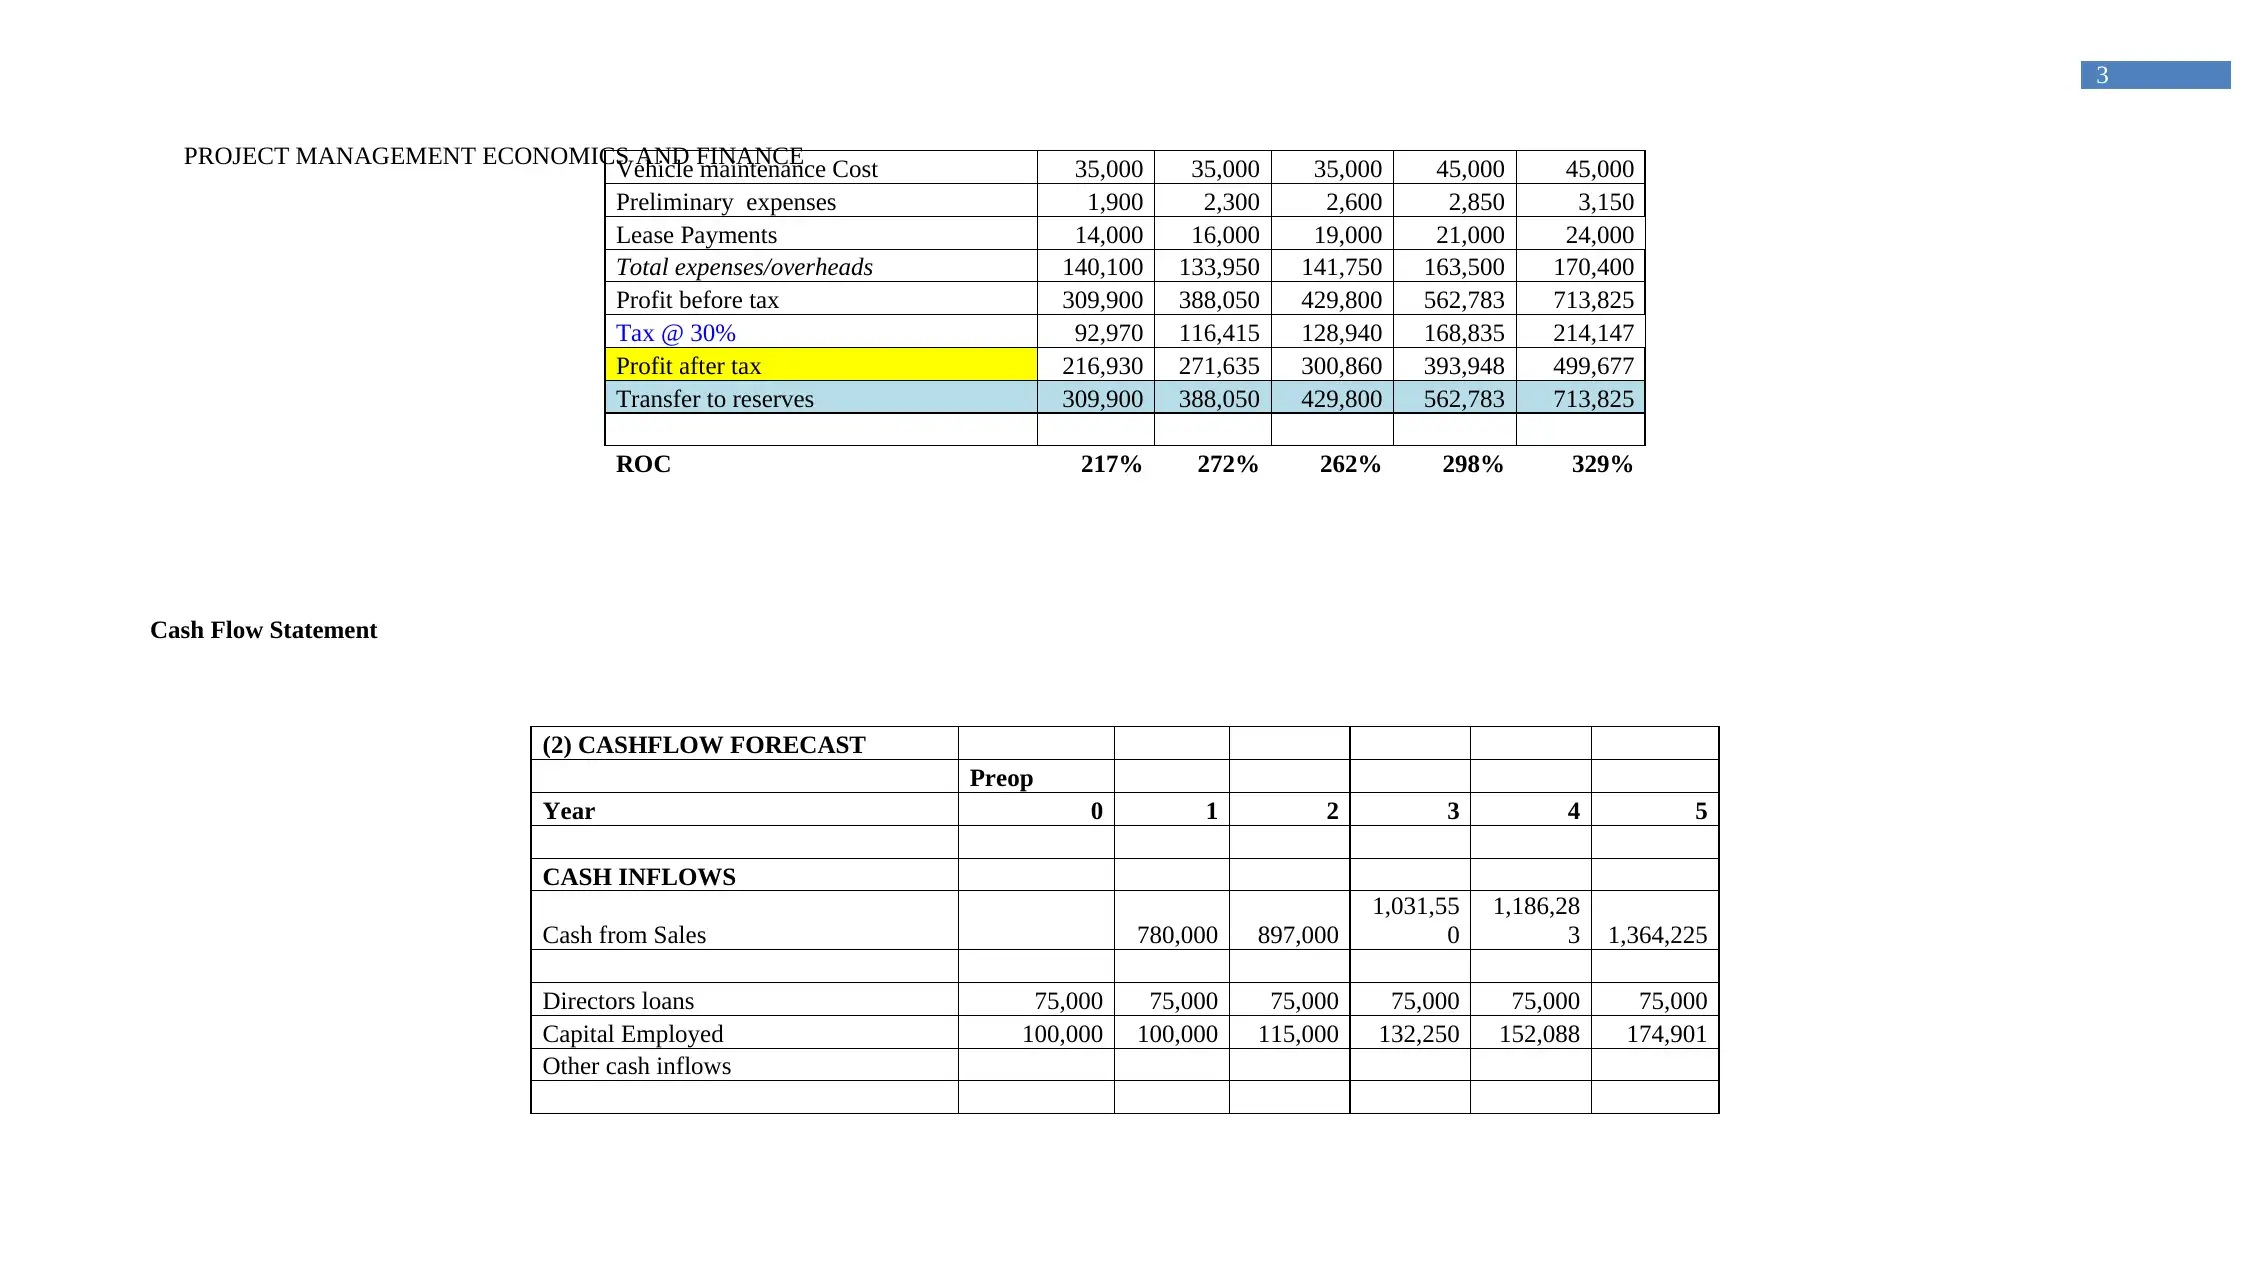
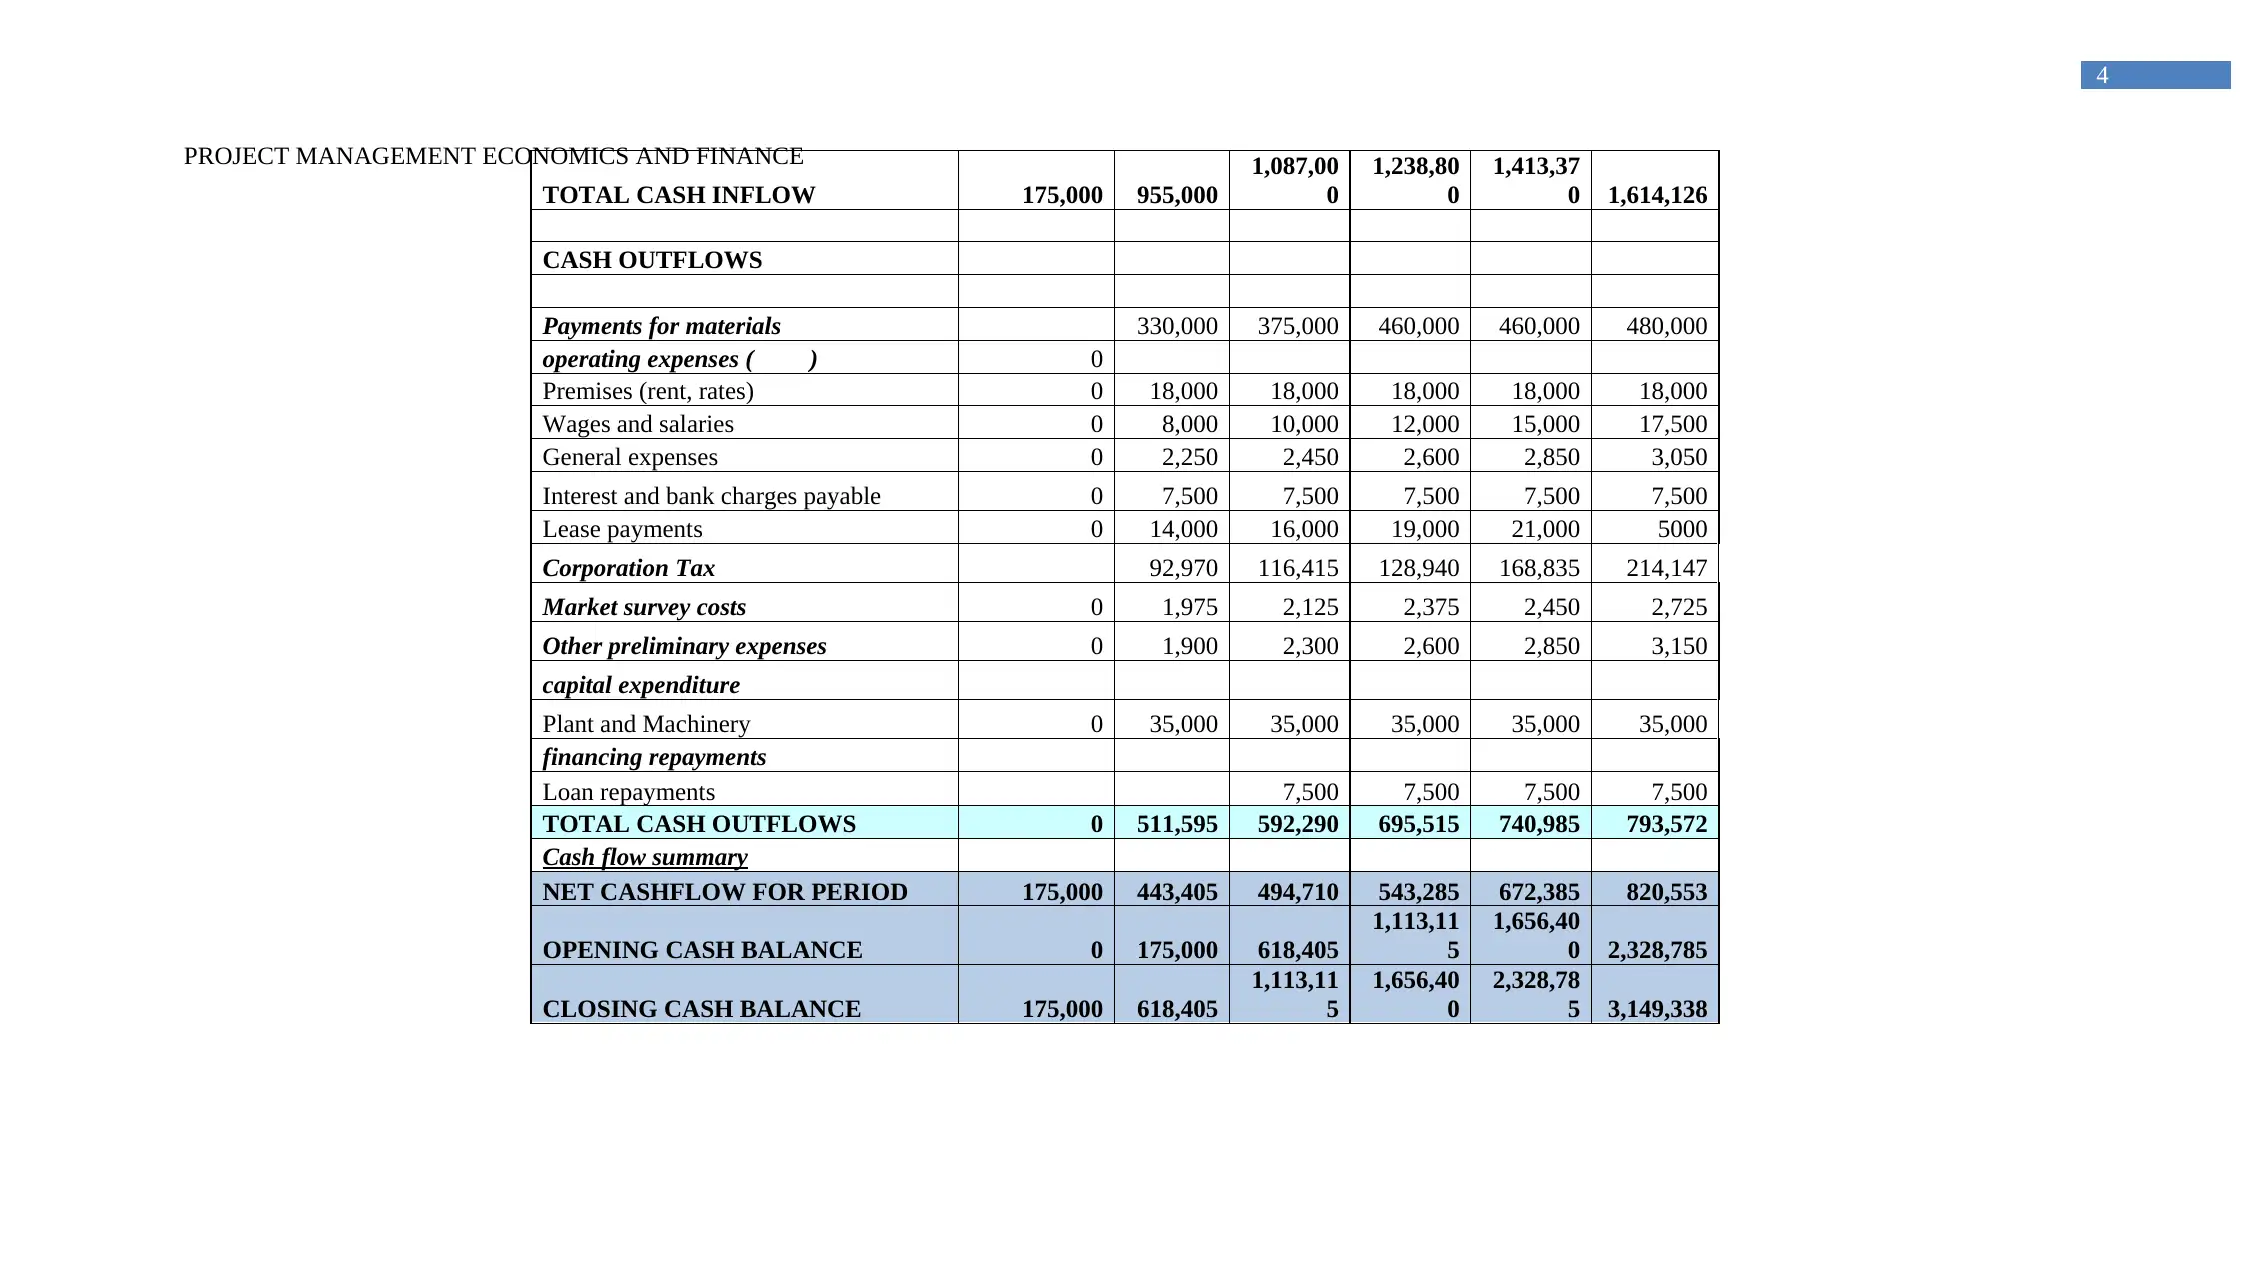
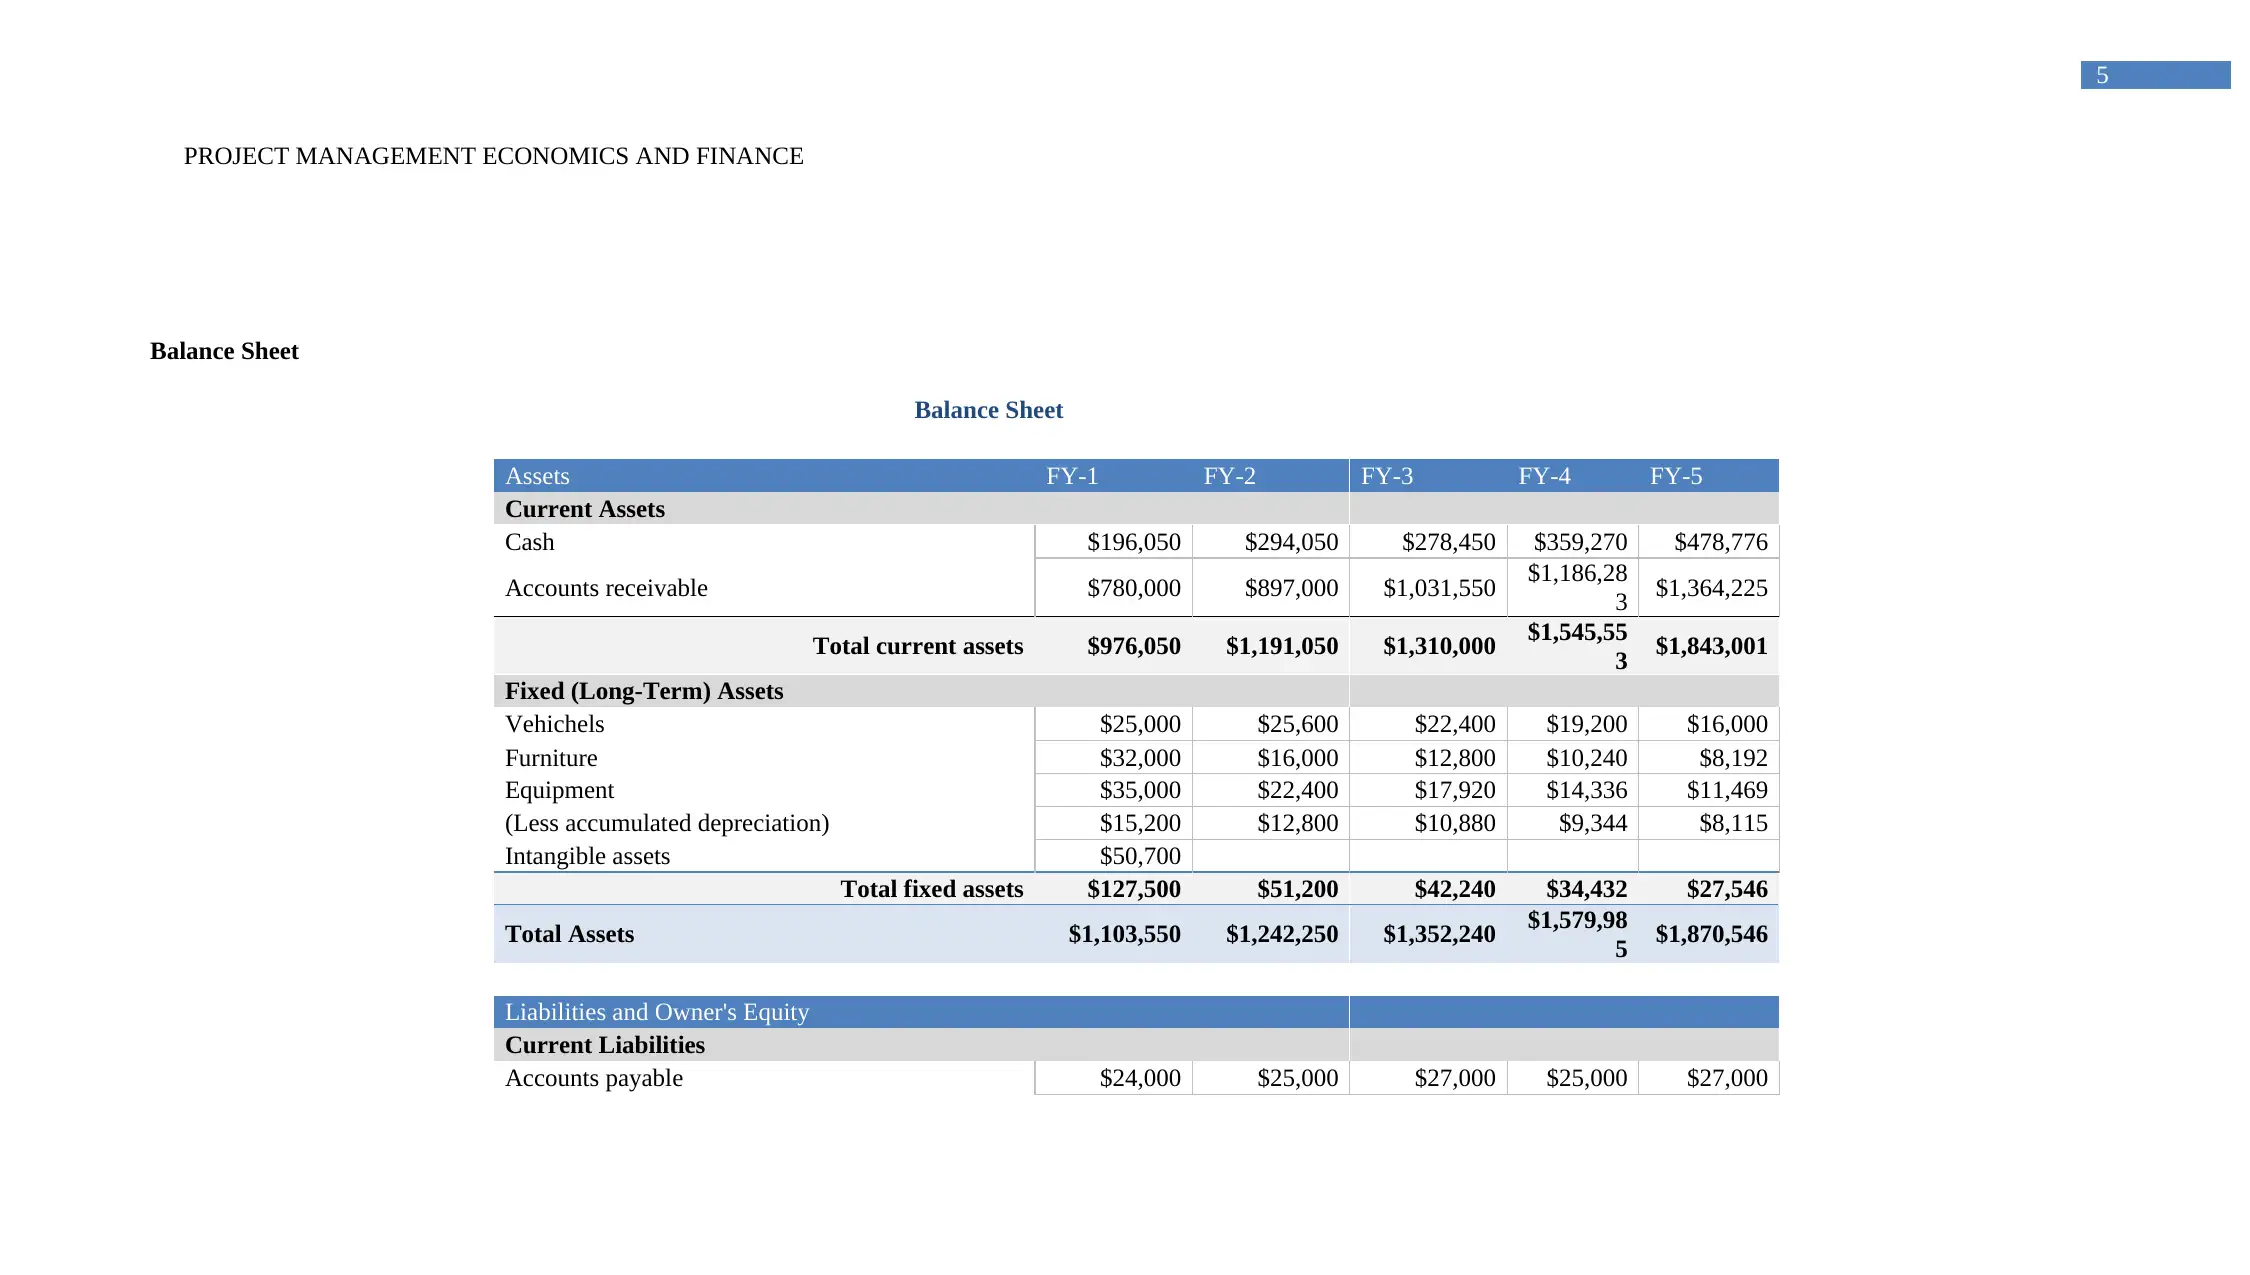
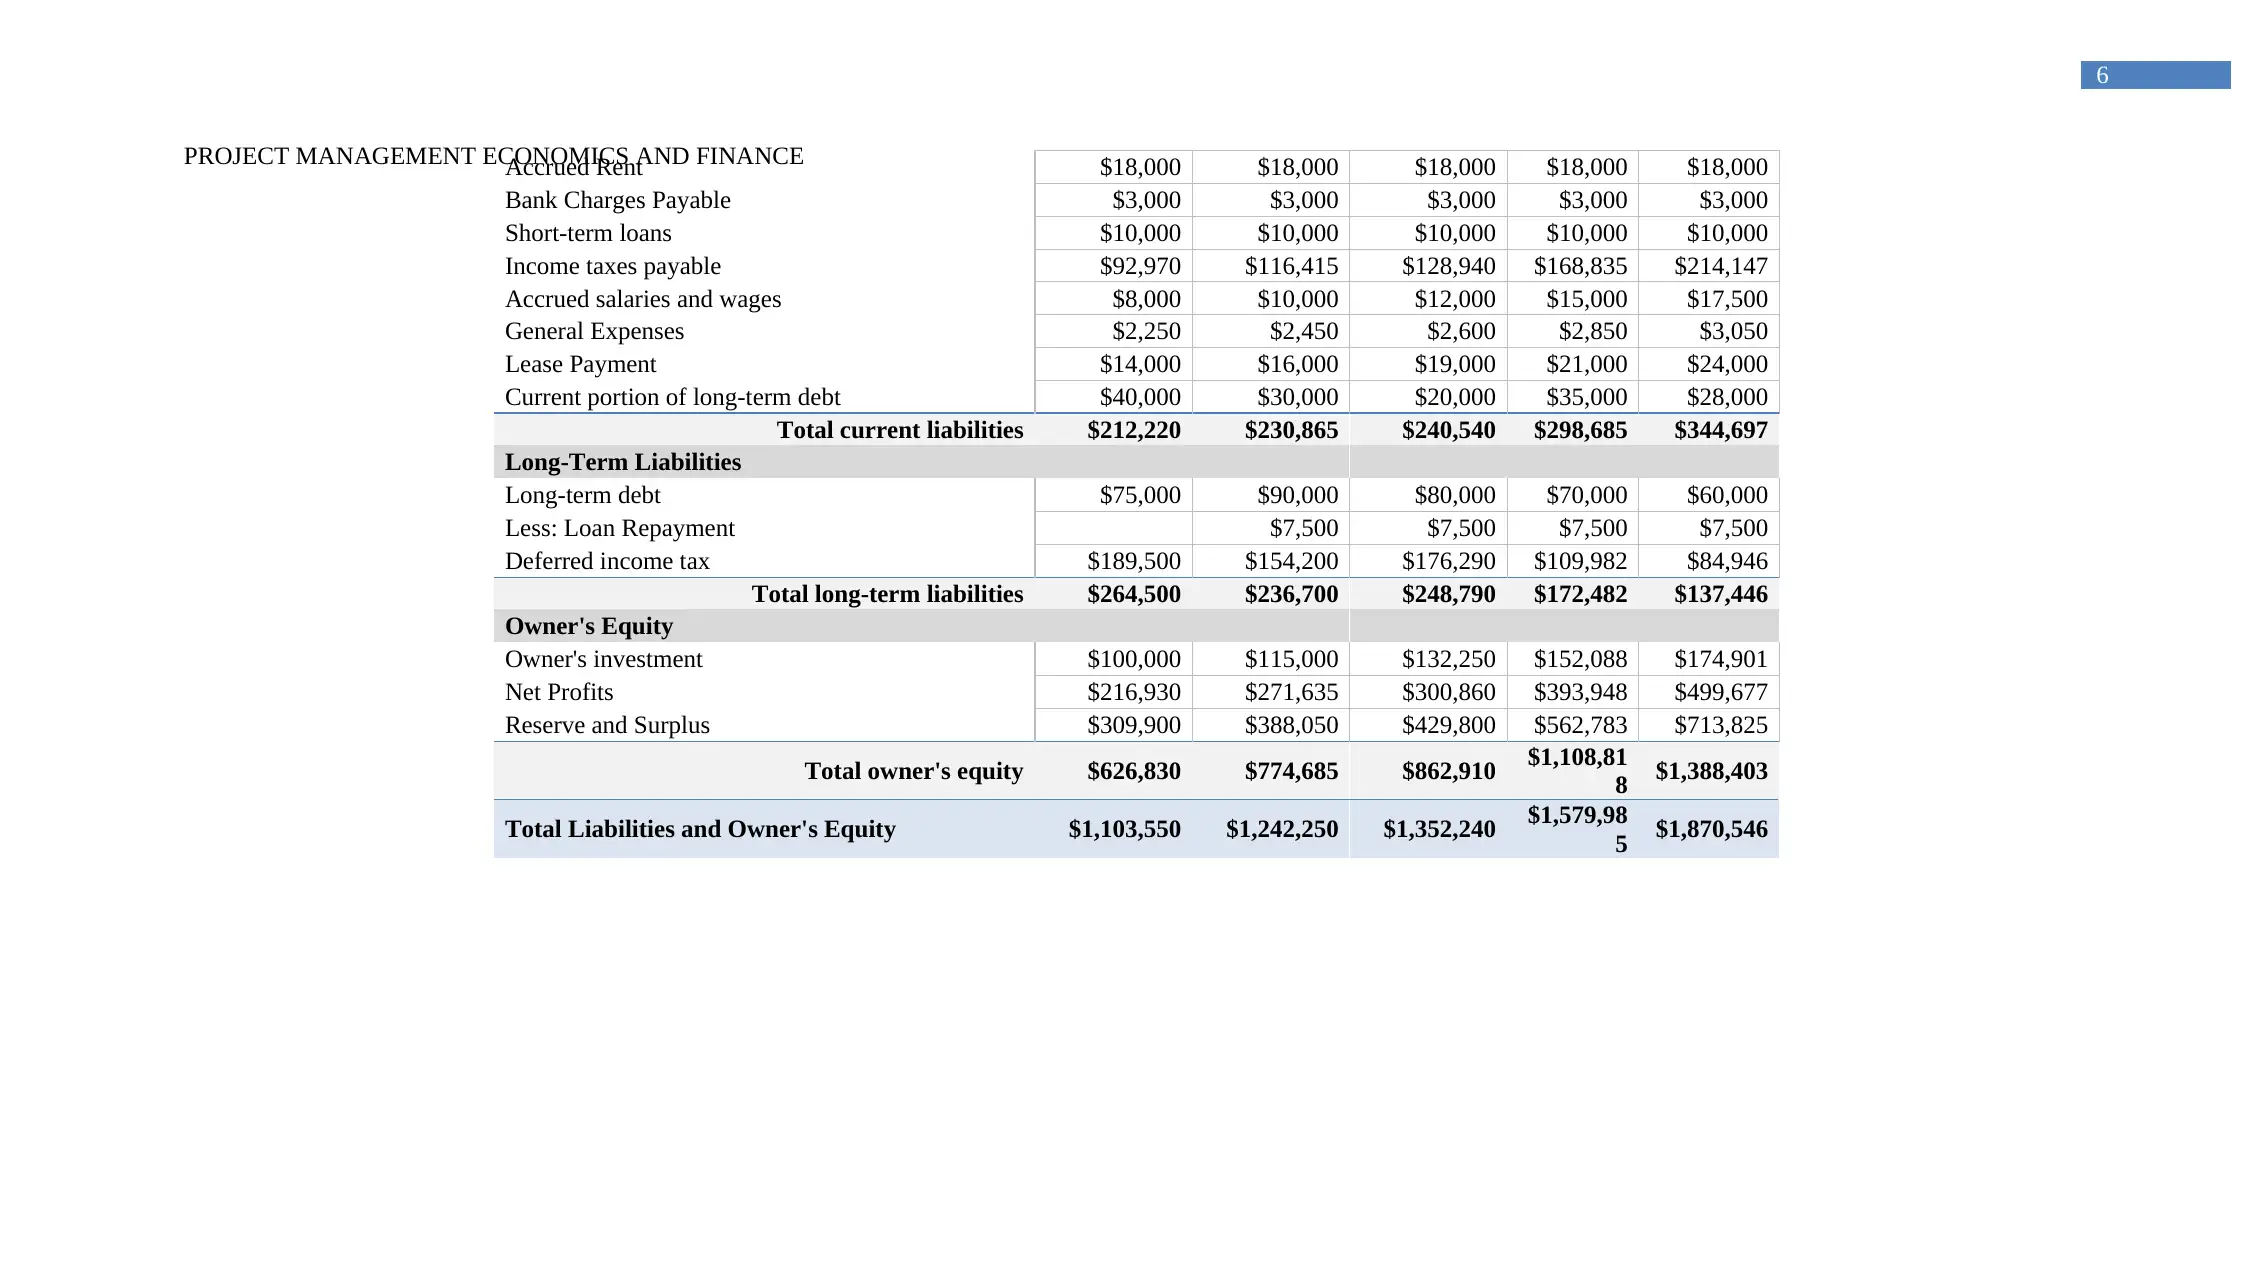
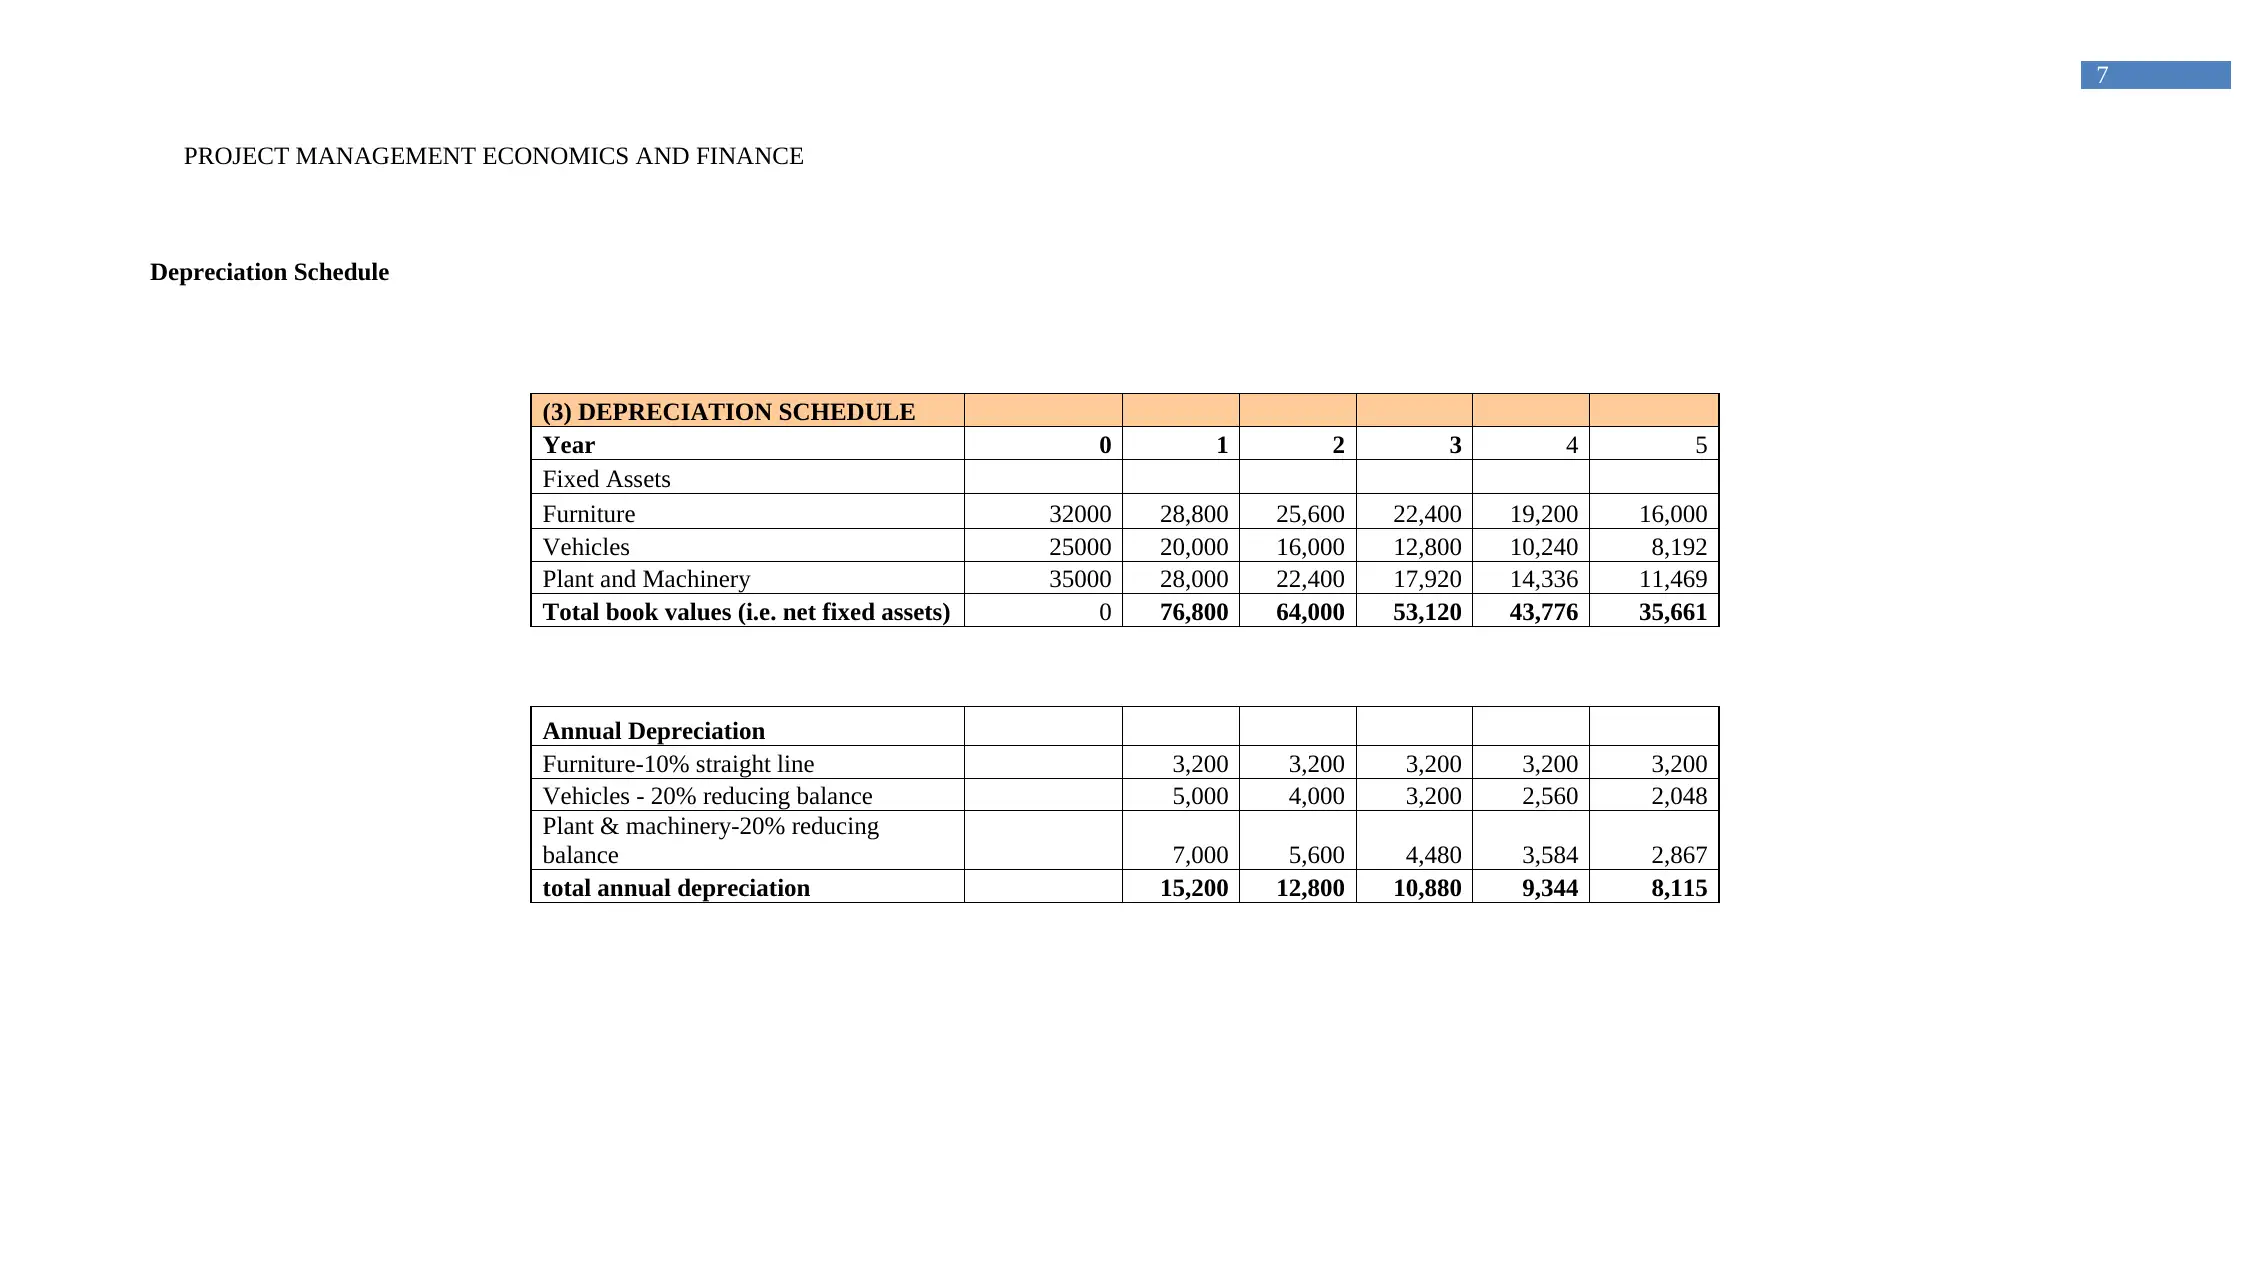
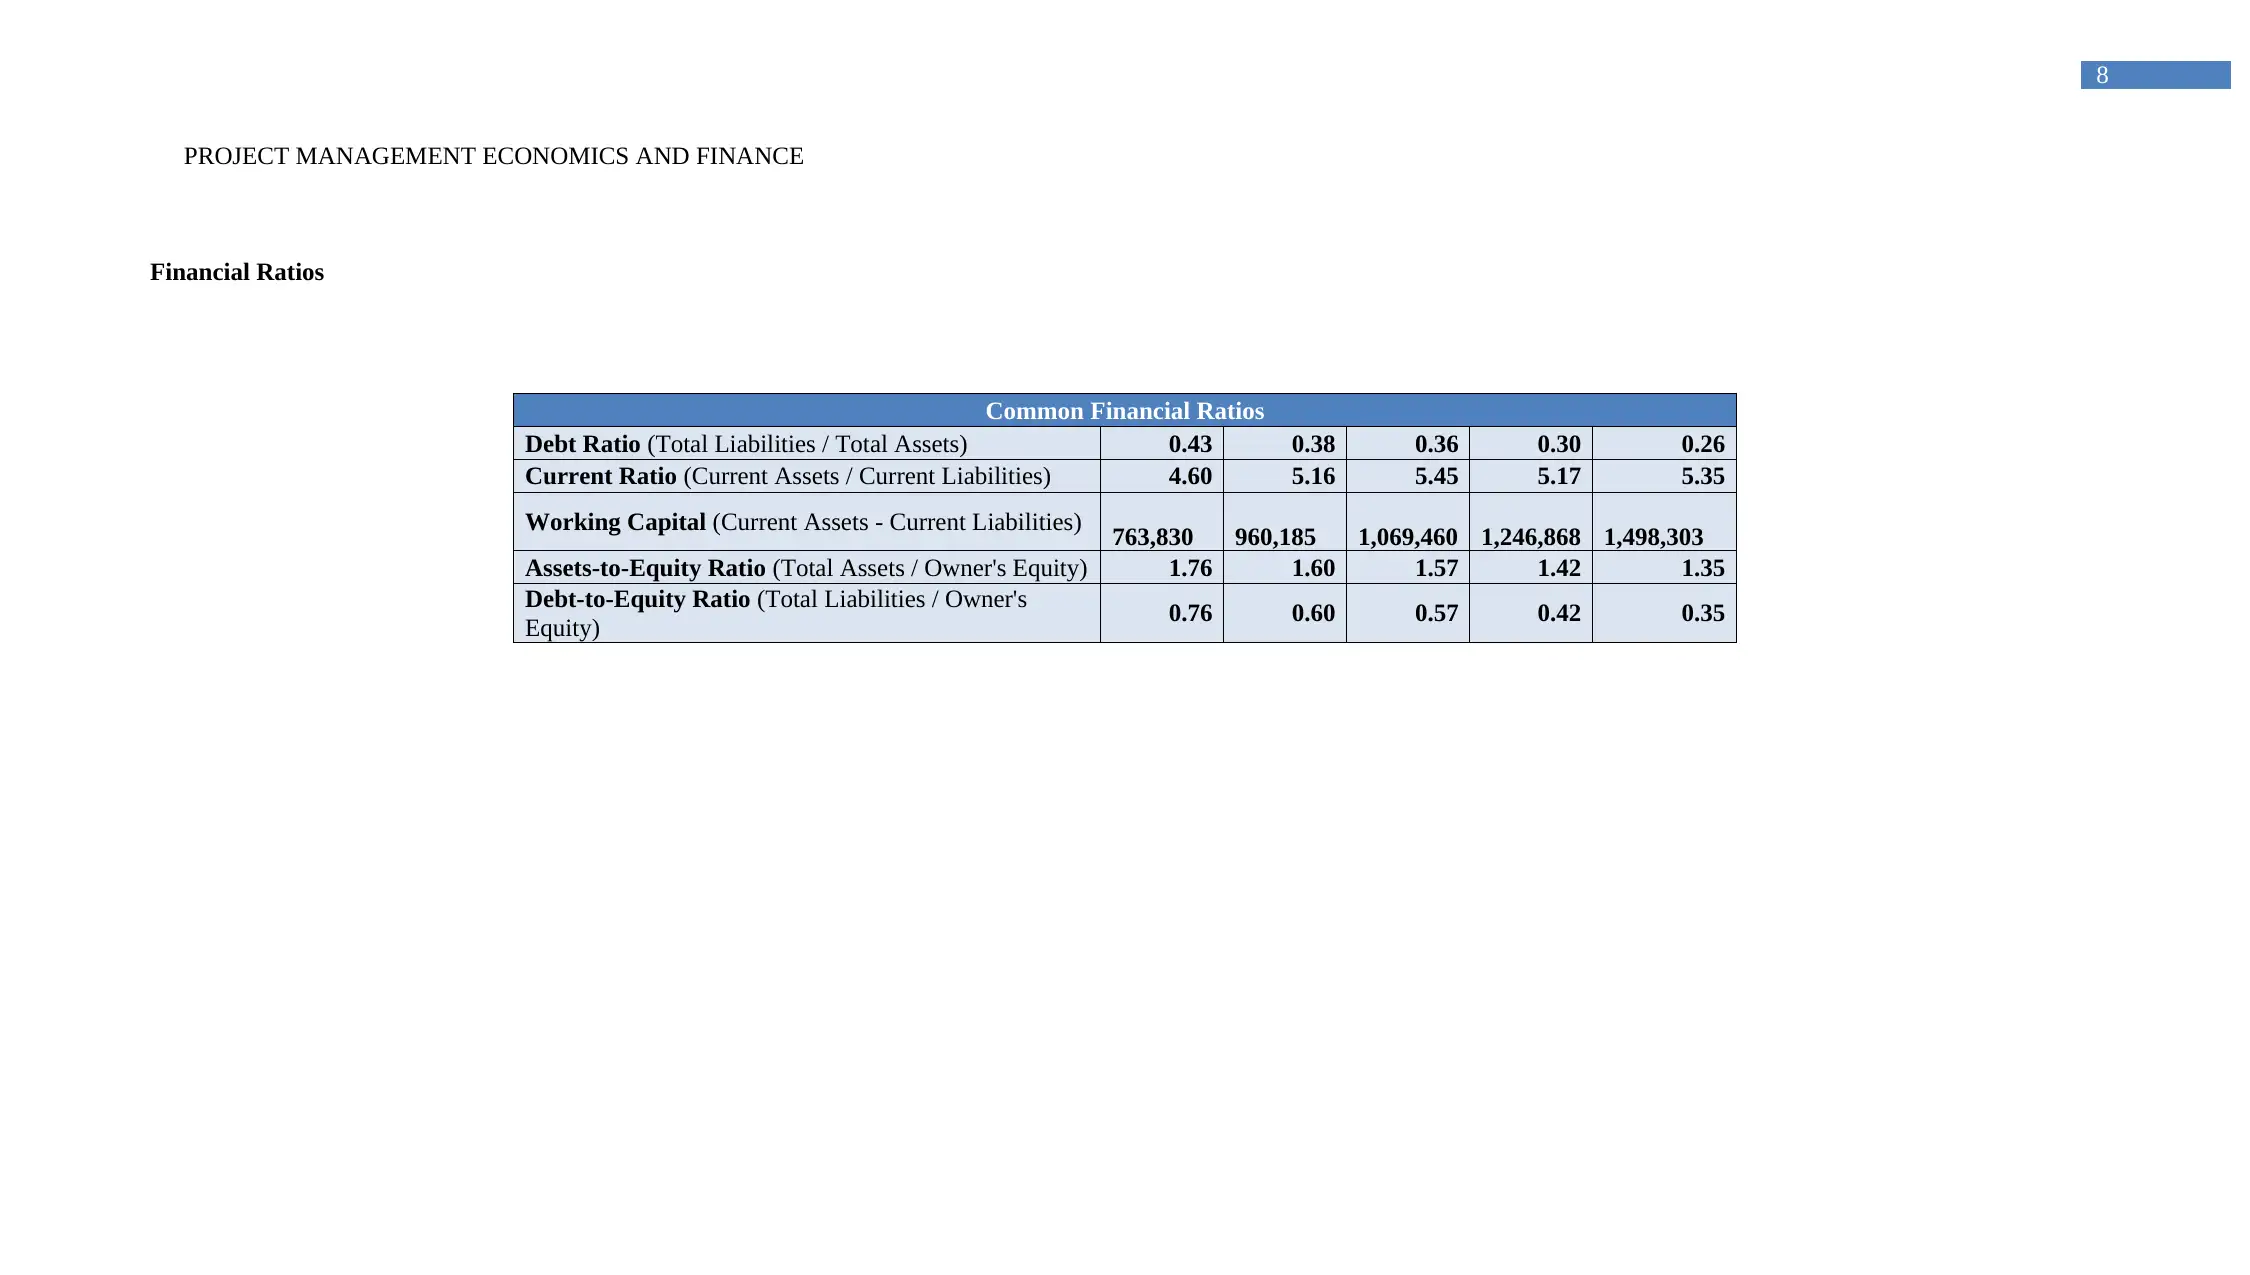
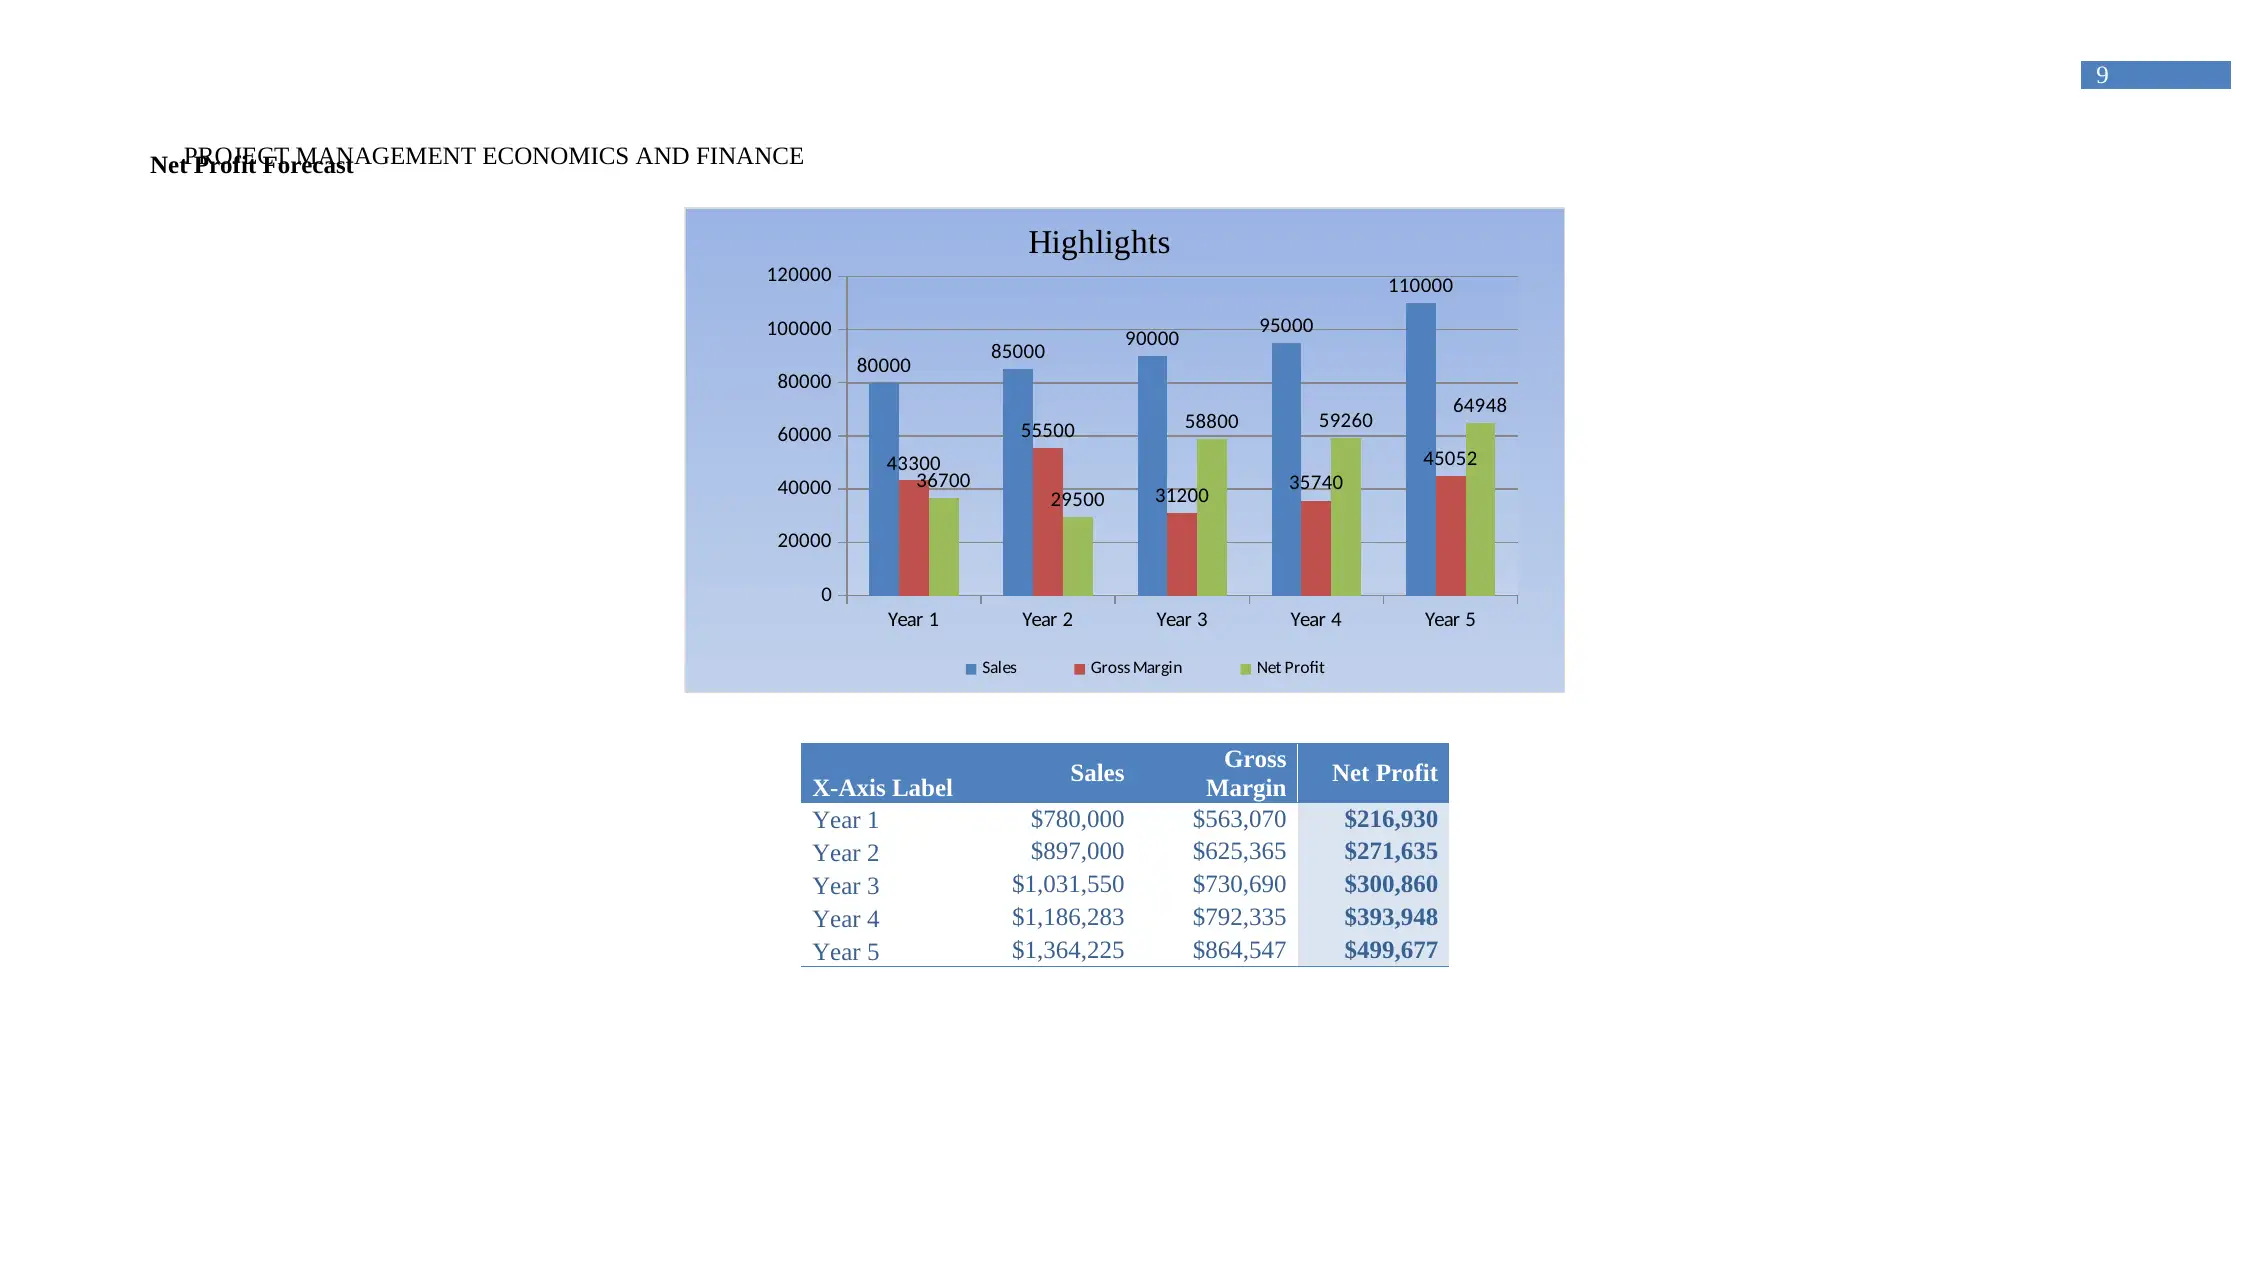
This project provides a comprehensive financial analysis of project management economics and finance. It begins with a detailed breakdown of start-up requirements, including expenses, assets, and funding sources. The core of the project involves the creation of projected financial statements, including an income statement spanning five years, detailing revenue, cost of sales, gross profit, expenses, and profit after tax. A cash flow statement is also presented, outlining cash inflows and outflows, net cash flow, and closing cash balances over the same five-year period. Furthermore, a balance sheet is constructed to assess the financial position, including current and fixed assets, liabilities, and owner's equity. A depreciation schedule is included to account for the depreciation of fixed assets. Financial ratios are calculated to evaluate the company's financial health, such as debt ratio, current ratio, and working capital. Finally, the project includes a net profit forecast and a detailed sales forecast for the first five years, broken down by month, providing a comprehensive view of the business's financial performance and projections. The project concludes with a list of references used for the financial analysis.
Document Page
Running head: PROJECT MANAGEMENT ECONOMICS AND FINANCE
Project Management Economics and Finance
Name of Student:
Name of University:
Author’s Note:
tabler-icon-diamond-filled.svg

Paraphrase This Document

Need a fresh take? Get an instant paraphrase of this document with our AI Paraphraser
Document Page
1
PROJECT MANAGEMENT ECONOMICS AND FINANCE
Table of Contents
Start-up Requirements.....................................................................................................................0
Projected Income Statement............................................................................................................2
Cash Flow Statement.......................................................................................................................3
Balance Sheet...................................................................................................................................5
Depreciation Schedule.....................................................................................................................7
Financial Ratios...............................................................................................................................8
Net Profit Forecast...........................................................................................................................8
Sales Forecast..................................................................................................................................9
Document Page
0
PROJECT MANAGEMENT ECONOMICS AND FINANCE
Start-up Requirements
Start-up Expenses
Fixed Costs Particulars Amount
($)
Premises (RENT & RATES) $18,000
Wages $8,000
Interest on loan 8% $7,500
Accountant Fees $20,000
Payroll Tax $3,800
Retainer contracts $15,000
Sales and Marketing $18,000
Postage & Telephone $1,650
Brouchers $2,500
Vehicle maintenance Cost $35,000
Operating cost $2,250
Market survey $1,975
Preliminary expenses $1,900
Lease payments $14,000
Total Fixed Costs $149,575
Average Monthly Costs
Rent $1,500
Lease payments $1,167
Interest on loan 3% $625
Document Page
1
PROJECT MANAGEMENT ECONOMICS AND FINANCE Postage & Telephone $138
Repairs and Maintenance $208
Salaries / Wages $667
Total Average Monthly
Costs $4,304
x Number of Months: 12
Total Monthly Costs $51,650
Total Startup Expenses $201,225
Start-up Assets
Owner Funding
Owners Fund $100,000
Total Owner Funding $100,000
Loans
Bank Loan $75,000
Other
Total Loans $75,000
Total Start up Funds $175,000
Assets
Equipment $32,000
Vehicles $25,000
Computer $35,000
Total Fixed Assets $92,000
Total Start-up Assets $267,000
tabler-icon-diamond-filled.svg

Paraphrase This Document

Need a fresh take? Get an instant paraphrase of this document with our AI Paraphraser
Document Page
2
PROJECT MANAGEMENT ECONOMICS AND FINANCE
Projected Income Statement
(4) PROFIT AND LOSS FORECAST
Year 1 2 3 4 5
Revenue 780,000 897,000 1,031,550 1,186,283 1,364,225
Cost of sales 330,000 375,000 460,000 460,000 480,000
Gross profit 450,000 522,000 571,550 726,283 884,225
Gross Margin 563,070 625,365 730,690 792,335 864,547
Expenses/overheads
Premises (rent, rates) 18,000 18,000 18,000 18,000 18,000
Wages and salaries 8,000 10,000 12,000 15,000 17,500
Operating cost 2,250 2,450 2,600 2,850 3,050
Accountant Fees 20,000 20,000 20,000 22,000 20,000
Payroll Tax 3,800 4,100 4,400 4,700 5,100
Utilities 15,000 17,500 20,000 22,500 25,000
Sales and Marketing 18,000 20,000 22,000 25,000 27,500
Postage & Telephone 1,650 1,850 2,150 2,350 2,600
Repairs and Maintenance 2,500 2,750 3,000 3,250 3,500
Document Page
3
PROJECT MANAGEMENT ECONOMICS AND FINANCE
Vehicle maintenance Cost 35,000 35,000 35,000 45,000 45,000
Preliminary expenses 1,900 2,300 2,600 2,850 3,150
Lease Payments 14,000 16,000 19,000 21,000 24,000
Total expenses/overheads 140,100 133,950 141,750 163,500 170,400
Profit before tax 309,900 388,050 429,800 562,783 713,825
Tax @ 30% 92,970 116,415 128,940 168,835 214,147
Profit after tax 216,930 271,635 300,860 393,948 499,677
Transfer to reserves 309,900 388,050 429,800 562,783 713,825
ROC 217% 272% 262% 298% 329%
Cash Flow Statement
(2) CASHFLOW FORECAST
Preop
Year 0 1 2 3 4 5
CASH INFLOWS
Cash from Sales 780,000 897,000
1,031,55
0
1,186,28
3 1,364,225
Directors loans 75,000 75,000 75,000 75,000 75,000 75,000
Capital Employed 100,000 100,000 115,000 132,250 152,088 174,901
Other cash inflows
Document Page
4
PROJECT MANAGEMENT ECONOMICS AND FINANCE
TOTAL CASH INFLOW 175,000 955,000
1,087,00
0
1,238,80
0
1,413,37
0 1,614,126
CASH OUTFLOWS
Payments for materials 330,000 375,000 460,000 460,000 480,000
operating expenses ( ) 0
Premises (rent, rates) 0 18,000 18,000 18,000 18,000 18,000
Wages and salaries 0 8,000 10,000 12,000 15,000 17,500
General expenses 0 2,250 2,450 2,600 2,850 3,050
Interest and bank charges payable 0 7,500 7,500 7,500 7,500 7,500
Lease payments 0 14,000 16,000 19,000 21,000 5000
Corporation Tax 92,970 116,415 128,940 168,835 214,147
Market survey costs 0 1,975 2,125 2,375 2,450 2,725
Other preliminary expenses 0 1,900 2,300 2,600 2,850 3,150
capital expenditure
Plant and Machinery 0 35,000 35,000 35,000 35,000 35,000
financing repayments
Loan repayments 7,500 7,500 7,500 7,500
TOTAL CASH OUTFLOWS 0 511,595 592,290 695,515 740,985 793,572
Cash flow summary
NET CASHFLOW FOR PERIOD 175,000 443,405 494,710 543,285 672,385 820,553
OPENING CASH BALANCE 0 175,000 618,405
1,113,11
5
1,656,40
0 2,328,785
CLOSING CASH BALANCE 175,000 618,405
1,113,11
5
1,656,40
0
2,328,78
5 3,149,338
tabler-icon-diamond-filled.svg

Paraphrase This Document

Need a fresh take? Get an instant paraphrase of this document with our AI Paraphraser
Document Page
5
PROJECT MANAGEMENT ECONOMICS AND FINANCE
Balance Sheet
Balance Sheet
Assets FY-1 FY-2 FY-3 FY-4 FY-5
Current Assets
Cash $196,050 $294,050 $278,450 $359,270 $478,776
Accounts receivable $780,000 $897,000 $1,031,550 $1,186,28
3 $1,364,225
Total current assets $976,050 $1,191,050 $1,310,000 $1,545,55
3 $1,843,001
Fixed (Long-Term) Assets
Vehichels $25,000 $25,600 $22,400 $19,200 $16,000
Furniture $32,000 $16,000 $12,800 $10,240 $8,192
Equipment $35,000 $22,400 $17,920 $14,336 $11,469
(Less accumulated depreciation) $15,200 $12,800 $10,880 $9,344 $8,115
Intangible assets $50,700
Total fixed assets $127,500 $51,200 $42,240 $34,432 $27,546
Total Assets $1,103,550 $1,242,250 $1,352,240 $1,579,98
5 $1,870,546
Liabilities and Owner's Equity
Current Liabilities
Accounts payable $24,000 $25,000 $27,000 $25,000 $27,000
Document Page
6
PROJECT MANAGEMENT ECONOMICS AND FINANCEAccrued Rent $18,000 $18,000 $18,000 $18,000 $18,000
Bank Charges Payable $3,000 $3,000 $3,000 $3,000 $3,000
Short-term loans $10,000 $10,000 $10,000 $10,000 $10,000
Income taxes payable $92,970 $116,415 $128,940 $168,835 $214,147
Accrued salaries and wages $8,000 $10,000 $12,000 $15,000 $17,500
General Expenses $2,250 $2,450 $2,600 $2,850 $3,050
Lease Payment $14,000 $16,000 $19,000 $21,000 $24,000
Current portion of long-term debt $40,000 $30,000 $20,000 $35,000 $28,000
Total current liabilities $212,220 $230,865 $240,540 $298,685 $344,697
Long-Term Liabilities
Long-term debt $75,000 $90,000 $80,000 $70,000 $60,000
Less: Loan Repayment $7,500 $7,500 $7,500 $7,500
Deferred income tax $189,500 $154,200 $176,290 $109,982 $84,946
Total long-term liabilities $264,500 $236,700 $248,790 $172,482 $137,446
Owner's Equity
Owner's investment $100,000 $115,000 $132,250 $152,088 $174,901
Net Profits $216,930 $271,635 $300,860 $393,948 $499,677
Reserve and Surplus $309,900 $388,050 $429,800 $562,783 $713,825
Total owner's equity $626,830 $774,685 $862,910 $1,108,81
8 $1,388,403
Total Liabilities and Owner's Equity $1,103,550 $1,242,250 $1,352,240 $1,579,98
5 $1,870,546
Document Page
7
PROJECT MANAGEMENT ECONOMICS AND FINANCE
Depreciation Schedule
(3) DEPRECIATION SCHEDULE
Year 0 1 2 3 4 5
Fixed Assets
Furniture 32000 28,800 25,600 22,400 19,200 16,000
Vehicles 25000 20,000 16,000 12,800 10,240 8,192
Plant and Machinery 35000 28,000 22,400 17,920 14,336 11,469
Total book values (i.e. net fixed assets) 0 76,800 64,000 53,120 43,776 35,661
Annual Depreciation
Furniture-10% straight line 3,200 3,200 3,200 3,200 3,200
Vehicles - 20% reducing balance 5,000 4,000 3,200 2,560 2,048
Plant & machinery-20% reducing
balance 7,000 5,600 4,480 3,584 2,867
total annual depreciation 15,200 12,800 10,880 9,344 8,115
tabler-icon-diamond-filled.svg

Paraphrase This Document

Need a fresh take? Get an instant paraphrase of this document with our AI Paraphraser
Document Page
8
PROJECT MANAGEMENT ECONOMICS AND FINANCE
Financial Ratios
Common Financial Ratios
Debt Ratio (Total Liabilities / Total Assets) 0.43 0.38 0.36 0.30 0.26
Current Ratio (Current Assets / Current Liabilities) 4.60 5.16 5.45 5.17 5.35
Working Capital (Current Assets - Current Liabilities) 763,830 960,185 1,069,460 1,246,868 1,498,303
Assets-to-Equity Ratio (Total Assets / Owner's Equity) 1.76 1.60 1.57 1.42 1.35
Debt-to-Equity Ratio (Total Liabilities / Owner's
Equity) 0.76 0.60 0.57 0.42 0.35
Document Page
9
PROJECT MANAGEMENT ECONOMICS AND FINANCENet Profit Forecast
Year 1 Year 2 Year 3 Year 4 Year 5
0
20000
40000
60000
80000
100000
120000
80000 85000 90000 95000
110000
43300
55500
31200 35740
45052
36700 29500
58800 59260 64948
Highlights
Sales Gross Margin Net Profit
X-Axis Label Sales Gross
Margin Net Profit
Year 1 $780,000 $563,070 $216,930
Year 2 $897,000 $625,365 $271,635
Year 3 $1,031,550 $730,690 $300,860
Year 4 $1,186,283 $792,335 $393,948
Year 5 $1,364,225 $864,547 $499,677
chevron_up_icon
1 out of 15
circle_padding
hide_on_mobile
zoom_out_icon
[object Object]