University Project Management Fundamentals Report, BT7073, Autumn 2018
VerifiedAdded on 2023/05/31
|31
|6225
|154
Report
AI Summary
This report, a consultancy report on project management, begins with an introduction outlining the DBCL Engineering case study involving the Pretoria Oil project. It then delves into project definition, emphasizing the importance of the Iron Triangle (scope, time, cost, and quality) and risk management, including a detailed risk register. The report then covers project planning, including the DBCL project manager's plan, network diagrams, critical path analysis with slack calculations, and Gantt charts with project calibration. It further explores cost analysis, including projected gross profit. The report then shifts to managing progress and spending, including a table of actual vs. planned progress. It concludes with an Earned Value Analysis, including tables and methods for estimating at completion (schedule and cost), and a reflective essay, along with a bibliography. The report analyzes project parameters, risks, planning, costs, progress management, and earned value analysis, providing a comprehensive overview of project management principles and their practical application in a real-world case study.
1
FUNDAMENTALS OF PROJECT MANAGEMENT
Fundamentals of Project Management (BT7073)
Autumn Term 2018
Name of the Student
Name of the University
Author Note
Total words: 3800
FUNDAMENTALS OF PROJECT MANAGEMENT
Fundamentals of Project Management (BT7073)
Autumn Term 2018
Name of the Student
Name of the University
Author Note
Total words: 3800
Paraphrase This Document
Need a fresh take? Get an instant paraphrase of this document with our AI Paraphraser
2
FUNDAMENTALS OF PROJECT MANAGEMENT
Table of Contents
Introduction................................................................................................................................4
1. Project definition/Parameters and risks..................................................................................4
1.1 Iron Triangle Parameters’ Importance for DBCL Project Manager................................4
1.2 Risk Register....................................................................................................................6
2. Planning and costs................................................................................................................12
2.1 DBCL project manager’s project plan...........................................................................12
2.2Network Diagram............................................................................................................13
2.2.1 Critical path with slack calculation of all non-critical activities:............................14
2.3 Gantt chart with project calibration................................................................................15
2.3.1 Project activities with scheduled start and completion:..........................................16
2.4 Projected gross profit for the contract............................................................................17
3. Managing progress and spending.........................................................................................17
3.1 Table of actual v/s planned............................................................................................18
4. Earned Value Analysis and Acceleration.............................................................................20
4.1 Create an Earned Value Analysis Table.........................................................................20
4.2Estimate at Completion (schedule) method derived from the Earned Value Analysis...21
4.3 Estimate at Completion (cost) method derived from the Earned Value Analysis.........22
4.4 Comparison of the values...............................................................................................24
Analysis on selection:..........................................................................................................24
Slack Calculation:................................................................................................................25
Network Diagram.................................................................................................................26
Commercial impact..................................................................................................................27
Conclusion................................................................................................................................29
Section B: Reflective essay......................................................................................................29
Bibliography.............................................................................................................................32
3
FUNDAMENTALS OF PROJECT MANAGEMENT
SECTION A: DBCL case study Consultancy Report
Introduction
The purpose of this report is to demonstrate the ability of the decision making
regarding the overall delivery and management of an entire project. DBCL Engineering, a
marine and offshore construction company operates in the large fabrication yard on the North
East Cost of England. Pretoria Oil project is won by the DBLC Company that is expected to
be delivered before 21st September 2018. Project managing includes an extended knowledge
on the best practices and decision-making that can enhance the productivity of the project and
manages to deliver the project within the estimated constraints. Considering the deployment
of this project, project planning and management needs to delivered in an efficient and
effective way as the company can have high penalties of the project is not delivered within
time and proposed budget. This is highly deemed project for the DBCL Company and hence,
the planning is being proposed in this project.
1. Project definition/Parameters and risks
1.1 Iron Triangle Parameters’ Importance for DBCL Project Manager
The project manager needs to consider the project scope, time, cost and quality as the
most critical factors for the successful and efficient delivery of the project. ‘Iron triangle’ is
being represented as the “metaphor pointing out that the project manager is asked to reach a
reasonable trade-off among various concurrent, heterogeneous, and visible constraints
(Muller 2017).” The traditional iron triangle can be demonstrated as schedule, budget, scope
and quality of the project.
⊘ This is a preview!⊘
Do you want full access?
Subscribe today to unlock all pages.
Trusted by 1+ million students worldwide
4
FUNDAMENTALS OF PROJECT MANAGEMENT
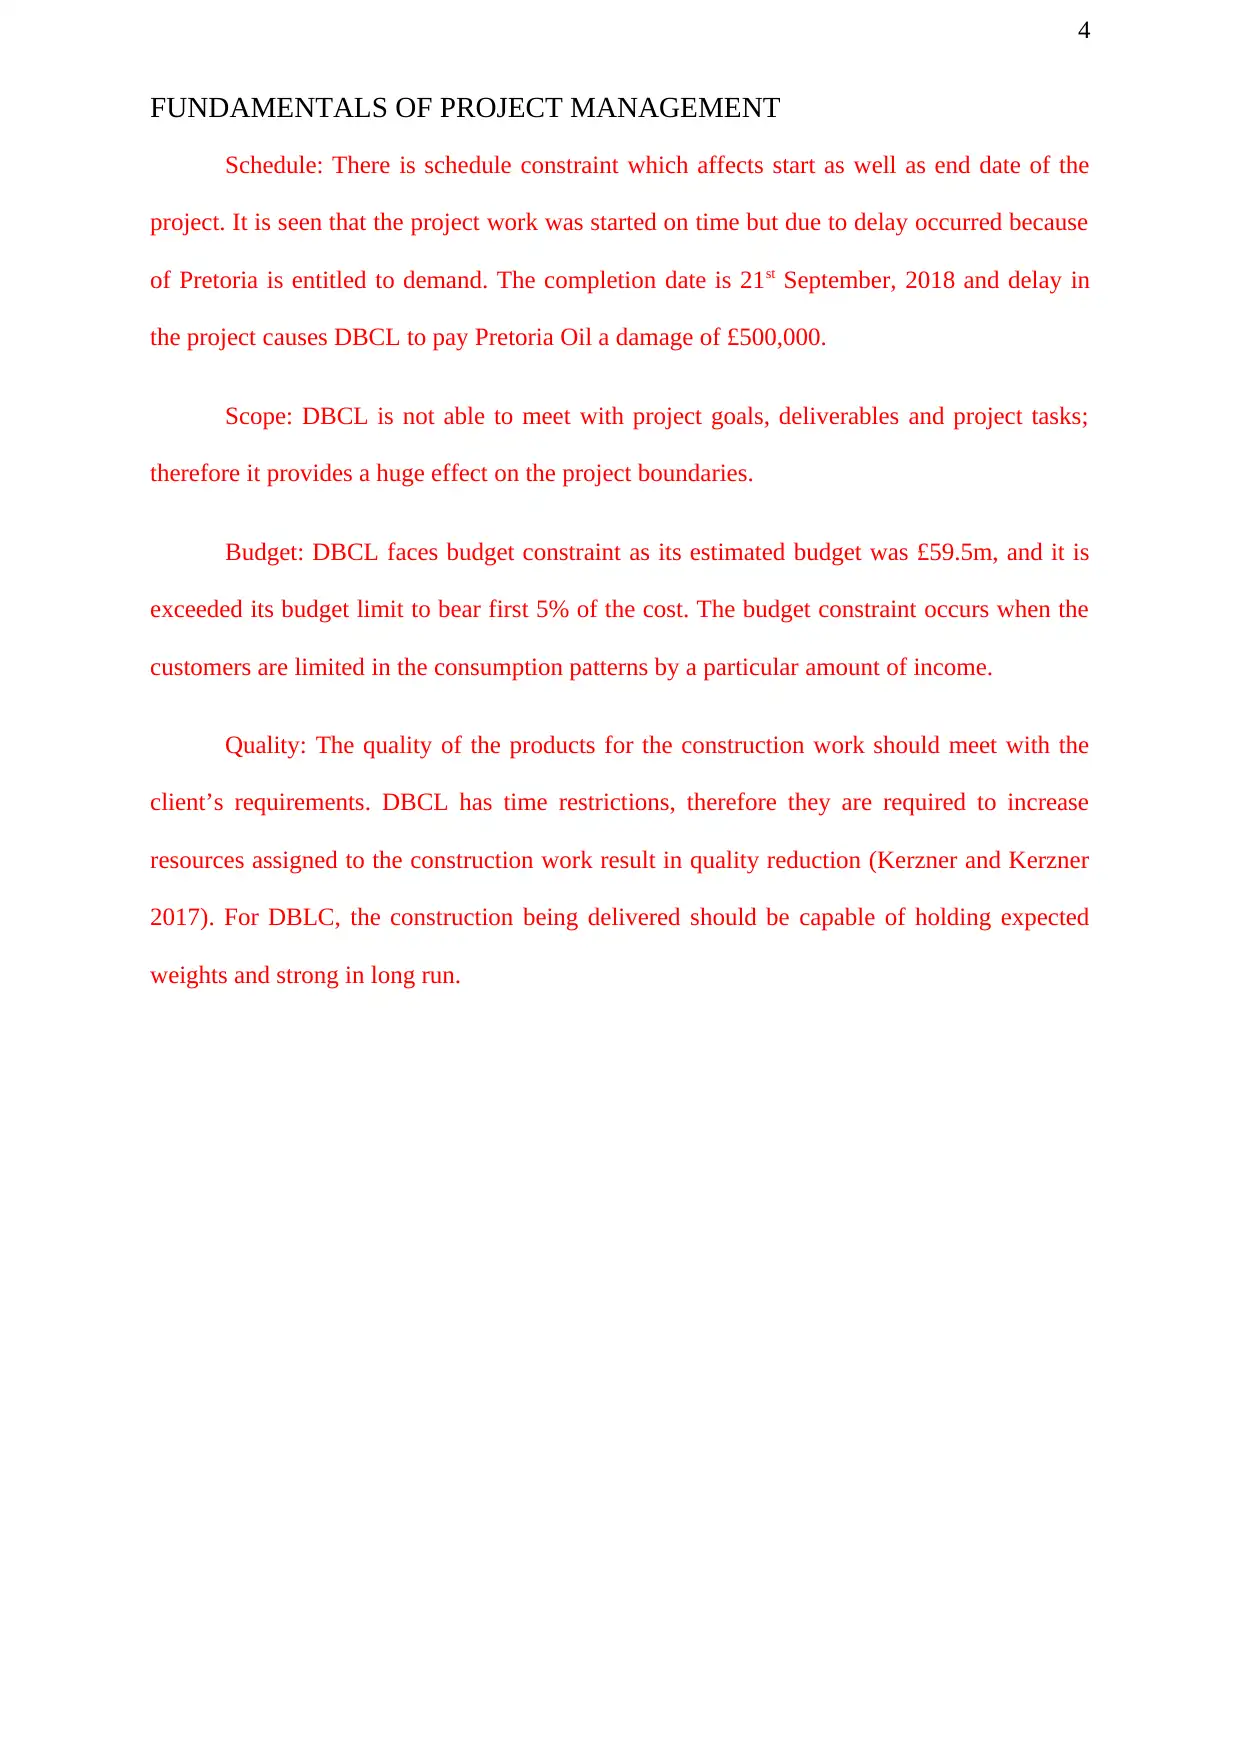
Schedule: There is schedule constraint which affects start as well as end date of the
project. It is seen that the project work was started on time but due to delay occurred because
of Pretoria is entitled to demand. The completion date is 21st September, 2018 and delay in
the project causes DBCL to pay Pretoria Oil a damage of £500,000.
Scope: DBCL is not able to meet with project goals, deliverables and project tasks;
therefore it provides a huge effect on the project boundaries.
Budget: DBCL faces budget constraint as its estimated budget was £59.5m, and it is
exceeded its budget limit to bear first 5% of the cost. The budget constraint occurs when the
customers are limited in the consumption patterns by a particular amount of income.
Quality: The quality of the products for the construction work should meet with the
client’s requirements. DBCL has time restrictions, therefore they are required to increase
resources assigned to the construction work result in quality reduction (Kerzner and Kerzner
2017). For DBLC, the construction being delivered should be capable of holding expected
weights and strong in long run.
FUNDAMENTALS OF PROJECT MANAGEMENT
Schedule: There is schedule constraint which affects start as well as end date of the
project. It is seen that the project work was started on time but due to delay occurred because
of Pretoria is entitled to demand. The completion date is 21st September, 2018 and delay in
the project causes DBCL to pay Pretoria Oil a damage of £500,000.
Scope: DBCL is not able to meet with project goals, deliverables and project tasks;
therefore it provides a huge effect on the project boundaries.
Budget: DBCL faces budget constraint as its estimated budget was £59.5m, and it is
exceeded its budget limit to bear first 5% of the cost. The budget constraint occurs when the
customers are limited in the consumption patterns by a particular amount of income.
Quality: The quality of the products for the construction work should meet with the
client’s requirements. DBCL has time restrictions, therefore they are required to increase
resources assigned to the construction work result in quality reduction (Kerzner and Kerzner
2017). For DBLC, the construction being delivered should be capable of holding expected
weights and strong in long run.
Paraphrase This Document
Need a fresh take? Get an instant paraphrase of this document with our AI Paraphraser
5
FUNDAMENTALS OF PROJECT MANAGEMENT
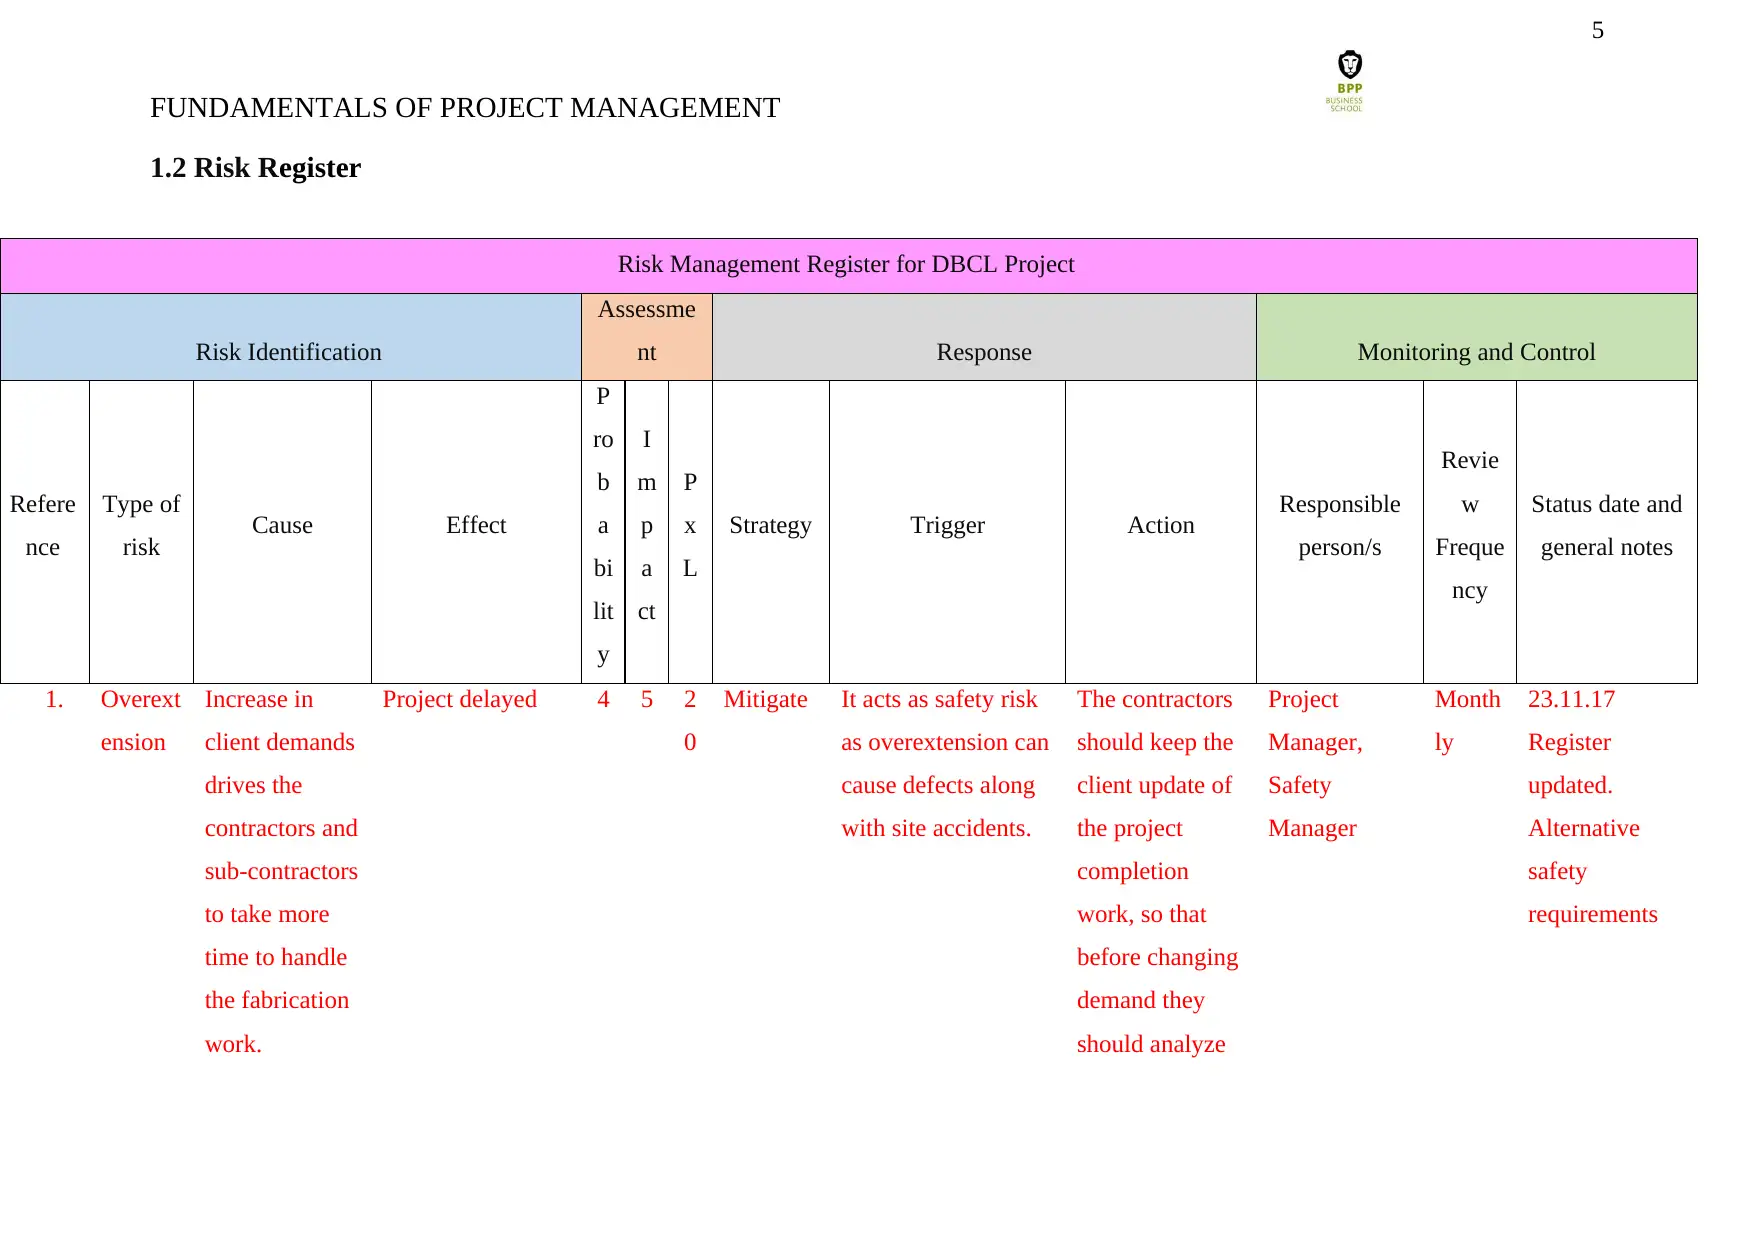
1.2 Risk Register
Risk Management Register for DBCL Project
Risk Identification
Assessme
nt Response Monitoring and Control
Refere
nce
Type of
risk Cause Effect
P
ro
b
a
bi
lit
y
I
m
p
a
ct
P
x
L
Strategy Trigger Action Responsible
person/s
Revie
w
Freque
ncy
Status date and
general notes
1. Overext
ension
Increase in
client demands
drives the
contractors and
sub-contractors
to take more
time to handle
the fabrication
work.
Project delayed 4 5 2
0
Mitigate It acts as safety risk
as overextension can
cause defects along
with site accidents.
The contractors
should keep the
client update of
the project
completion
work, so that
before changing
demand they
should analyze
Project
Manager,
Safety
Manager
Month
ly
23.11.17
Register
updated.
Alternative
safety
requirements
FUNDAMENTALS OF PROJECT MANAGEMENT
1.2 Risk Register
Risk Management Register for DBCL Project
Risk Identification
Assessme
nt Response Monitoring and Control
Refere
nce
Type of
risk Cause Effect
P
ro
b
a
bi
lit
y
I
m
p
a
ct
P
x
L
Strategy Trigger Action Responsible
person/s
Revie
w
Freque
ncy
Status date and
general notes
1. Overext
ension
Increase in
client demands
drives the
contractors and
sub-contractors
to take more
time to handle
the fabrication
work.
Project delayed 4 5 2
0
Mitigate It acts as safety risk
as overextension can
cause defects along
with site accidents.
The contractors
should keep the
client update of
the project
completion
work, so that
before changing
demand they
should analyze
Project
Manager,
Safety
Manager
Month
ly
23.11.17
Register
updated.
Alternative
safety
requirements
6
FUNDAMENTALS OF PROJECT MANAGEMENT
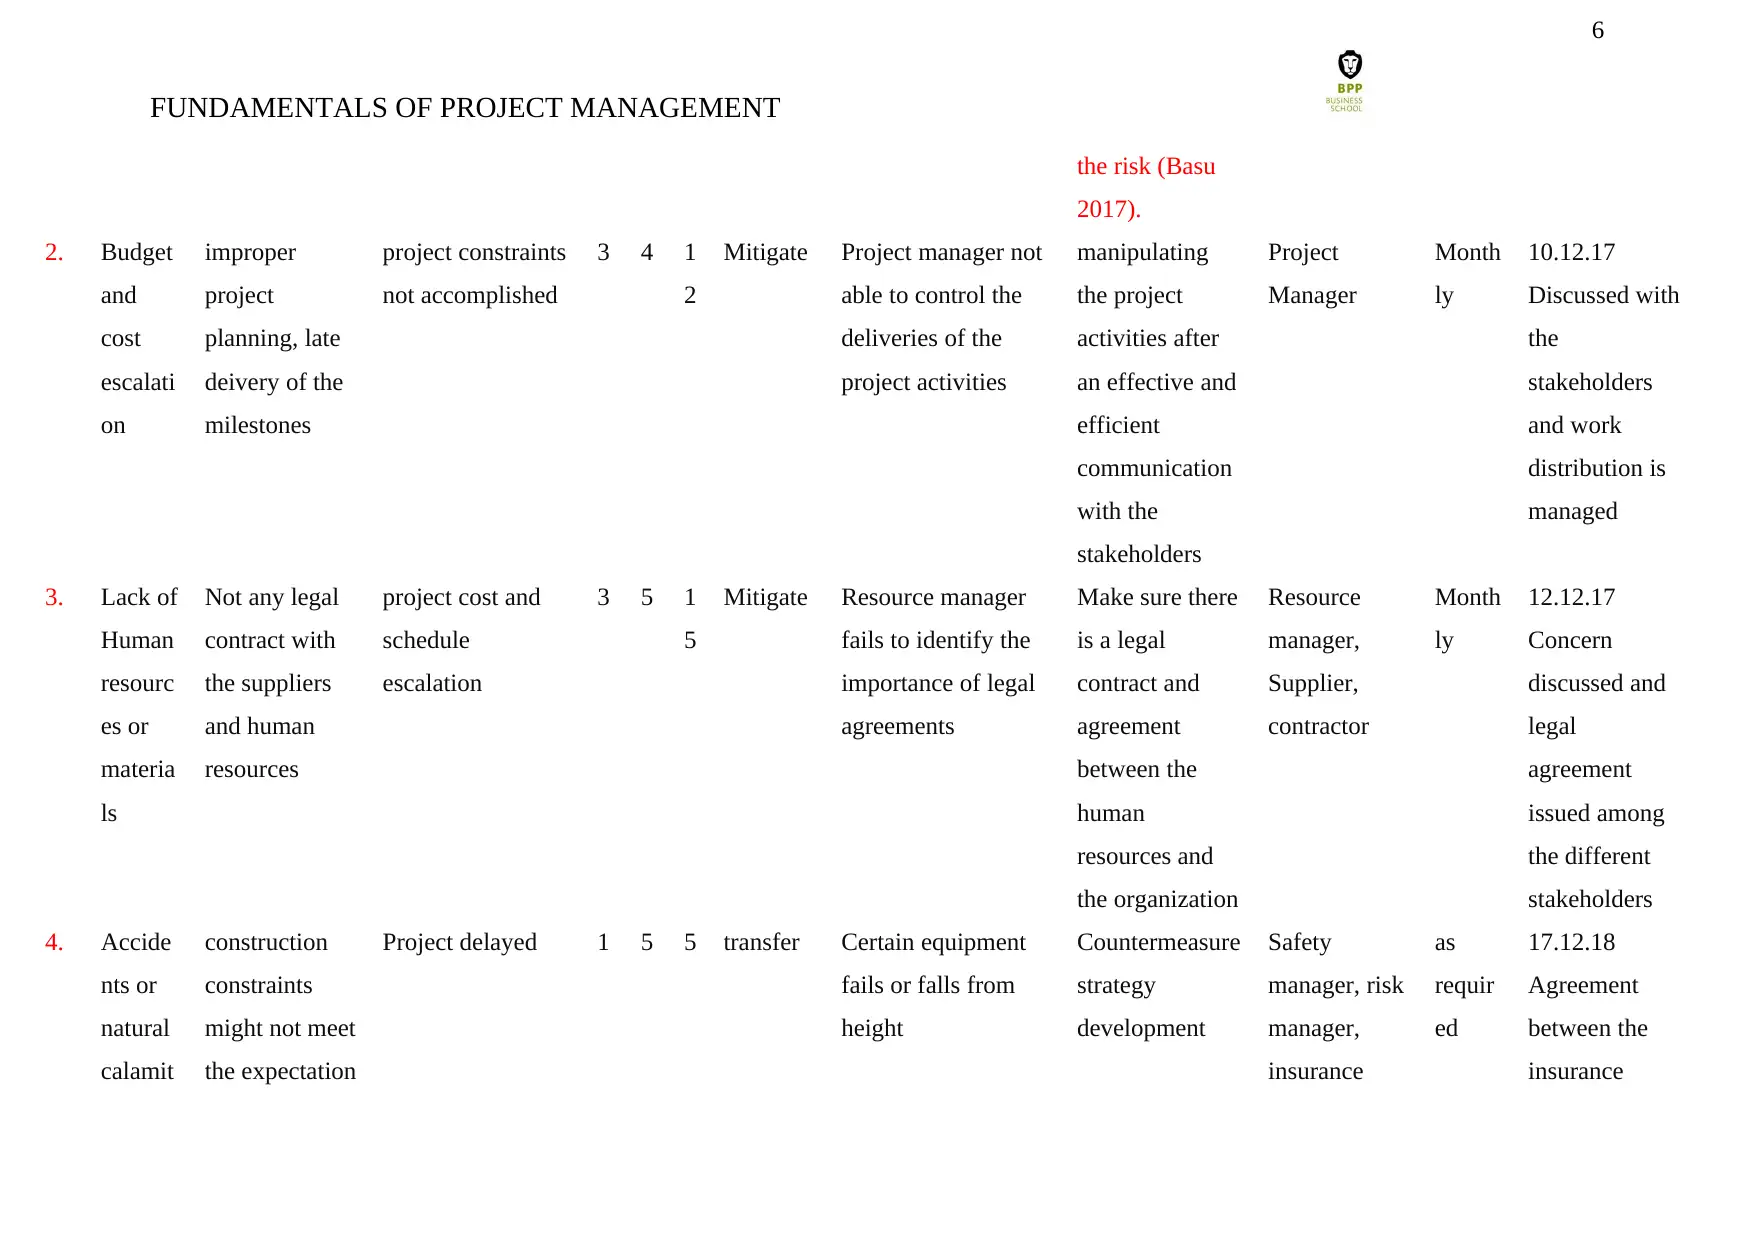
the risk (Basu
2017).
2. Budget
and
cost
escalati
on
improper
project
planning, late
deivery of the
milestones
project constraints
not accomplished
3 4 1
2
Mitigate Project manager not
able to control the
deliveries of the
project activities
manipulating
the project
activities after
an effective and
efficient
communication
with the
stakeholders
Project
Manager
Month
ly
10.12.17
Discussed with
the
stakeholders
and work
distribution is
managed
3. Lack of
Human
resourc
es or
materia
ls
Not any legal
contract with
the suppliers
and human
resources
project cost and
schedule
escalation
3 5 1
5
Mitigate Resource manager
fails to identify the
importance of legal
agreements
Make sure there
is a legal
contract and
agreement
between the
human
resources and
the organization
Resource
manager,
Supplier,
contractor
Month
ly
12.12.17
Concern
discussed and
legal
agreement
issued among
the different
stakeholders
4. Accide
nts or
natural
calamit
construction
constraints
might not meet
the expectation
Project delayed 1 5 5 transfer Certain equipment
fails or falls from
height
Countermeasure
strategy
development
Safety
manager, risk
manager,
insurance
as
requir
ed
17.12.18
Agreement
between the
insurance
FUNDAMENTALS OF PROJECT MANAGEMENT
the risk (Basu
2017).
2. Budget
and
cost
escalati
on
improper
project
planning, late
deivery of the
milestones
project constraints
not accomplished
3 4 1
2
Mitigate Project manager not
able to control the
deliveries of the
project activities
manipulating
the project
activities after
an effective and
efficient
communication
with the
stakeholders
Project
Manager
Month
ly
10.12.17
Discussed with
the
stakeholders
and work
distribution is
managed
3. Lack of
Human
resourc
es or
materia
ls
Not any legal
contract with
the suppliers
and human
resources
project cost and
schedule
escalation
3 5 1
5
Mitigate Resource manager
fails to identify the
importance of legal
agreements
Make sure there
is a legal
contract and
agreement
between the
human
resources and
the organization
Resource
manager,
Supplier,
contractor
Month
ly
12.12.17
Concern
discussed and
legal
agreement
issued among
the different
stakeholders
4. Accide
nts or
natural
calamit
construction
constraints
might not meet
the expectation
Project delayed 1 5 5 transfer Certain equipment
fails or falls from
height
Countermeasure
strategy
development
Safety
manager, risk
manager,
insurance
as
requir
ed
17.12.18
Agreement
between the
insurance
⊘ This is a preview!⊘
Do you want full access?
Subscribe today to unlock all pages.
Trusted by 1+ million students worldwide
7
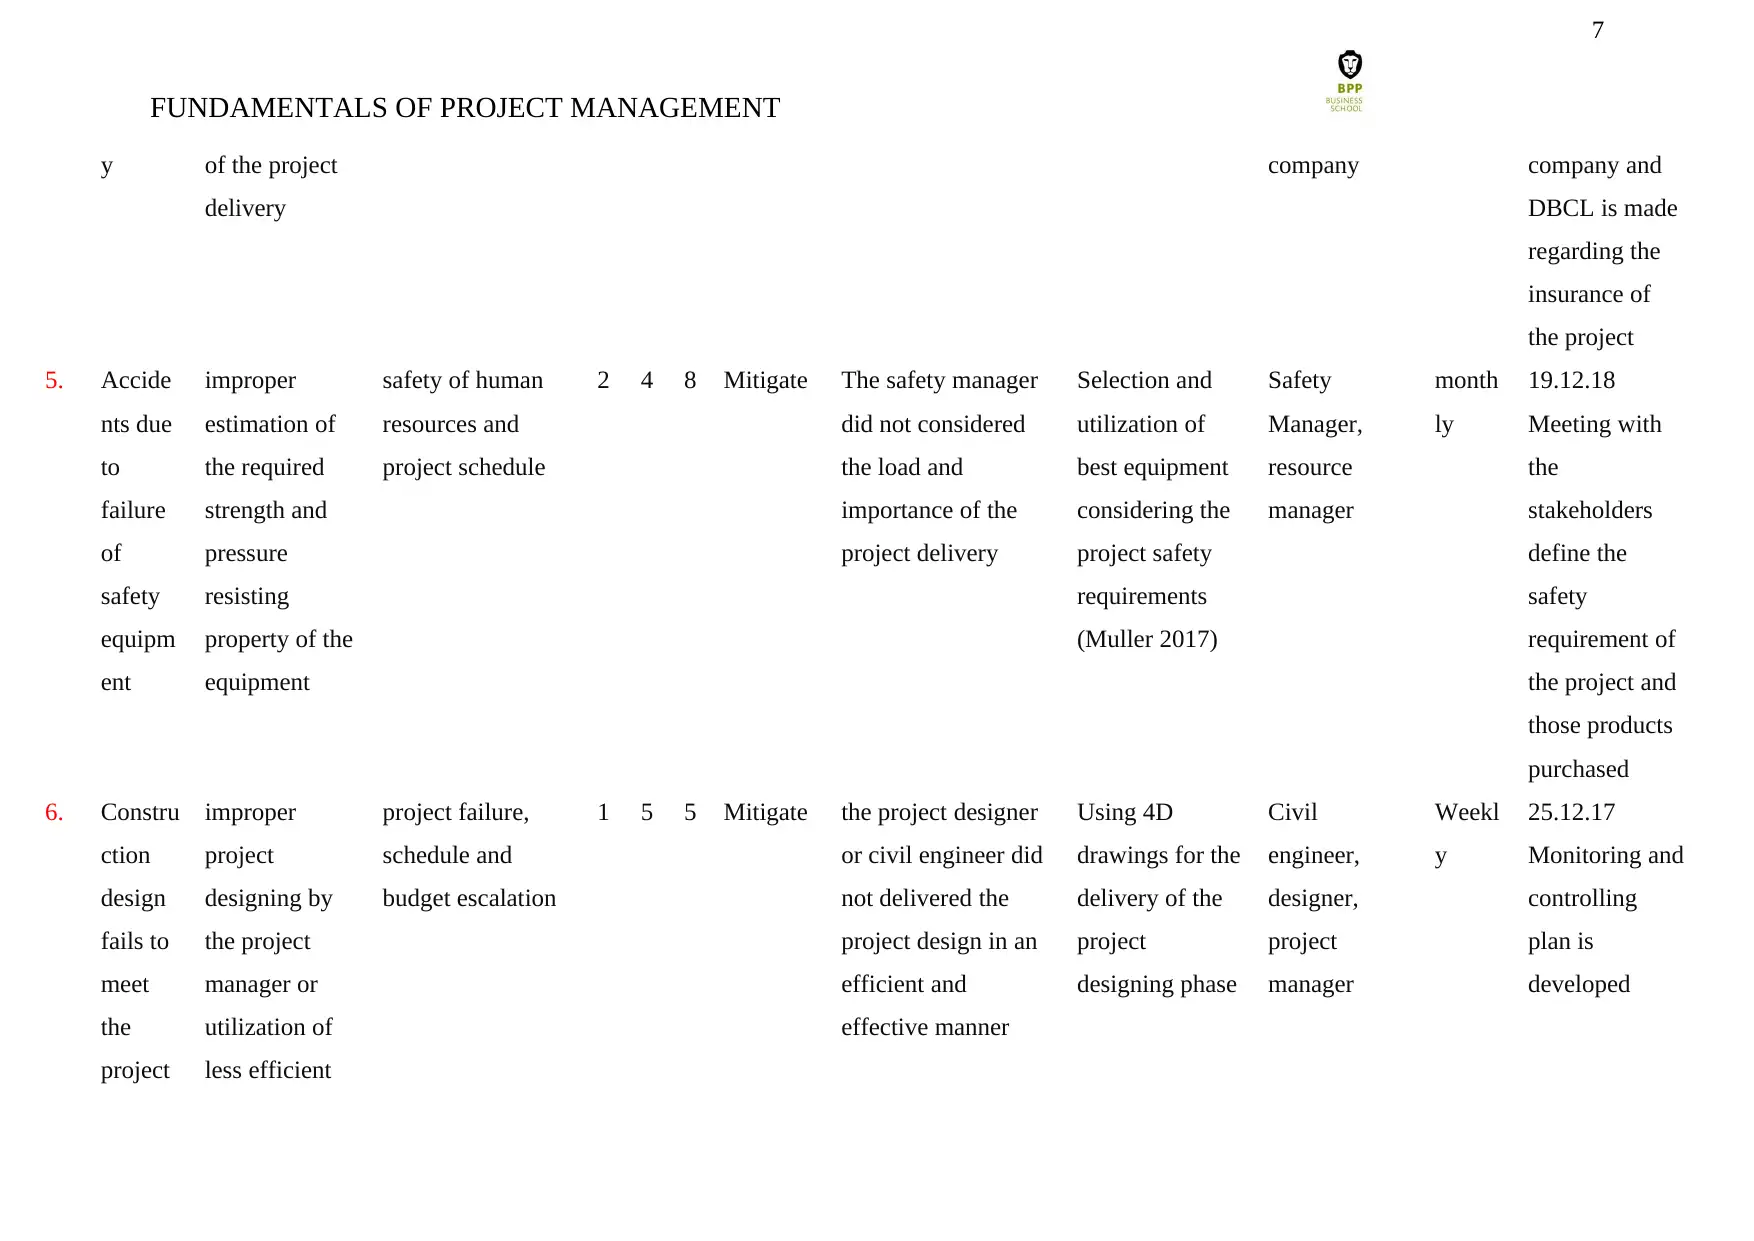
FUNDAMENTALS OF PROJECT MANAGEMENT
y of the project
delivery
company company and
DBCL is made
regarding the
insurance of
the project
5. Accide
nts due
to
failure
of
safety
equipm
ent
improper
estimation of
the required
strength and
pressure
resisting
property of the
equipment
safety of human
resources and
project schedule
2 4 8 Mitigate The safety manager
did not considered
the load and
importance of the
project delivery
Selection and
utilization of
best equipment
considering the
project safety
requirements
(Muller 2017)
Safety
Manager,
resource
manager
month
ly
19.12.18
Meeting with
the
stakeholders
define the
safety
requirement of
the project and
those products
purchased
6. Constru
ction
design
fails to
meet
the
project
improper
project
designing by
the project
manager or
utilization of
less efficient
project failure,
schedule and
budget escalation
1 5 5 Mitigate the project designer
or civil engineer did
not delivered the
project design in an
efficient and
effective manner
Using 4D
drawings for the
delivery of the
project
designing phase
Civil
engineer,
designer,
project
manager
Weekl
y
25.12.17
Monitoring and
controlling
plan is
developed
Paraphrase This Document
Need a fresh take? Get an instant paraphrase of this document with our AI Paraphraser
8
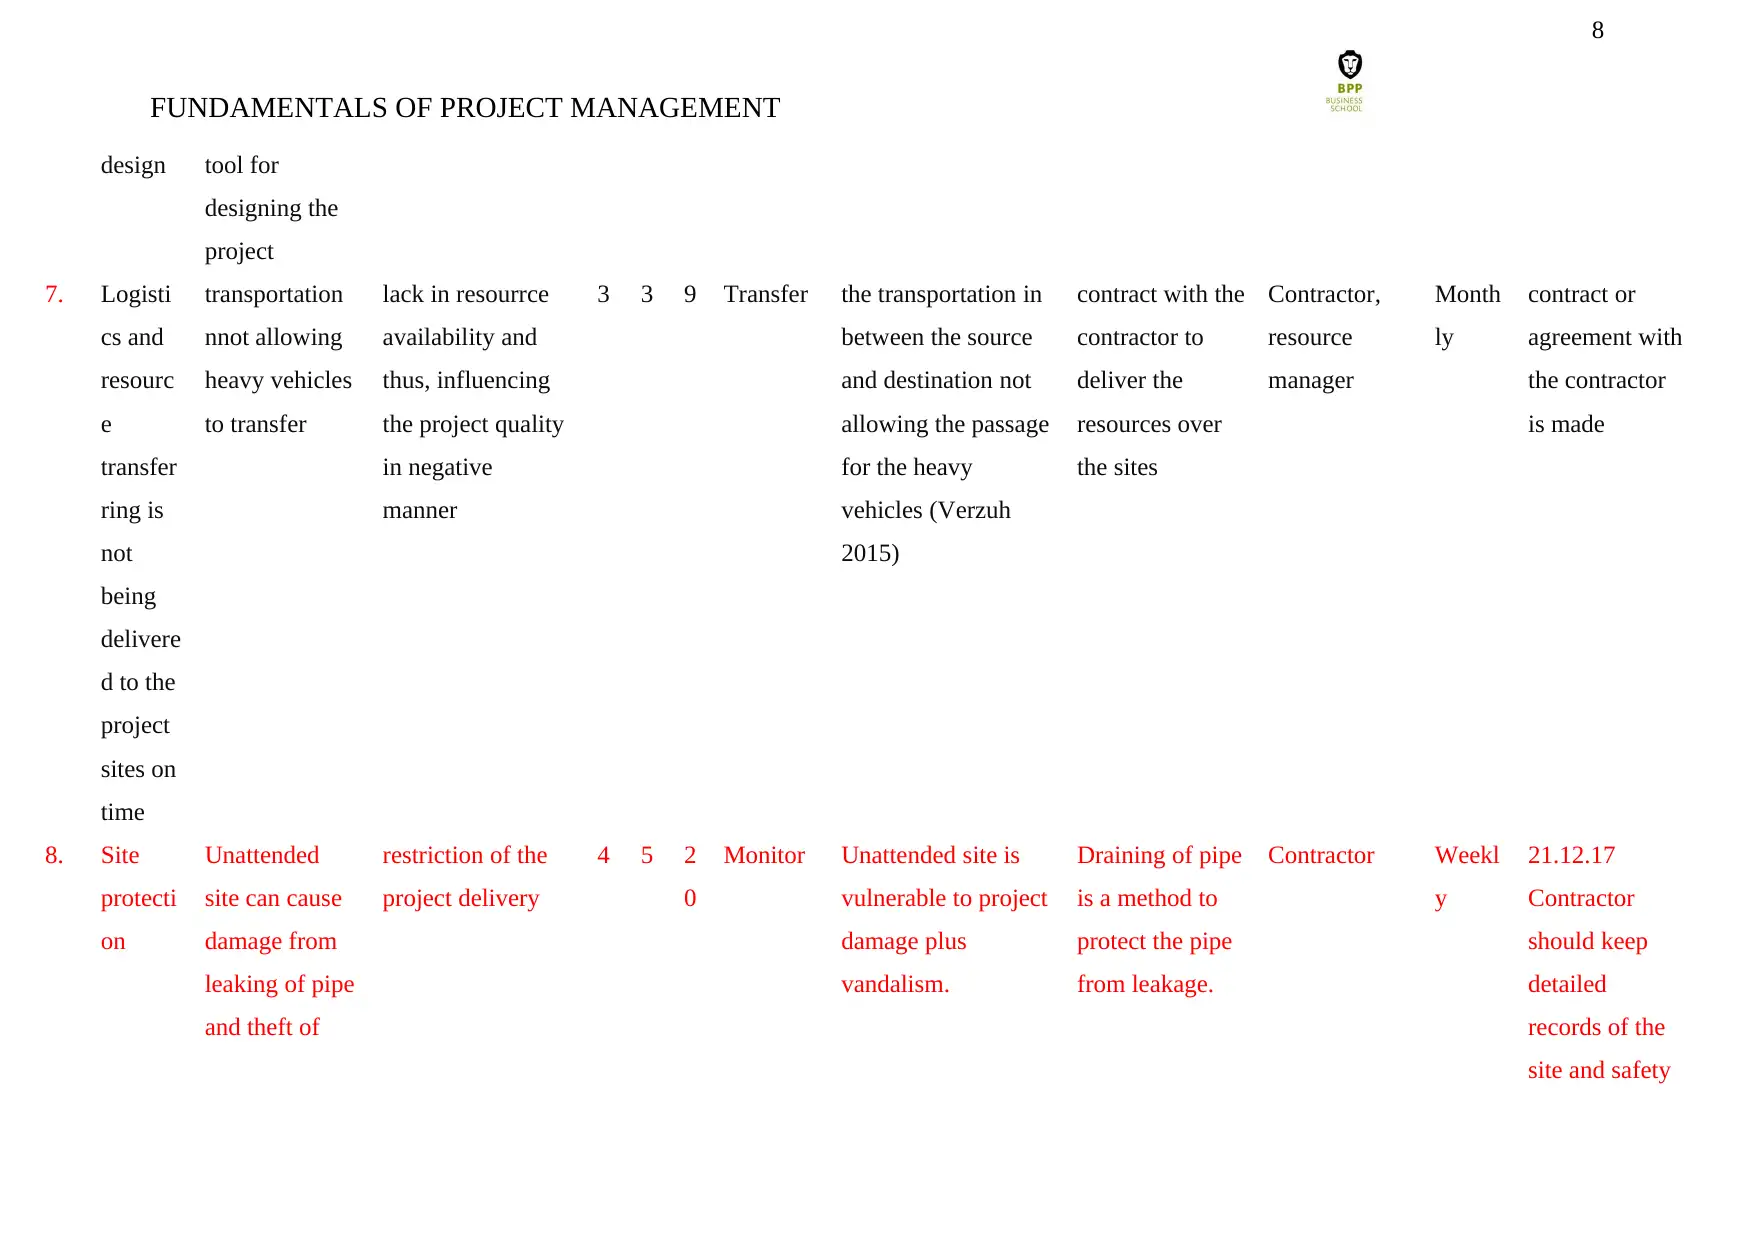
FUNDAMENTALS OF PROJECT MANAGEMENT
design tool for
designing the
project
7. Logisti
cs and
resourc
e
transfer
ring is
not
being
delivere
d to the
project
sites on
time
transportation
nnot allowing
heavy vehicles
to transfer
lack in resourrce
availability and
thus, influencing
the project quality
in negative
manner
3 3 9 Transfer the transportation in
between the source
and destination not
allowing the passage
for the heavy
vehicles (Verzuh
2015)
contract with the
contractor to
deliver the
resources over
the sites
Contractor,
resource
manager
Month
ly
contract or
agreement with
the contractor
is made
8. Site
protecti
on
Unattended
site can cause
damage from
leaking of pipe
and theft of
restriction of the
project delivery
4 5 2
0
Monitor Unattended site is
vulnerable to project
damage plus
vandalism.
Draining of pipe
is a method to
protect the pipe
from leakage.
Contractor Weekl
y
21.12.17
Contractor
should keep
detailed
records of the
site and safety
9
FUNDAMENTALS OF PROJECT MANAGEMENT
equipments of equipments
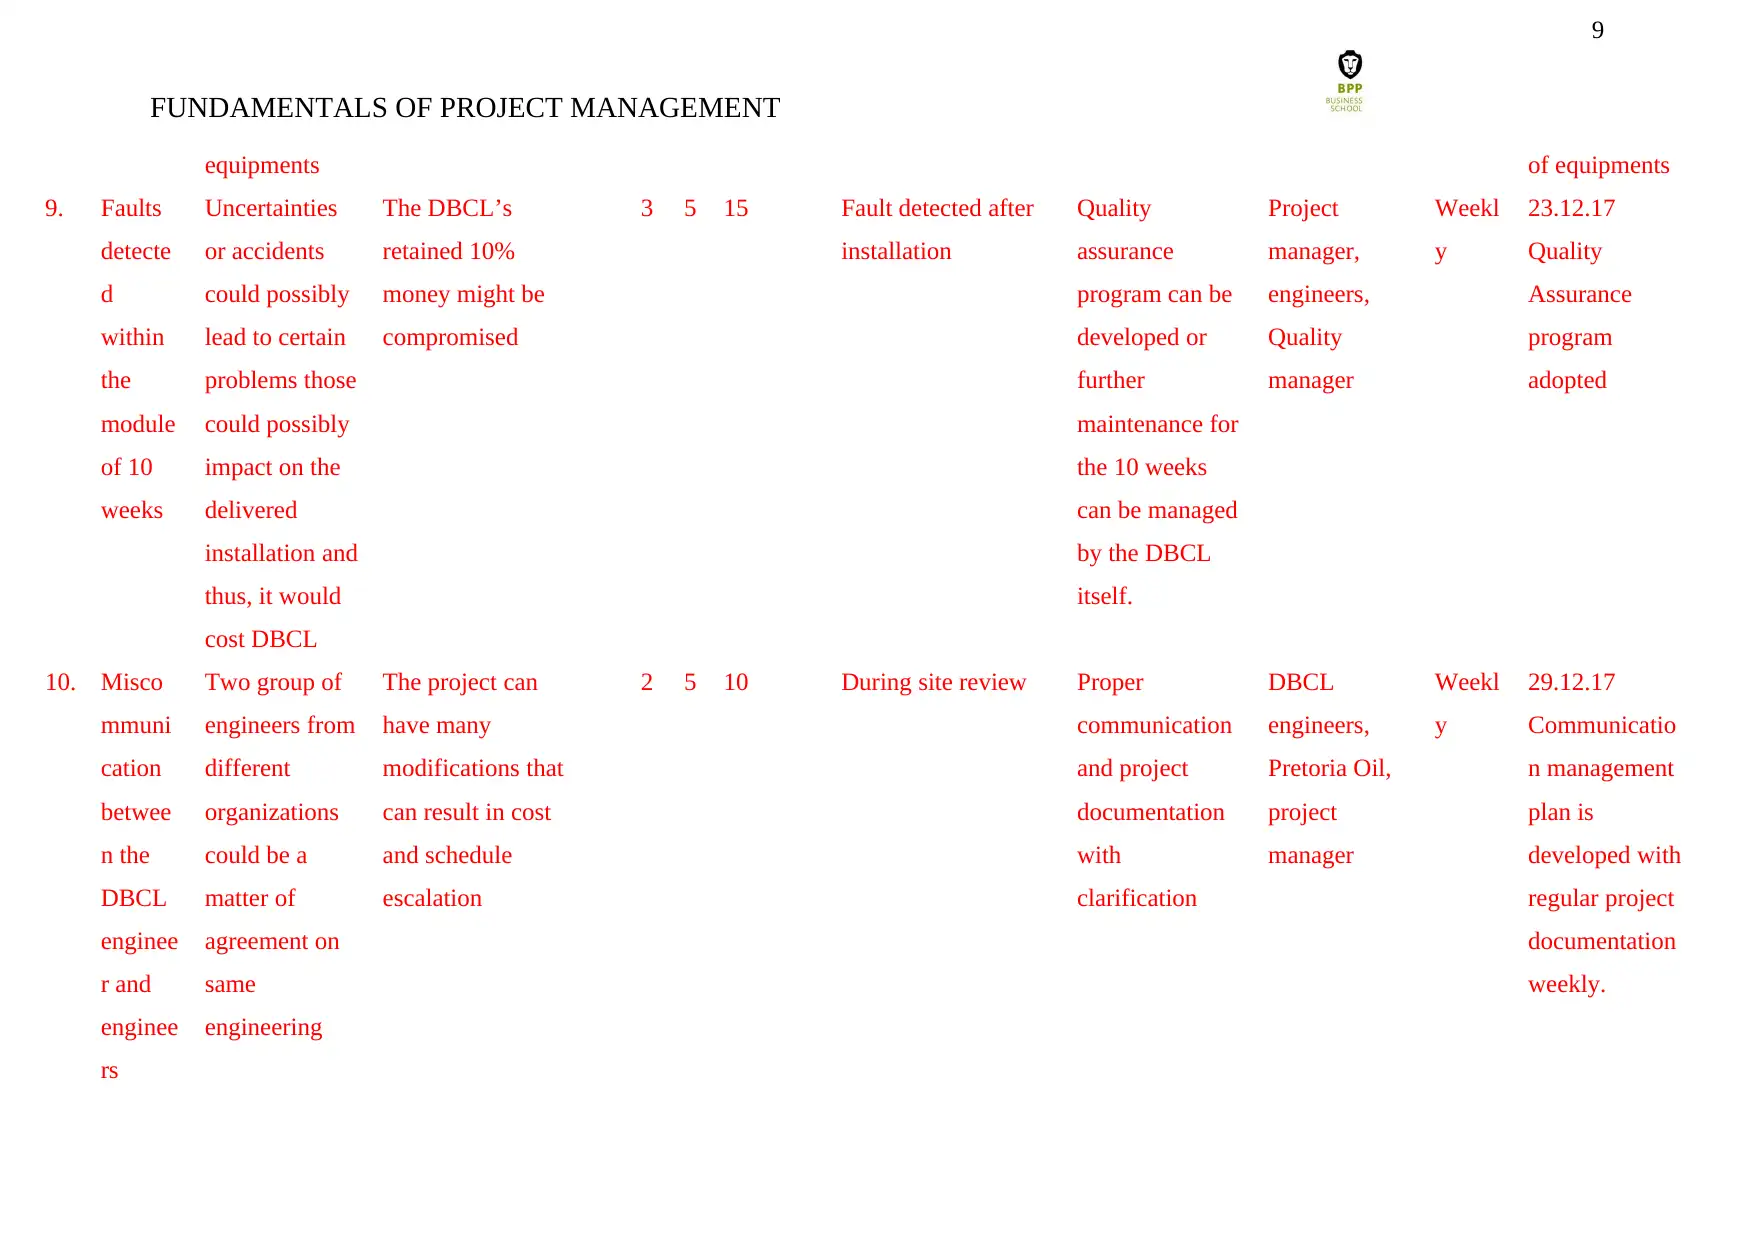
9. Faults
detecte
d
within
the
module
of 10
weeks
Uncertainties
or accidents
could possibly
lead to certain
problems those
could possibly
impact on the
delivered
installation and
thus, it would
cost DBCL
The DBCL’s
retained 10%
money might be
compromised
3 5 15 Fault detected after
installation
Quality
assurance
program can be
developed or
further
maintenance for
the 10 weeks
can be managed
by the DBCL
itself.
Project
manager,
engineers,
Quality
manager
Weekl
y
23.12.17
Quality
Assurance
program
adopted
10. Misco
mmuni
cation
betwee
n the
DBCL
enginee
r and
enginee
rs
Two group of
engineers from
different
organizations
could be a
matter of
agreement on
same
engineering
The project can
have many
modifications that
can result in cost
and schedule
escalation
2 5 10 During site review Proper
communication
and project
documentation
with
clarification
DBCL
engineers,
Pretoria Oil,
project
manager
Weekl
y
29.12.17
Communicatio
n management
plan is
developed with
regular project
documentation
weekly.
FUNDAMENTALS OF PROJECT MANAGEMENT
equipments of equipments
9. Faults
detecte
d
within
the
module
of 10
weeks
Uncertainties
or accidents
could possibly
lead to certain
problems those
could possibly
impact on the
delivered
installation and
thus, it would
cost DBCL
The DBCL’s
retained 10%
money might be
compromised
3 5 15 Fault detected after
installation
Quality
assurance
program can be
developed or
further
maintenance for
the 10 weeks
can be managed
by the DBCL
itself.
Project
manager,
engineers,
Quality
manager
Weekl
y
23.12.17
Quality
Assurance
program
adopted
10. Misco
mmuni
cation
betwee
n the
DBCL
enginee
r and
enginee
rs
Two group of
engineers from
different
organizations
could be a
matter of
agreement on
same
engineering
The project can
have many
modifications that
can result in cost
and schedule
escalation
2 5 10 During site review Proper
communication
and project
documentation
with
clarification
DBCL
engineers,
Pretoria Oil,
project
manager
Weekl
y
29.12.17
Communicatio
n management
plan is
developed with
regular project
documentation
weekly.
⊘ This is a preview!⊘
Do you want full access?
Subscribe today to unlock all pages.
Trusted by 1+ million students worldwide
10
FUNDAMENTALS OF PROJECT MANAGEMENT
workin
g for
Pretoria
Oil
concepts
FUNDAMENTALS OF PROJECT MANAGEMENT
workin
g for
Pretoria
Oil
concepts
Paraphrase This Document
Need a fresh take? Get an instant paraphrase of this document with our AI Paraphraser
11
FUNDAMENTALS OF PROJECT MANAGEMENT
2. Planning and costs
2.1 DBCL project manager’s project plan
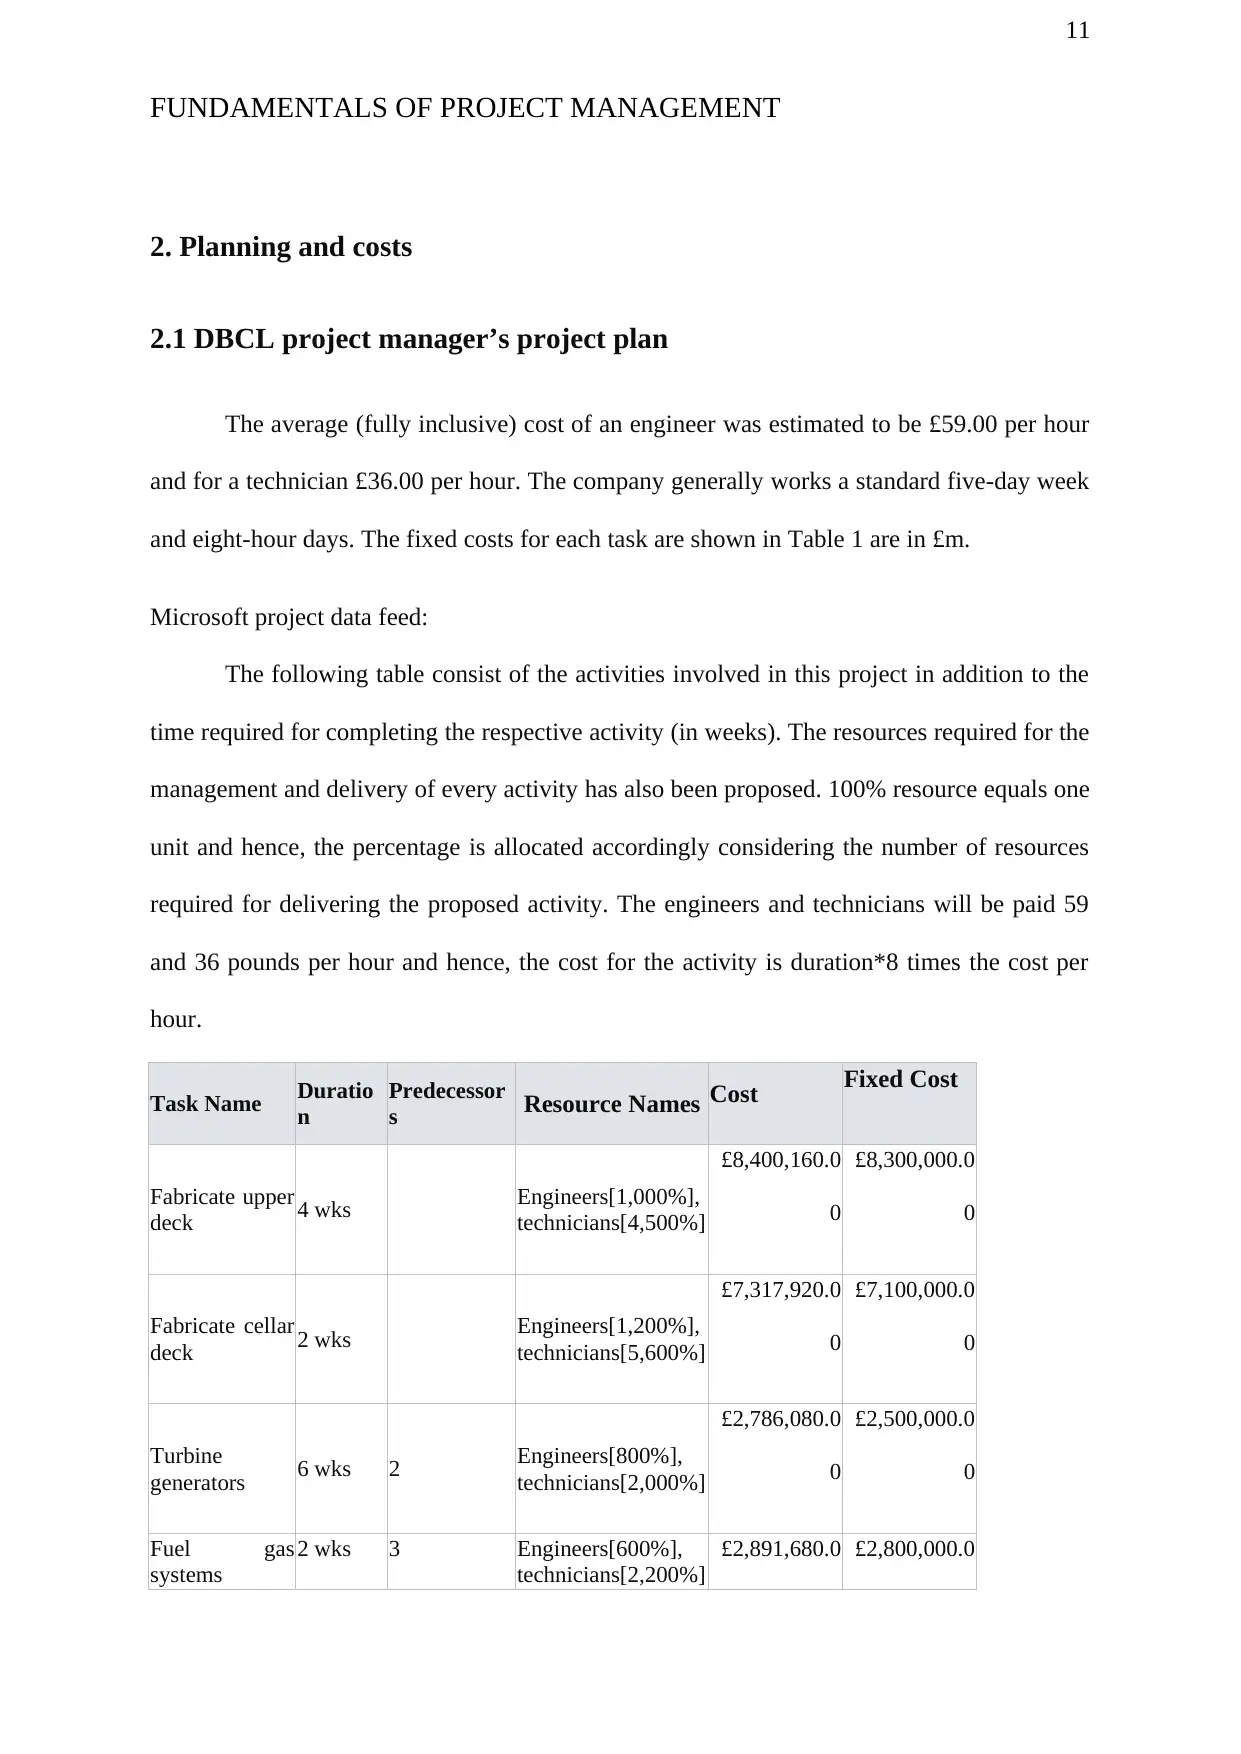
The average (fully inclusive) cost of an engineer was estimated to be £59.00 per hour
and for a technician £36.00 per hour. The company generally works a standard five-day week
and eight-hour days. The fixed costs for each task are shown in Table 1 are in £m.
Microsoft project data feed:
The following table consist of the activities involved in this project in addition to the
time required for completing the respective activity (in weeks). The resources required for the
management and delivery of every activity has also been proposed. 100% resource equals one
unit and hence, the percentage is allocated accordingly considering the number of resources
required for delivering the proposed activity. The engineers and technicians will be paid 59
and 36 pounds per hour and hence, the cost for the activity is duration*8 times the cost per
hour.
Task Name Duratio
n
Predecessor
s Resource Names Cost Fixed Cost
Fabricate upper
deck 4 wks Engineers[1,000%],
technicians[4,500%]
£8,400,160.0
0
£8,300,000.0
0
Fabricate cellar
deck 2 wks Engineers[1,200%],
technicians[5,600%]
£7,317,920.0
0
£7,100,000.0
0
Turbine
generators 6 wks 2 Engineers[800%],
technicians[2,000%]
£2,786,080.0
0
£2,500,000.0
0
Fuel gas
systems
2 wks 3 Engineers[600%],
technicians[2,200%]
£2,891,680.0 £2,800,000.0
FUNDAMENTALS OF PROJECT MANAGEMENT
2. Planning and costs
2.1 DBCL project manager’s project plan
The average (fully inclusive) cost of an engineer was estimated to be £59.00 per hour
and for a technician £36.00 per hour. The company generally works a standard five-day week
and eight-hour days. The fixed costs for each task are shown in Table 1 are in £m.
Microsoft project data feed:
The following table consist of the activities involved in this project in addition to the
time required for completing the respective activity (in weeks). The resources required for the
management and delivery of every activity has also been proposed. 100% resource equals one
unit and hence, the percentage is allocated accordingly considering the number of resources
required for delivering the proposed activity. The engineers and technicians will be paid 59
and 36 pounds per hour and hence, the cost for the activity is duration*8 times the cost per
hour.
Task Name Duratio
n
Predecessor
s Resource Names Cost Fixed Cost
Fabricate upper
deck 4 wks Engineers[1,000%],
technicians[4,500%]
£8,400,160.0
0
£8,300,000.0
0
Fabricate cellar
deck 2 wks Engineers[1,200%],
technicians[5,600%]
£7,317,920.0
0
£7,100,000.0
0
Turbine
generators 6 wks 2 Engineers[800%],
technicians[2,000%]
£2,786,080.0
0
£2,500,000.0
0
Fuel gas
systems
2 wks 3 Engineers[600%],
technicians[2,200%]
£2,891,680.0 £2,800,000.0
12
FUNDAMENTALS OF PROJECT MANAGEMENT
0 0
Fabricate flare
boom 4 wks 3 Engineers[800%],
technicians[3,200%]
£4,159,840.0
0
£3,900,000.0
0
Cooling
systems 8 wks 4 Engineers[1,200%],t
echnicians[1,800%]
£4,933,920.0
0
£4,500,000.0
0
Seawater
pumping
systems
12 wks 4 Engineers[1,200%],t
echnicians[2,000%]
£3,185,440.0
0
£2,500,000.0
0
Connect both
decks 2 wks 4,5 Engineers[1,000%],t
echnicians[4,600%]
£3,279,680.0
0
£3,100,000.0
0
Install flare
boom 6 wks 6,9 Engineers[800%],te
chnicians[3,500%]
£2,615,680.0
0
£2,200,000.0
0
Coalescer
systems 4 wks 7 Engineers[700%],te
chnicians[1,400%]
£2,346,720.0
0
£2,200,000.0
0
Gas
dehydration
systems
4 wks 11 Engineers[700%],te
chnicians[1,000%]
£2,823,680.0
0
£2,700,000.0
0
Water injection
systems 6 wks 8,9 Engineers[600%],te
chnicians[1,200%]
£3,288,640.0
0
£3,100,000.0
0
Gas
compression
systems
6 wks 10 Engineers[600%],te
chnicians[1,400%]
£3,405,920.0
0
£3,200,000.0
0
Onshore
commissioning
8 wks 12,13,14
Engineers[1,200%],t
echnicians[2,400%]
£1,603,040.0
0
£1,100,000.0
0
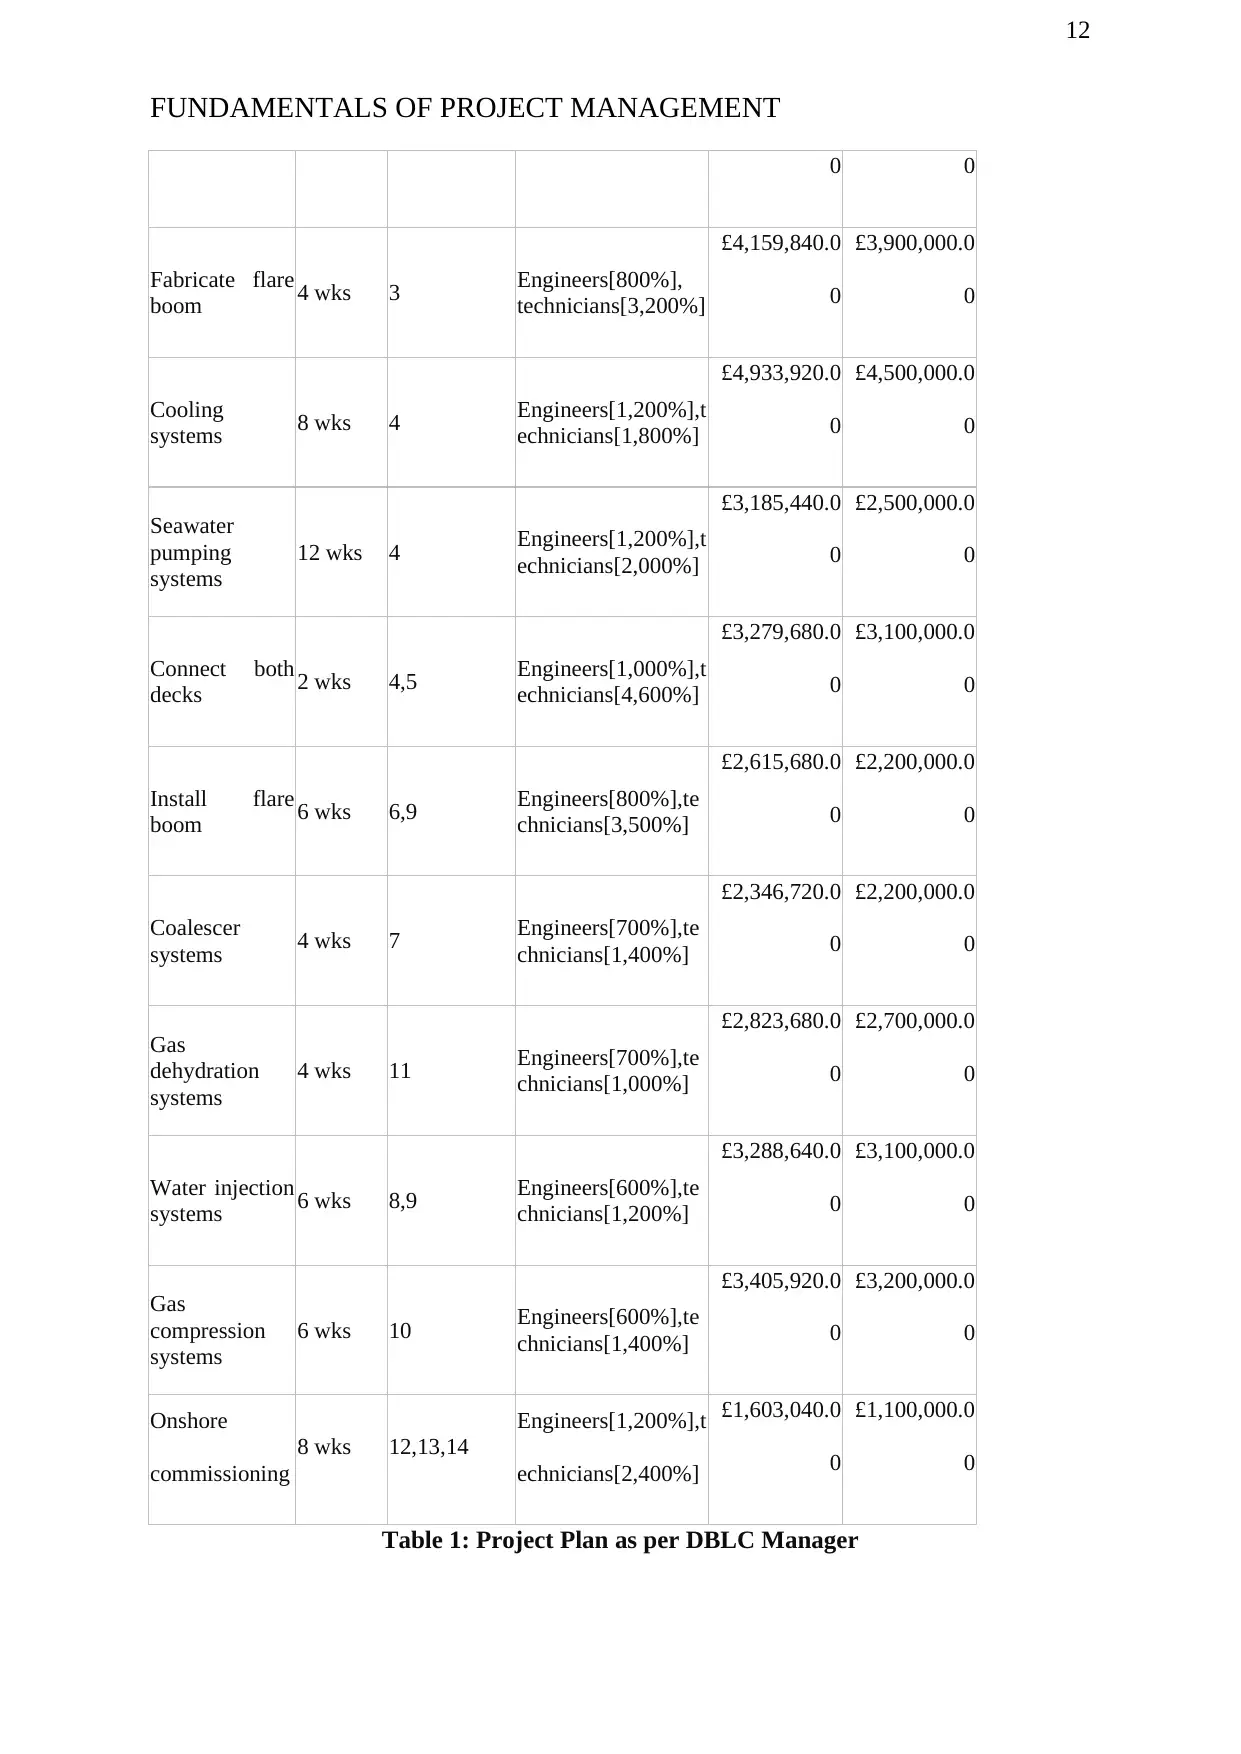
Table 1: Project Plan as per DBLC Manager
FUNDAMENTALS OF PROJECT MANAGEMENT
0 0
Fabricate flare
boom 4 wks 3 Engineers[800%],
technicians[3,200%]
£4,159,840.0
0
£3,900,000.0
0
Cooling
systems 8 wks 4 Engineers[1,200%],t
echnicians[1,800%]
£4,933,920.0
0
£4,500,000.0
0
Seawater
pumping
systems
12 wks 4 Engineers[1,200%],t
echnicians[2,000%]
£3,185,440.0
0
£2,500,000.0
0
Connect both
decks 2 wks 4,5 Engineers[1,000%],t
echnicians[4,600%]
£3,279,680.0
0
£3,100,000.0
0
Install flare
boom 6 wks 6,9 Engineers[800%],te
chnicians[3,500%]
£2,615,680.0
0
£2,200,000.0
0
Coalescer
systems 4 wks 7 Engineers[700%],te
chnicians[1,400%]
£2,346,720.0
0
£2,200,000.0
0
Gas
dehydration
systems
4 wks 11 Engineers[700%],te
chnicians[1,000%]
£2,823,680.0
0
£2,700,000.0
0
Water injection
systems 6 wks 8,9 Engineers[600%],te
chnicians[1,200%]
£3,288,640.0
0
£3,100,000.0
0
Gas
compression
systems
6 wks 10 Engineers[600%],te
chnicians[1,400%]
£3,405,920.0
0
£3,200,000.0
0
Onshore
commissioning
8 wks 12,13,14
Engineers[1,200%],t
echnicians[2,400%]
£1,603,040.0
0
£1,100,000.0
0
Table 1: Project Plan as per DBLC Manager
⊘ This is a preview!⊘
Do you want full access?
Subscribe today to unlock all pages.
Trusted by 1+ million students worldwide
1 out of 31
Related Documents


Your All-in-One AI-Powered Toolkit for Academic Success.
+13062052269
info@desklib.com
Available 24*7 on WhatsApp / Email
![[object Object]](/_next/static/media/star-bottom.7253800d.svg)
Unlock your academic potential
Copyright © 2020–2026 A2Z Services. All Rights Reserved. Developed and managed by ZUCOL.