Project Management Methodologies: Latino Engineering Case Study Report
VerifiedAdded on 2020/03/16
|19
|4037
|46
Report
AI Summary
This report provides a detailed analysis of project management methodologies, focusing on a case study of Latino Engineering. It begins with an executive summary and table of contents, then introduces the company and its challenges. The report explores the POTI model for defining project scope, including processes, organization, technology, and information. It also covers risk assessment and assumptions. A high-level description of the POTI diagram and an implementation plan are presented, emphasizing the importance of project deliverables and quality control. The core of the report focuses on the continuous improvement plan, detailing the application of basic quality tools, including the 7 QC tools (flowchart, checksheet, fishbone diagram, Pareto chart, control charts, histogram, and scatter diagram), the five whys, and Poka Yoke. The report also examines identifying relevant tools and techniques, solving non-routine problems, and adapting ideas to new situations. The conclusion summarizes the key findings and recommendations for Latino Engineering to improve its project management and quality control processes. The report is well-structured, providing a comprehensive overview of the project management methodologies and their practical application within the context of Latino Engineering.
Running head: PROJECT MANAGEMENT METHODOLOGIES
Project Management Methodologies
(Latino Engineering)
Name of the student:
Name of the university:
Author Note
Project Management Methodologies
(Latino Engineering)
Name of the student:
Name of the university:
Author Note
Paraphrase This Document
Need a fresh take? Get an instant paraphrase of this document with our AI Paraphraser
1PROJECT MANAGEMENT METHODOLOGIES
Executive summary
The report demonstrates the pictorial illustration of the consistent development plan and the high-
level textural overview of that development plan of Latino Engineering. Further it has also analyzed
the continuous improvement plan through various approaches.
Executive summary
The report demonstrates the pictorial illustration of the consistent development plan and the high-
level textural overview of that development plan of Latino Engineering. Further it has also analyzed
the continuous improvement plan through various approaches.
2PROJECT MANAGEMENT METHODOLOGIES
Table of Contents
1. Introduction:......................................................................................................................................4
2. A pictorial illustration of the continuous development plan:............................................................4
2.1. The P.O.T.I Model:.....................................................................................................................4
2.2. Assumptions and Risks:..............................................................................................................6
3. A high-level description of the above diagram:................................................................................7
4. Implementation plan developed as an accurate reflection of the Latino Engineering:......................8
5. The continuous improvement plan:...................................................................................................9
5.1. The continuous improvement plan reflecting the ability to use and apply the fundamental
concepts and skills of the unit:...........................................................................................................9
5.1.1. Basic Quality Tools in Continuous Improvement Process:.................................................9
5.1.2. Application of 7 Quality Control or 7 QC Tools:..............................................................10
5.1.3. The five whys:...................................................................................................................12
5.1.4. Poka Yoke (mistaken proofing):........................................................................................13
5.2. The continuous improvement plan demonstrating the awareness and the understanding of
deeper and less obvious aspects of that unit:...................................................................................13
5.2.1. Identifying the relevant tools and techniques:...................................................................13
5.2.2. The solving of non-routine problems:...............................................................................13
5.2.3. The ability to adapt and apply the ideas to new situations:...............................................14
5.2.4. The ability to invent and evaluate new ideas:....................................................................14
5.3. The continuous improvement plan has with imagination, originality and learning outcomes:14
⊘ This is a preview!⊘
Do you want full access?
Subscribe today to unlock all pages.
Trusted by 1+ million students worldwide
3PROJECT MANAGEMENT METHODOLOGIES
6. Conclusion:......................................................................................................................................16
7. Bibliography:...................................................................................................................................17
Paraphrase This Document
Need a fresh take? Get an instant paraphrase of this document with our AI Paraphraser
4PROJECT MANAGEMENT METHODOLOGIES
1. Introduction:
The Latino Engineering is a medium-sized organization at New South Wales, Australia. It
has been delivering the manufacturing, design, development of the specialist engineering equipment
for different industries.
However, there has been a surprising deterioration in the company’s quality. Although they
have retained the workforce assuring the minimum disruption to the work process, the clients were
still not satisfied. Moreover, Latino Engineering has been purchased by an investment group.
The report has recommended the pictorial illustration of the consistent development plan and
the high-level textural overview of that development plan. Lastly, it has also included the continuous
improvement plan.
2. A pictorial illustration of the continuous development plan:
2.1. The P.O.T.I Model:
Latino Engineering has been using the POTI model for defining the scope of what has been
going on to alter them as the project gets completed. This model has been setting out the scopes of
the project at the high level.
Processes:
The projects have been changing the processes and introducing the new ones. The scope has
been covering the operational business models changing because of the result carried out within the
program.
5PROJECT MANAGEMENT METHODOLOGIES
Organization:
The scopes have been extending the changes of the people resulting from that project. It has
been a wide section and covering all the things to perform with the personnel from the organizational
culture. This has been to determine to how many staffs at Latino Engineering would be required to
get the program completed.
Technology:
The technology requirements for the project have been falling in the sector of scope. This has
been typically delivered around various projects under the project. However, the area has been
covering the computers along with encompassing tools, systems and additional resources like the
buildings.
Information:
The last section of the scope has been covering the intangible area of information. The data
required in the organization, completely transformed and new is needed here. The changes have been
hard to establish the starting the program. Hence the scope of the statement has been just revealing
the latest information requirements. These are defined as the stakeholders engaged in the different
projects.
⊘ This is a preview!⊘
Do you want full access?
Subscribe today to unlock all pages.
Trusted by 1+ million students worldwide
6PROJECT MANAGEMENT METHODOLOGIES
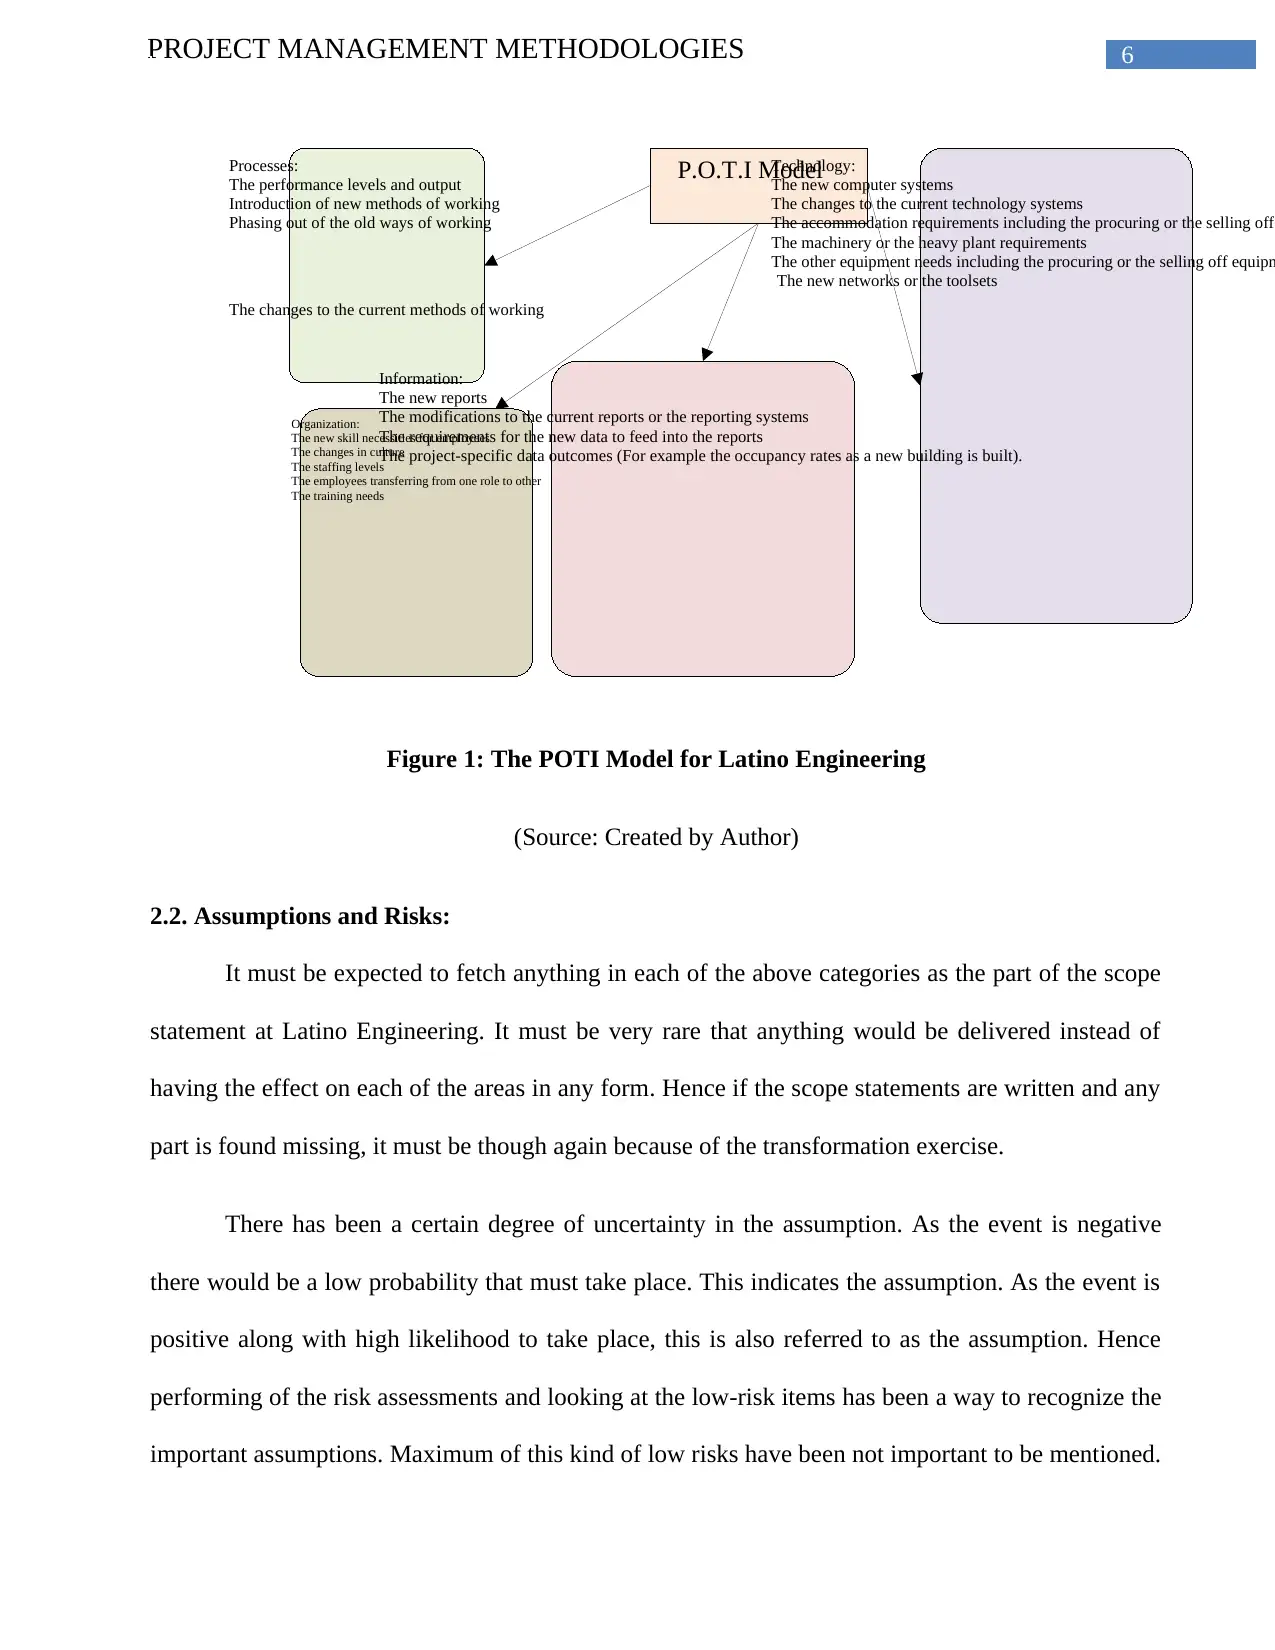
P.O.T.I ModelProcesses:
The performance levels and output
Introduction of new methods of working
Phasing out of the old ways of working
The changes to the current methods of working
Organization:
The new skill necessities for employees
The changes in culture
The staffing levels
The employees transferring from one role to other
The training needs
Technology:
The new computer systems
The changes to the current technology systems
The accommodation requirements including the procuring or the selling off
The machinery or the heavy plant requirements
The other equipment needs including the procuring or the selling off equipm
The new networks or the toolsets
Information:
The new reports
The modifications to the current reports or the reporting systems
The requirements for the new data to feed into the reports
The project-specific data outcomes (For example the occupancy rates as a new building is built).
Figure 1: The POTI Model for Latino Engineering
(Source: Created by Author)
2.2. Assumptions and Risks:
It must be expected to fetch anything in each of the above categories as the part of the scope
statement at Latino Engineering. It must be very rare that anything would be delivered instead of
having the effect on each of the areas in any form. Hence if the scope statements are written and any
part is found missing, it must be though again because of the transformation exercise.
There has been a certain degree of uncertainty in the assumption. As the event is negative
there would be a low probability that must take place. This indicates the assumption. As the event is
positive along with high likelihood to take place, this is also referred to as the assumption. Hence
performing of the risk assessments and looking at the low-risk items has been a way to recognize the
important assumptions. Maximum of this kind of low risks have been not important to be mentioned.
Paraphrase This Document
Need a fresh take? Get an instant paraphrase of this document with our AI Paraphraser
7PROJECT MANAGEMENT METHODOLOGIES
However, there have been some that have important implications even though the event not turn out
as expected. These could be documented as the assumptions.
3. A high-level description of the above diagram:
Latino Engineering must support their project managers through implementing the systems
and tools for aiding communications and decreasing the administrative overhead. These tools might
be controlling changes, tracking and planning, recording lessons and tracking actions and actions.
The product description of the PRINCE2 has been including the amount of those products. However,
various proprietary tools have been using their individual terminologies and workflow that might not
match the PRINCE 2 or the own terminology of Latino Engineering. At many times those terms
could be changed. At those situations, the choice has been to adopt the terminology of the Latino
Engineering for matching the strategy or choose the alternative strategy. The decision has been
depending on the value that has been put on to maintain the opted workflows or the terminology.
The experienced project managers must be able to cope with various terminologies. However the
people new in the area of project management or from any disciplines external to the area might face
challenges.
The above POTI model has set the high-level scopes that should be integrated and included
in the efficient future state design. In the process, the business models of the functions and
operations have been including the performance levels and the operational costs. In the
organizational structure the roles, skills, organization culture, supply chain and the style are
included. At the technology the IT systems and tools machinery, accommodation, buildings are
considered. Lastly, at the information, the data and the information needed for the performance
management and the further business operations are included.
8PROJECT MANAGEMENT METHODOLOGIES
4. Implementation plan developed as an accurate reflection of the Latino
Engineering:
At the implementation phase, the project team of Latino Engineering must actually perform
the project works for producing the deliverables. These deliverables indicate the things that the
project must be delivered. This must include all the services and products performed by the company
for the sponsor, customer, and client. This must include every project management documents put
together. The phases undertaken to create all the deliverables must vary. This must be on the basis of
the kind of the project undertaken by Latino Engineering. Thus it could be described in any real
detail. For instance, Latino Engineering must focus on using the materials, resources, equipment for
constructing every project deliverable. The activities needed to create every deliverable must be
clearly specified under the project requirements and the project plan.
The project manager Latino Engineering must involve in directing the work. However, he
also needs to perform more than just delivering the results. They must also require keeping the track
on the way how efficiently the team has been performing. These implementation phases should keep
the project plan on the track with the effective control processing and monitoring. This is to assure
the ultimate deliverables meeting the acceptance criteria as set by the customers. The steps have
been typically where the changes approved are imposed.
However, most often the changes are determined by looking at the quality controlled data and the
performance. The routine performance and the measurements of the quality control are needed to be
examined regularly across the implementation phase. The collection of reports on the measurements
must help to determine where the challenge has been and then recommend the changes to fix that.
⊘ This is a preview!⊘
Do you want full access?
Subscribe today to unlock all pages.
Trusted by 1+ million students worldwide
9PROJECT MANAGEMENT METHODOLOGIES
5. The continuous improvement plan:
5.1. The continuous improvement plan reflecting the ability to use and apply the fundamental
concepts and skills of the unit:
The continuous quality improvement process has been assuming and need the team of
experts together with the leadership of the company to use the quality tools actively. This is done by
the decision making process and the improvement activities. Presently there has been an important
number of quality management tools and quality assurance available. Hence the selecting of the
most appropriate has not been an easy task always. The tools have been the fundamental ingredients
of the basic instruments and process for having success in the quality program. However, it is not
that the quality controls could remedy the entire quality program. However, it has been obviously
meaning to solve the problems. It has been needed to emphasize that the tools could very effective in
the proper hands. They could be dangerous in wrong hands. Thus it has been crucial to
understanding which, when and how the tools could be utilized to solve the problems or the
improvement process.
5.1.1. Basic Quality Tools in Continuous Improvement Process:
The seven quality tools basic for every other tool are listed below. They were first
emphasized in 1960 by Ishikawa.
The cause-and-effect diagram
Scatter plot
Histogram
Control chart
Checksheet
Pareto diagram
Paraphrase This Document
Need a fresh take? Get an instant paraphrase of this document with our AI Paraphraser
10PROJECT MANAGEMENT METHODOLOGIES
Flowchart
5.1.2. Application of 7 Quality Control or 7 QC Tools:
The tools Applications
1. Flowchart The tools are utilized as any breakdowns or
bottlenecks are needed tone determined in the
work process. The steps of the process have been
providing the picture of how the process has
been looking light. It has been highlighting
issues under the process. The flowcharts are used
to display the alterations in the process as any
improvements are made to point any new
workflow process.
2. Checksheet This has been the basic quality tool used to
gather the data. The sheet could be used for
tracking the frequency of happening of particular
incidents.
3. Fishbone or Cause and Effect Diagram This has been displaying the possible reasons
for the problems. For using the tool there is the
necessity to firstly determine the issue needed to
solve and write that in the box. As all the
possible reasons are determined, they are used
for developing the improvement plan to solve the
problems identified.
4. Pareto chart It is the bar graph of the data displaying the
11PROJECT MANAGEMENT METHODOLOGIES
highest number of frequencies to the lowest.
5. Control charts The run or control charts are utilized for plotting
the data points every time and providing the
image of the mobility of the data. It has been
demonstrating where the data has been consistent
and where there have been the low or high
outliers in the data occurrence.
6. Histogram They have bar chart type pictures of the data
displaying the patterns falling under the typical
process conditions. The changes in the process
have been triggering the latest collection of data.
7. Scatter diagram They are the graphs showing the relationship
between the variables. The variables have been
often representing the possible causes and
effects.
⊘ This is a preview!⊘
Do you want full access?
Subscribe today to unlock all pages.
Trusted by 1+ million students worldwide
1 out of 19
Related Documents


Your All-in-One AI-Powered Toolkit for Academic Success.
+13062052269
info@desklib.com
Available 24*7 on WhatsApp / Email
![[object Object]](/_next/static/media/star-bottom.7253800d.svg)
Unlock your academic potential
Copyright © 2020–2026 A2Z Services. All Rights Reserved. Developed and managed by ZUCOL.