PPMP20009: Project Management Methodologies Report - Latino Eng
VerifiedAdded on 2020/03/16
|11
|3148
|75
Report
AI Summary
This report addresses the challenges faced by Latino Engineering, including defective products and poor customer service. The report proposes a strategy for continuous improvement, starting with the development of a vision and blueprint using the POTI model (Processes, Organization, Technology, Information). It then applies the 7 QC tools (Cause and Effect Diagram, Check Sheets, Control Charts, Histograms, Pareto Chart, Scatter Diagram, and Flow Chart) to identify and analyze the root causes of problems and opportunities for improvement. The Gemba Kaizen framework is utilized to implement changes, with agile project management chosen as the most suitable methodology. The report details the application of these tools and methodologies across various aspects of the company, including processes, organization, technology, and information systems, aiming to achieve continuous improvement and reverse the company's performance decline. The vision is to transform Latino Engineering into a company with highly trained employees, automated processes, and data-driven decision-making.
PPMP20009: Project Management Methodologies
Name
Date
Name
Date
Paraphrase This Document
Need a fresh take? Get an instant paraphrase of this document with our AI Paraphraser
Executive Summary
barely 12 months after new owners took ownership, the Latino Engineering Company is
experiencing challenges that include defective products and poor customer service; issues that were
unheard of in the last 30 year of its existence. These challenges need to be addressed as a matter of
urgency given that the company established a reputation for quality engineering products. The way
to solve the challenges is to first develop a vision from its blueprint using the POTI model and then
applying the 7 QC tools for determining causes, their frequency, their importance, and opportunities
for improvement that will be done using the Gemba Kaizen framework. The project management
method to be used is agile as it blends well with the 7 QC tools and the Kaizen framework
Introduction
This report outlines how Latino Engineering can overcome the problems bedeviling it; the problems
identified as facing the company include Defective Engineering products,
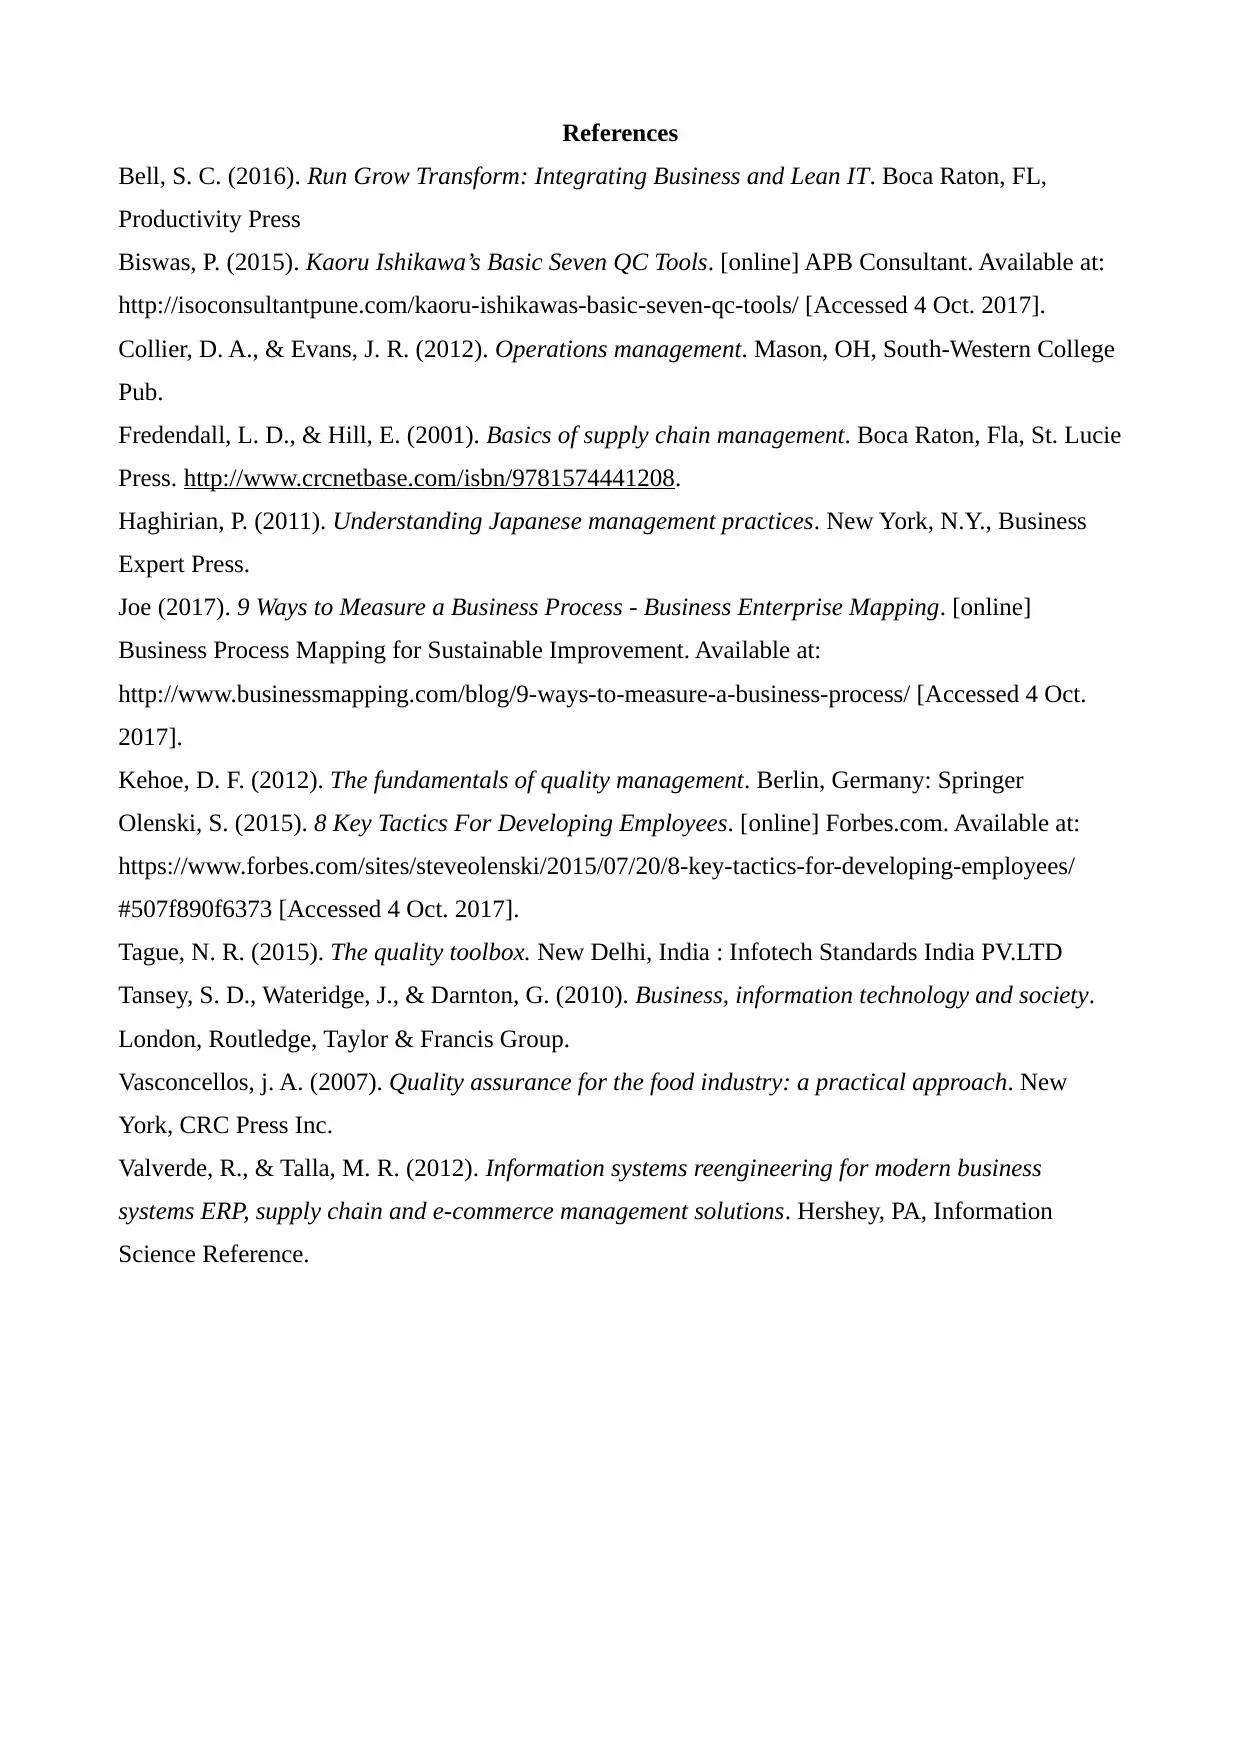
Continuous Process Improvement (CPI) Strategy for Latino Engineering
The strategy for Latino Engineering to to make continuous improvements is to first develop a
framework that will be used for evaluating the present systems tat related to organizational
performance to develop a vision and blueprint of what the company should be at the end of three
months. From this blueprint, suitable tools will be used for evaluation, identifying, and monitoring
the current performance, through the use of metrics. The pictorial representation of the process and
the tools to be used are shown in Appendices I and II
Process, Organization, Technology, Information (POTI) Blueprint and Vision
The detailed vision of an organization is its blueprint; it deals with what the organization is to look
like when all projects are concluded and the transformation of the business is achieved. The first
step is to develop a blue print to help set this project in a wider context of what Latino Engineering
is trying to achieve. The POTI model will be used for developing the blue print as a way to define
the scope of what will change at the company; using the POTI, the high level scope of the program
will be set. POTI will evaluate the processes, organization, technology, and information. The four
aspects constitute the program scope comprehensive view
Processes
processes determine to a great deal the performance of a company; for Latino Engineering,
processes are integral to customer delivery and developing quality products. The effectiveness of
business processes measure how the process performs to the expectations of the customer. Processes
must be measured in evaluating work performance; measuring work performance requires that the
fundamental SIPOC (supplier input process – output customer) business process model must be
evaluated first (Joe 2017). clearly, the present processes at Latino Engineering require change and in
this project, the performance perspective deals with operational business models that must be
changed after this evaluation to enhance CIP. The business processes that will be changed include
performance output and levels, how new ways of working are introduced, changes to existing
working methods, and phasing out old ways that seem to be leading to problems. The envisioned
situation is one in which some processes such as customer service and customer interaction and
follow are automated using suitable software; design processes are also standardized and aided by
technology, from design to simulation and testing to redesign, all through involving the client to
ensure their needs are fully met.
Organization
This report outlines how Latino Engineering can overcome the problems bedeviling it; the problems
identified as facing the company include Defective Engineering products,
Continuous Process Improvement (CPI) Strategy for Latino Engineering
The strategy for Latino Engineering to to make continuous improvements is to first develop a
framework that will be used for evaluating the present systems tat related to organizational
performance to develop a vision and blueprint of what the company should be at the end of three
months. From this blueprint, suitable tools will be used for evaluation, identifying, and monitoring
the current performance, through the use of metrics. The pictorial representation of the process and
the tools to be used are shown in Appendices I and II
Process, Organization, Technology, Information (POTI) Blueprint and Vision
The detailed vision of an organization is its blueprint; it deals with what the organization is to look
like when all projects are concluded and the transformation of the business is achieved. The first
step is to develop a blue print to help set this project in a wider context of what Latino Engineering
is trying to achieve. The POTI model will be used for developing the blue print as a way to define
the scope of what will change at the company; using the POTI, the high level scope of the program
will be set. POTI will evaluate the processes, organization, technology, and information. The four
aspects constitute the program scope comprehensive view
Processes
processes determine to a great deal the performance of a company; for Latino Engineering,
processes are integral to customer delivery and developing quality products. The effectiveness of
business processes measure how the process performs to the expectations of the customer. Processes
must be measured in evaluating work performance; measuring work performance requires that the
fundamental SIPOC (supplier input process – output customer) business process model must be
evaluated first (Joe 2017). clearly, the present processes at Latino Engineering require change and in
this project, the performance perspective deals with operational business models that must be
changed after this evaluation to enhance CIP. The business processes that will be changed include
performance output and levels, how new ways of working are introduced, changes to existing
working methods, and phasing out old ways that seem to be leading to problems. The envisioned
situation is one in which some processes such as customer service and customer interaction and
follow are automated using suitable software; design processes are also standardized and aided by
technology, from design to simulation and testing to redesign, all through involving the client to
ensure their needs are fully met.
Organization
⊘ This is a preview!⊘
Do you want full access?
Subscribe today to unlock all pages.
Trusted by 1+ million students worldwide
This scope deals with changes that will result from this evaluation and blueprint development; it
will encompass everything dealing with personnel, from the culture of the organization to the
number of required employees and their requisite skills along with their training needs. The new
skill set requirements for employees, change in organizational culture, training needs, staffing
levels, and employee roles being changed will be evaluated Olenski (2015). The vision is a
company with highly trained employees with the right set of technical and soft skills that will help
the company achieve continuous improvement (CI) and reverse the present performance malaise.
Technology
According to Tansey, Wateridge & Darnton (2010), technology has become an inseparable and
integral part of modern business organizations and has resulted in tremendous growth in commerce
and trade. Technology has and continues to revolutionize business models and concepts, from
customer service to manufacturing and research and development. The actions of technology in
business include management information systems, computers, cloud computing, accounting and
other systems, design and development systems, and customer service systems. Technology will be
evaluated across several departments and sections of the company. The technology scope will
include computers and computer systems, tools for working, and even facilities for doing research
and development (Tansey, Wateridge & Darnton 2010). the areas to be looked at at Latino
Engineering include computer systems, existing technology systems, networks and tool sets,
procurement and supply chain systems, and equipment needs, such as new machining tools. The
vision is to have computerized systems at Latino Engineering starting from design, development,
testing to supply chain management and customer service. It should be possible for development
teams to collaborate and interact using computer systems, even with clients so as to solve the
problem of lack of follow up with clients during the phase of design and development.
Computerized customer services, sales, and accounting systems will ensure better customer service
and greater response to the needs of customers.
Information
The intangible areas that include data and information will also be reviewed; according to (),
information and information systems play a crucial role in organizations by satisfying various
diverse needs using systems such as analysis systems, query systems, decision support systems, and
modeling systems. Since information is intangible, establishing them in the early stages can be a
challenge but focus will be placed on information systems flows and stakeholders, a well as
reporting needs. The existing information will be evaluated and the kinds of required information
determined for CI (Valverder & Talia 2012). The existing systems for reporting will be looked at
along with new data requirements for feeding into reports and data outcomes specific to given
activities and processes, such as customer service and relationship management. The vision is a
Paraphrase This Document
Need a fresh take? Get an instant paraphrase of this document with our AI Paraphraser
Latino Engineering information system that automatically updates, such as the number of design
and testing cycles, number of customer contacts and interactions, employee absenteeism, daily and
weekly sales reports per product, and stock and inventory levels. These are then used for high level
decision making to support operations based on data and information, rather than based on hunches
and methods (Valverder & Talia 2012).
With these evaluated and a new blueprint and vision developed, the 7 QC Tools will then be
employed to help the CI process through measurement and evaluation to help focus where effort
and resources should be committed for the best results.
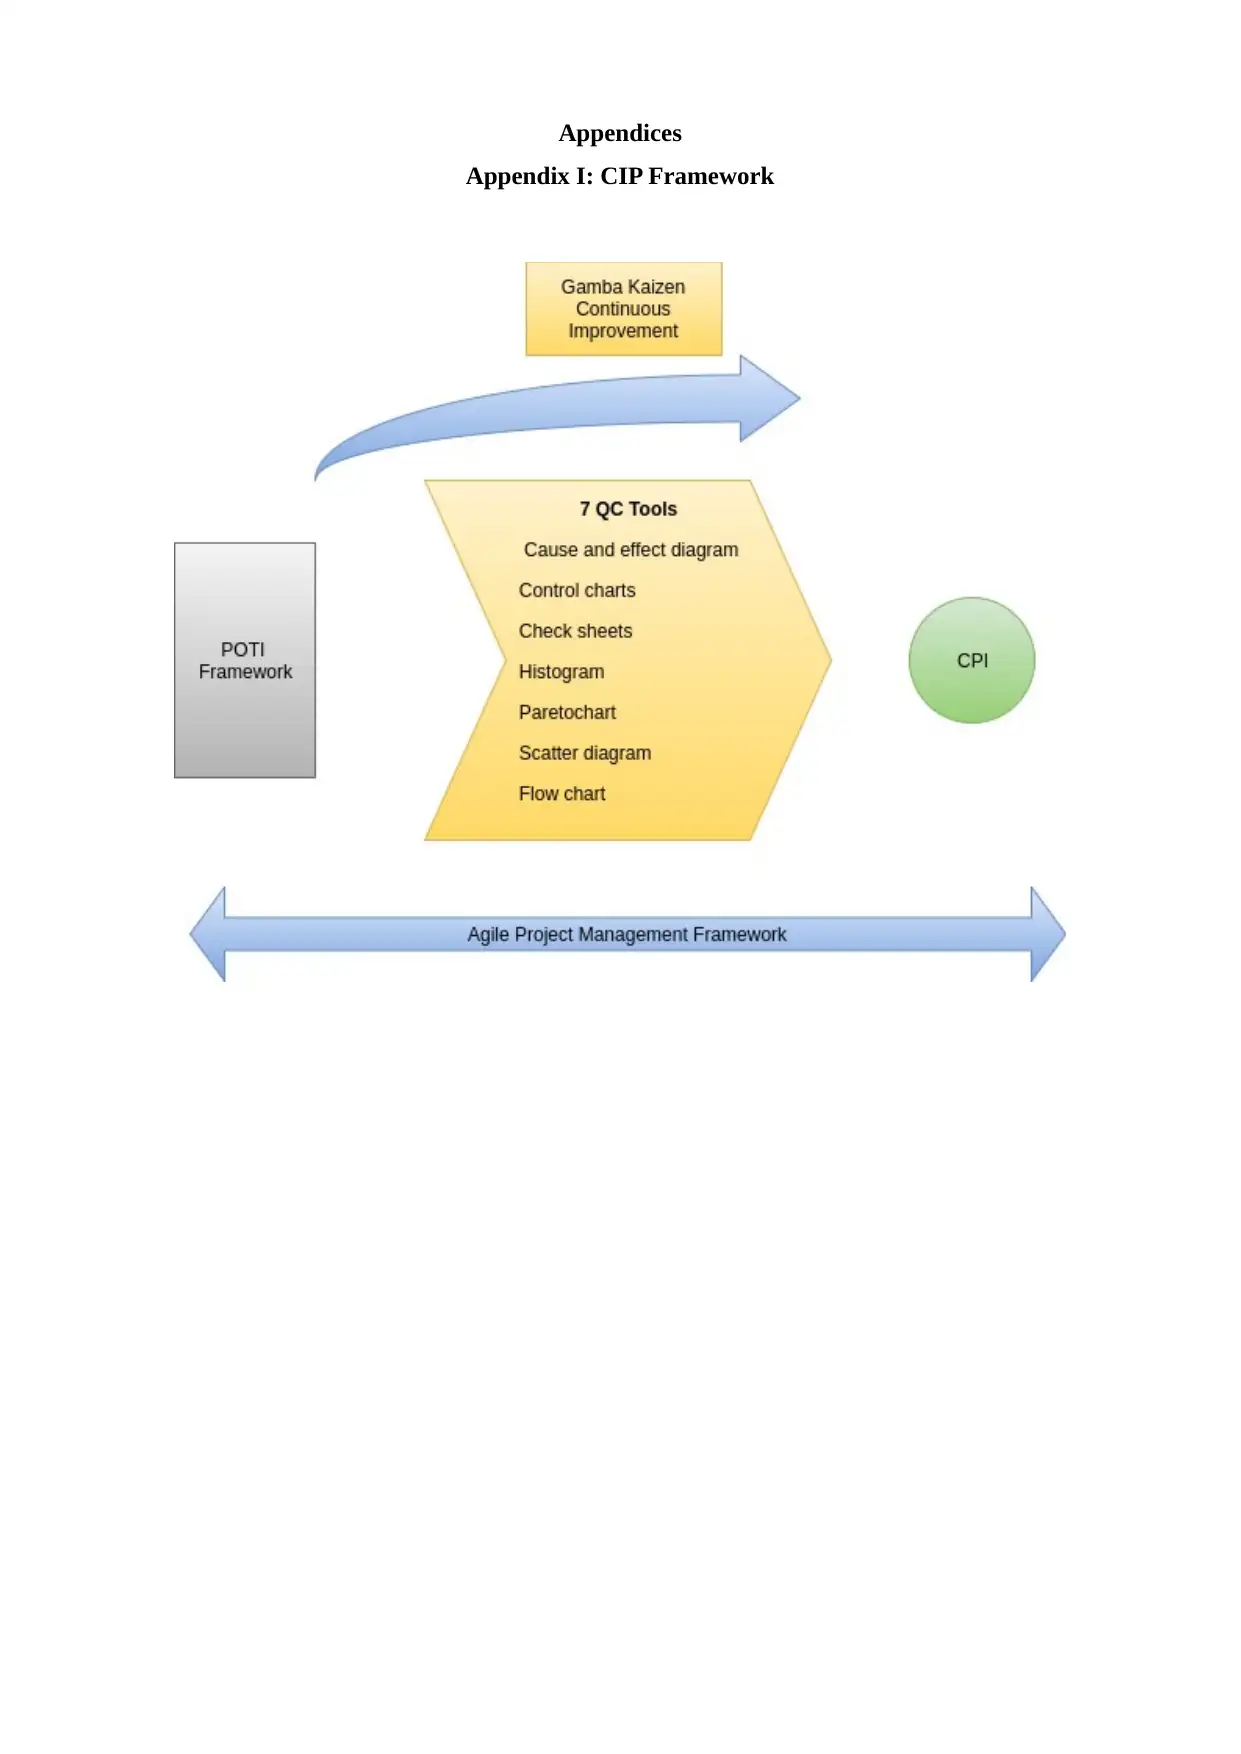
Seven Quality Control Tools for CPI
The seven quality control tools (known as the 7 QC tools) refer to fairly simple tools for data
analysis that are utilized in support efforts at quality improvement. The tools are simple to apply
and use and do not need the use of sophisticated statistical metrics for CI according to Biswas
(2015). The tools include;
Cause and effect diagram: this identifies the several possible causes for a problem or effect and
sorts ideas into usable categories
Check sheets: these are forms that are structured used for data collection and analysis and can be
adapted for a wide range of activities
Control charts: These are graphs utilized in studying how processes change with time
Histogram: This is a graph used to shoe frequency distributions and frequency of occurrence of
different values in data sets
Pareto chart: This is used to depict the more significant factors
Scatter diagram: This a tool that graphs numerical data pairs with two variables compared on
every axis of the Cartesian plane.
Flow chart: This graphically depicts the inputs, actions and outputs for a given system to show the
process flows
Cause and Effect Diagrams
According to Biswas (2015), achieving process improvement requires action to be taken on causes
of variation; however, the possible causes of effects/ problems for applications; using the cause and
effect diagram, the knowledge groups have in relation to a specific problem are organized and
graphically displayed. The cause and effect diagram will be developed by drawing a flow chart of
the areas that need improvement, such as product design and customer service. This is then
followed by a definition of the problem to be solved (the five identified problems) and then
brainstorming will be undertaken to establish all possible problem causes, for instance, defective
engineering products may be due to poor design and lack of sufficient testing before delivery. With
this information, a cause and effect diagram accurately reflecting and displaying the data
and testing cycles, number of customer contacts and interactions, employee absenteeism, daily and
weekly sales reports per product, and stock and inventory levels. These are then used for high level
decision making to support operations based on data and information, rather than based on hunches
and methods (Valverder & Talia 2012).
With these evaluated and a new blueprint and vision developed, the 7 QC Tools will then be
employed to help the CI process through measurement and evaluation to help focus where effort
and resources should be committed for the best results.
Seven Quality Control Tools for CPI
The seven quality control tools (known as the 7 QC tools) refer to fairly simple tools for data
analysis that are utilized in support efforts at quality improvement. The tools are simple to apply
and use and do not need the use of sophisticated statistical metrics for CI according to Biswas
(2015). The tools include;
Cause and effect diagram: this identifies the several possible causes for a problem or effect and
sorts ideas into usable categories
Check sheets: these are forms that are structured used for data collection and analysis and can be
adapted for a wide range of activities
Control charts: These are graphs utilized in studying how processes change with time
Histogram: This is a graph used to shoe frequency distributions and frequency of occurrence of
different values in data sets
Pareto chart: This is used to depict the more significant factors
Scatter diagram: This a tool that graphs numerical data pairs with two variables compared on
every axis of the Cartesian plane.
Flow chart: This graphically depicts the inputs, actions and outputs for a given system to show the
process flows
Cause and Effect Diagrams
According to Biswas (2015), achieving process improvement requires action to be taken on causes
of variation; however, the possible causes of effects/ problems for applications; using the cause and
effect diagram, the knowledge groups have in relation to a specific problem are organized and
graphically displayed. The cause and effect diagram will be developed by drawing a flow chart of
the areas that need improvement, such as product design and customer service. This is then
followed by a definition of the problem to be solved (the five identified problems) and then
brainstorming will be undertaken to establish all possible problem causes, for instance, defective
engineering products may be due to poor design and lack of sufficient testing before delivery. With
this information, a cause and effect diagram accurately reflecting and displaying the data
relationships in every category will then be developed (Vasconcellos 2007). A good cause-
effect digram has many ‘twigs’ ; the more the branches, the deeper the understanding of the problem
and its causes.
Check sheets
Check sheets are used for the collection and tallying of data and information; the check sheet is
made up of items or lists and an indicator showing how often an item occurs on the list. Checklists
make it easy for data to be collected because they they provide events likely to occur in a pre-
written format. For instance, they can be used to determine the number of inspections of
engineering equipment done per week, the number of tests and simulations done for a product over
a given time period, among others. The check sheets records counted or measured data and can be
designed to show the day, shift, and month of the event (Fredendall & Hill 2001)
Histograms
These will be created through grouping measurements into cells and will be useful in determining
data set shapes. The histogram displays data so that it is easy to observe central tendencies and
dispersion and for comparing requirements for distributions. A such, they will be valuable tools for
trouble shooting and can reveal important differences, such as in equipment quality between
different groups and different processes. A control chart should always be constructed before the
histogram is constructed. The number of data points falling within a bar and shows the frequency
for that specific data point (Tague 2015).
Pareto Chart
This will be used for analysis by ranking opportunities to establish which of the many possible
opportunities should be tackled first. It involves determining the vital few; the important factors that
contribute to 80% of the problems from the trivial many; the factors that contribute to 20% of the
problems; it works based on the 80/20 principle. The tool will be used at various stages during the
process of quality improvement as it will help determine the next step to take (Collier & Evans
2011).
Scatter Diagram
The scatter diagram is used for analyzing the cause and effect relationships by plotting a given
variable against the other; on e of the variables is the independent variable which is not affected by
the other and the other is the dependent variable that is affected by changes in the independent
variable. When being plotted, the dependent variable is shown on the Y axis while the independent
variable is on the X axis. It works on the assumption that the independent variable causes the
dependent variable to change. After being plotted, dots will be seen and from these dots a best line
of fit is drawn to establish whether the relationship is positive or negative and whether it is strong or
weak. Once the relationship has been established (the slope of the best fit line), it can be used to
⊘ This is a preview!⊘
Do you want full access?
Subscribe today to unlock all pages.
Trusted by 1+ million students worldwide
make general predictions on how the dependent variable will change based on any movement of the
independent variable (Biswas 2015).
Flow Charts
This is a graphical tool for depicting all the inputs, actions taken, and the outputs from the actions in
a system. Inputs are production factors such as materials, equipment and labor; actions are the
manner in which inputs are combined and utilized to add value while outputs are the services or
products through action on the inputs. This process map will be useful in helping in understanding
of processes; it depicts containers, products, or operator action sequences and can be used as the
starting point for making improvements as they help identify opportunities for improvements,
according to Kehoe (2012)
Control Charts
This will be used in classifying variations based on whether they are due to special causes or
common causes; special cause variations pertain to variations caused by assignable causes for
example if an untrained person works on a highly specialized process. A common cause variation
pertains to those due to how processes were designed, for example what is seen when many people
work in a process; each person does things differently or slightly differently. In the chart, the Y axis
has the metric of interest while the X axis contains the time or a factor of time, such as the number
of runs or lots. Three statistically computed lines, using historical information, show the difference
between the control chart and the run chart; the three are the center line which is the mean for the
metric of interest, the upper control limit which is the metrics’ mean - (minus) 3 x the metric
standard deviation, and the lower control limit which is the metrics’ mean + (plus) 3 x the metric
standard deviation (Kehoe 2012).
Gemba Kaizen for Continuous Improvement (CI)
The 7 QC tools will be used severally and repeatedly to attain true CI; to achieve this continuity, the
Gemba Kaizen method for continuous improvement will be used. It simply means continuous
improvement and is used for workplace harmonization, elimination of work that is overly hard, and
to teach people how to make out and eliminate wastes in processes, in addition to continuous
improvement. Gemba Kaizen is a continuous cycle with seven phases that include opportunity
identification, process analysis, optimal solution development, solution implementation, evaluation
of the results, solution standardization, and finally, planning for the future (Haghirian 2010).
Project Management Methodology
This report will use the agile project management framework in which solutions are developed and
tested and results evaluated in an incremental way. This will blend well with the POTI framework,
along with the use of Gemba Kaizen and the 7QC Tools, according to Bell (2016).
Conclusion
Paraphrase This Document
Need a fresh take? Get an instant paraphrase of this document with our AI Paraphraser
Looking at the challenges and problems presently faced by Latino Engineering, it is obvious there
are structural and personnel challenges that need to be addressed. This report proposes the
evaluation of the company’s blueprint and development of a vision using the POTI framework. To
attain CPI and solve its problems, it is proposed that the 7 QC tools are the most suitable for
establishing causes, prioritizing actions, and establishing relationships between causes and effects.
Continuous improvement will be achieved by using the Gemba Kaizen framework within the
context of the agile project management methodology to ensure quality is improved over time based
on metrics and facts derived from the application and use of the afore mentioned tools.
References
Bell, S. C. (2016). Run Grow Transform: Integrating Business and Lean IT. Boca Raton, FL,
Productivity Press
Biswas, P. (2015). Kaoru Ishikawa’s Basic Seven QC Tools. [online] APB Consultant. Available at:
http://isoconsultantpune.com/kaoru-ishikawas-basic-seven-qc-tools/ [Accessed 4 Oct. 2017].
Collier, D. A., & Evans, J. R. (2012). Operations management. Mason, OH, South-Western College
Pub.
Fredendall, L. D., & Hill, E. (2001). Basics of supply chain management. Boca Raton, Fla, St. Lucie
Press. http://www.crcnetbase.com/isbn/9781574441208.
Haghirian, P. (2011). Understanding Japanese management practices. New York, N.Y., Business
Expert Press.
Joe (2017). 9 Ways to Measure a Business Process - Business Enterprise Mapping. [online]
Business Process Mapping for Sustainable Improvement. Available at:
http://www.businessmapping.com/blog/9-ways-to-measure-a-business-process/ [Accessed 4 Oct.
2017].
Kehoe, D. F. (2012). The fundamentals of quality management. Berlin, Germany: Springer
Olenski, S. (2015). 8 Key Tactics For Developing Employees. [online] Forbes.com. Available at:
https://www.forbes.com/sites/steveolenski/2015/07/20/8-key-tactics-for-developing-employees/
#507f890f6373 [Accessed 4 Oct. 2017].
Tague, N. R. (2015). The quality toolbox. New Delhi, India : Infotech Standards India PV.LTD
Tansey, S. D., Wateridge, J., & Darnton, G. (2010). Business, information technology and society.
London, Routledge, Taylor & Francis Group.
Vasconcellos, j. A. (2007). Quality assurance for the food industry: a practical approach. New
York, CRC Press Inc.
Valverde, R., & Talla, M. R. (2012). Information systems reengineering for modern business
systems ERP, supply chain and e-commerce management solutions. Hershey, PA, Information
Science Reference.
⊘ This is a preview!⊘
Do you want full access?
Subscribe today to unlock all pages.
Trusted by 1+ million students worldwide
Appendices
Appendix I: CIP Framework
Appendix I: CIP Framework
Paraphrase This Document
Need a fresh take? Get an instant paraphrase of this document with our AI Paraphraser
Appendix Ii: The 7 QC Tolls
1 out of 11
Related Documents


Your All-in-One AI-Powered Toolkit for Academic Success.
+13062052269
info@desklib.com
Available 24*7 on WhatsApp / Email
![[object Object]](/_next/static/media/star-bottom.7253800d.svg)
Unlock your academic potential
Copyright © 2020–2026 A2Z Services. All Rights Reserved. Developed and managed by ZUCOL.