Project Management Assignment: Networks, Scheduling, and Analysis
VerifiedAdded on  2022/10/13
|14
|1441
|40
Project
AI Summary
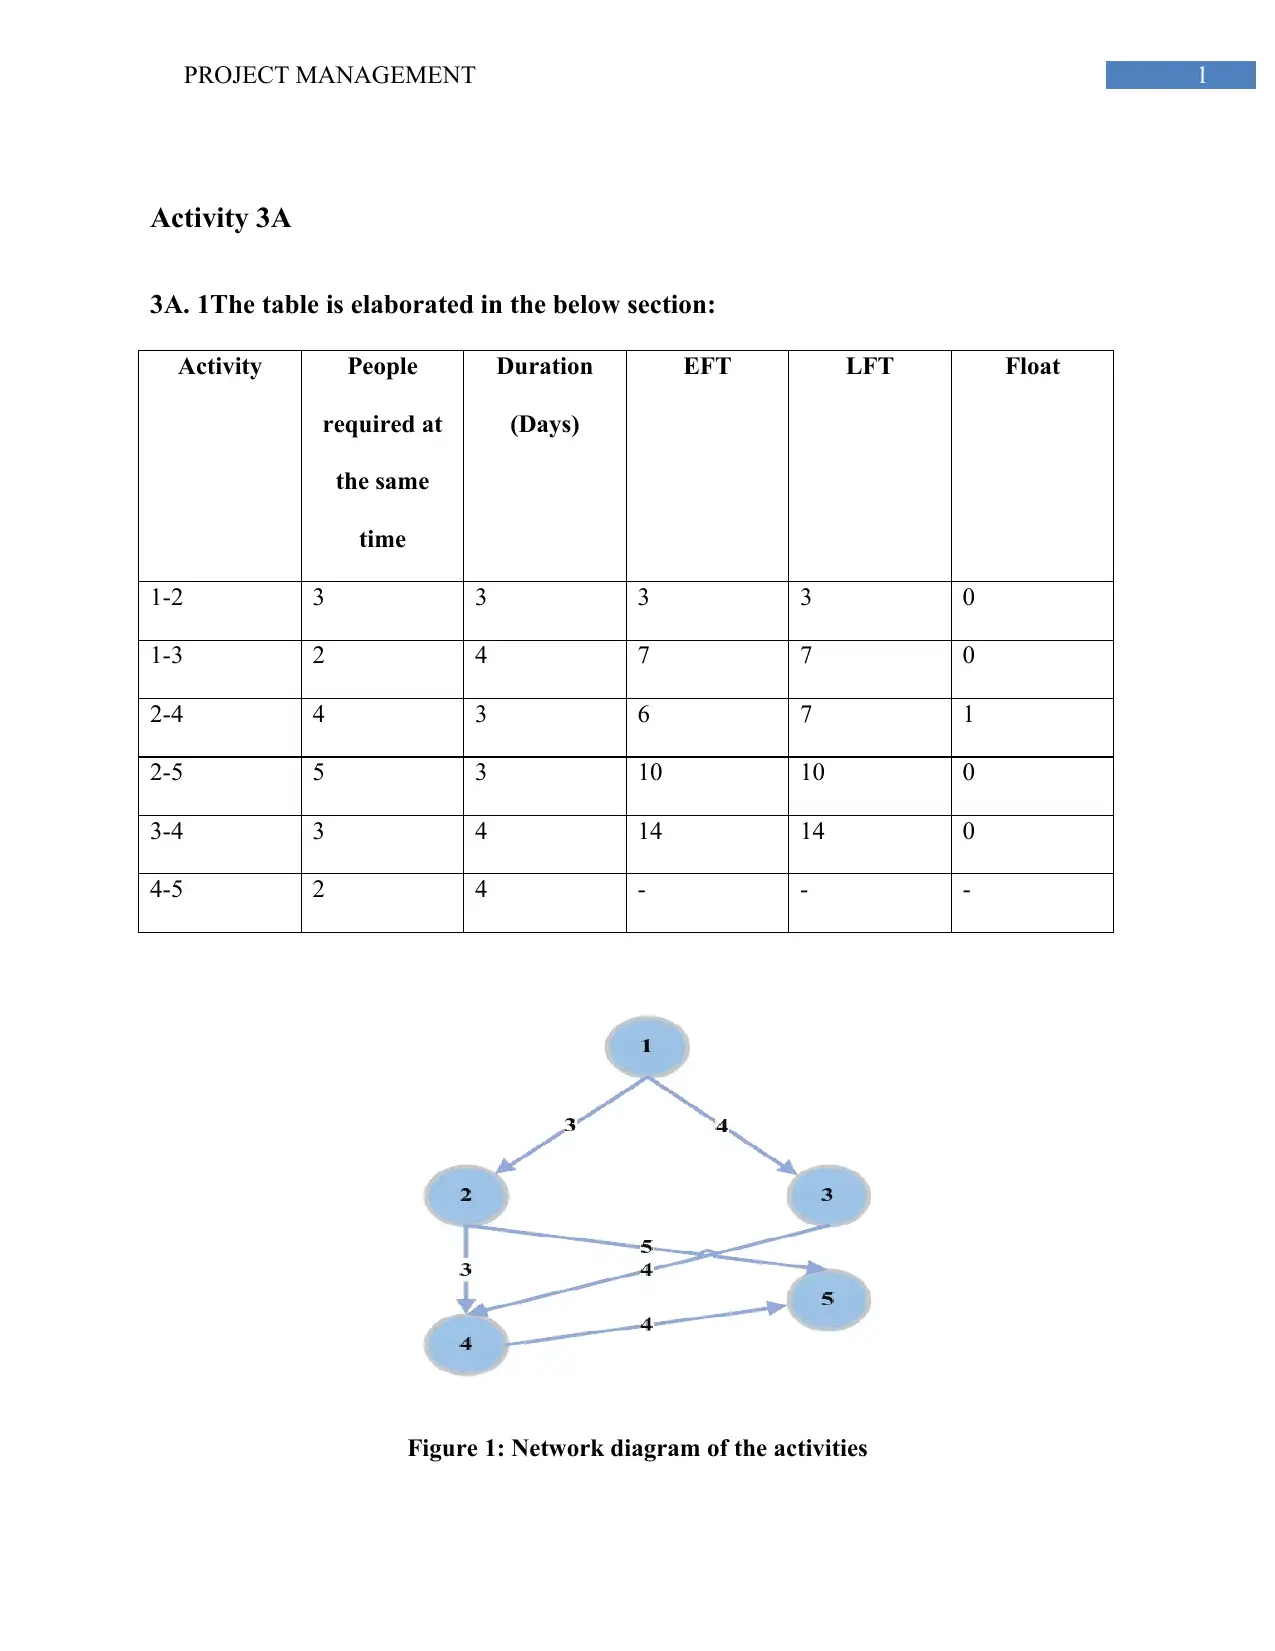
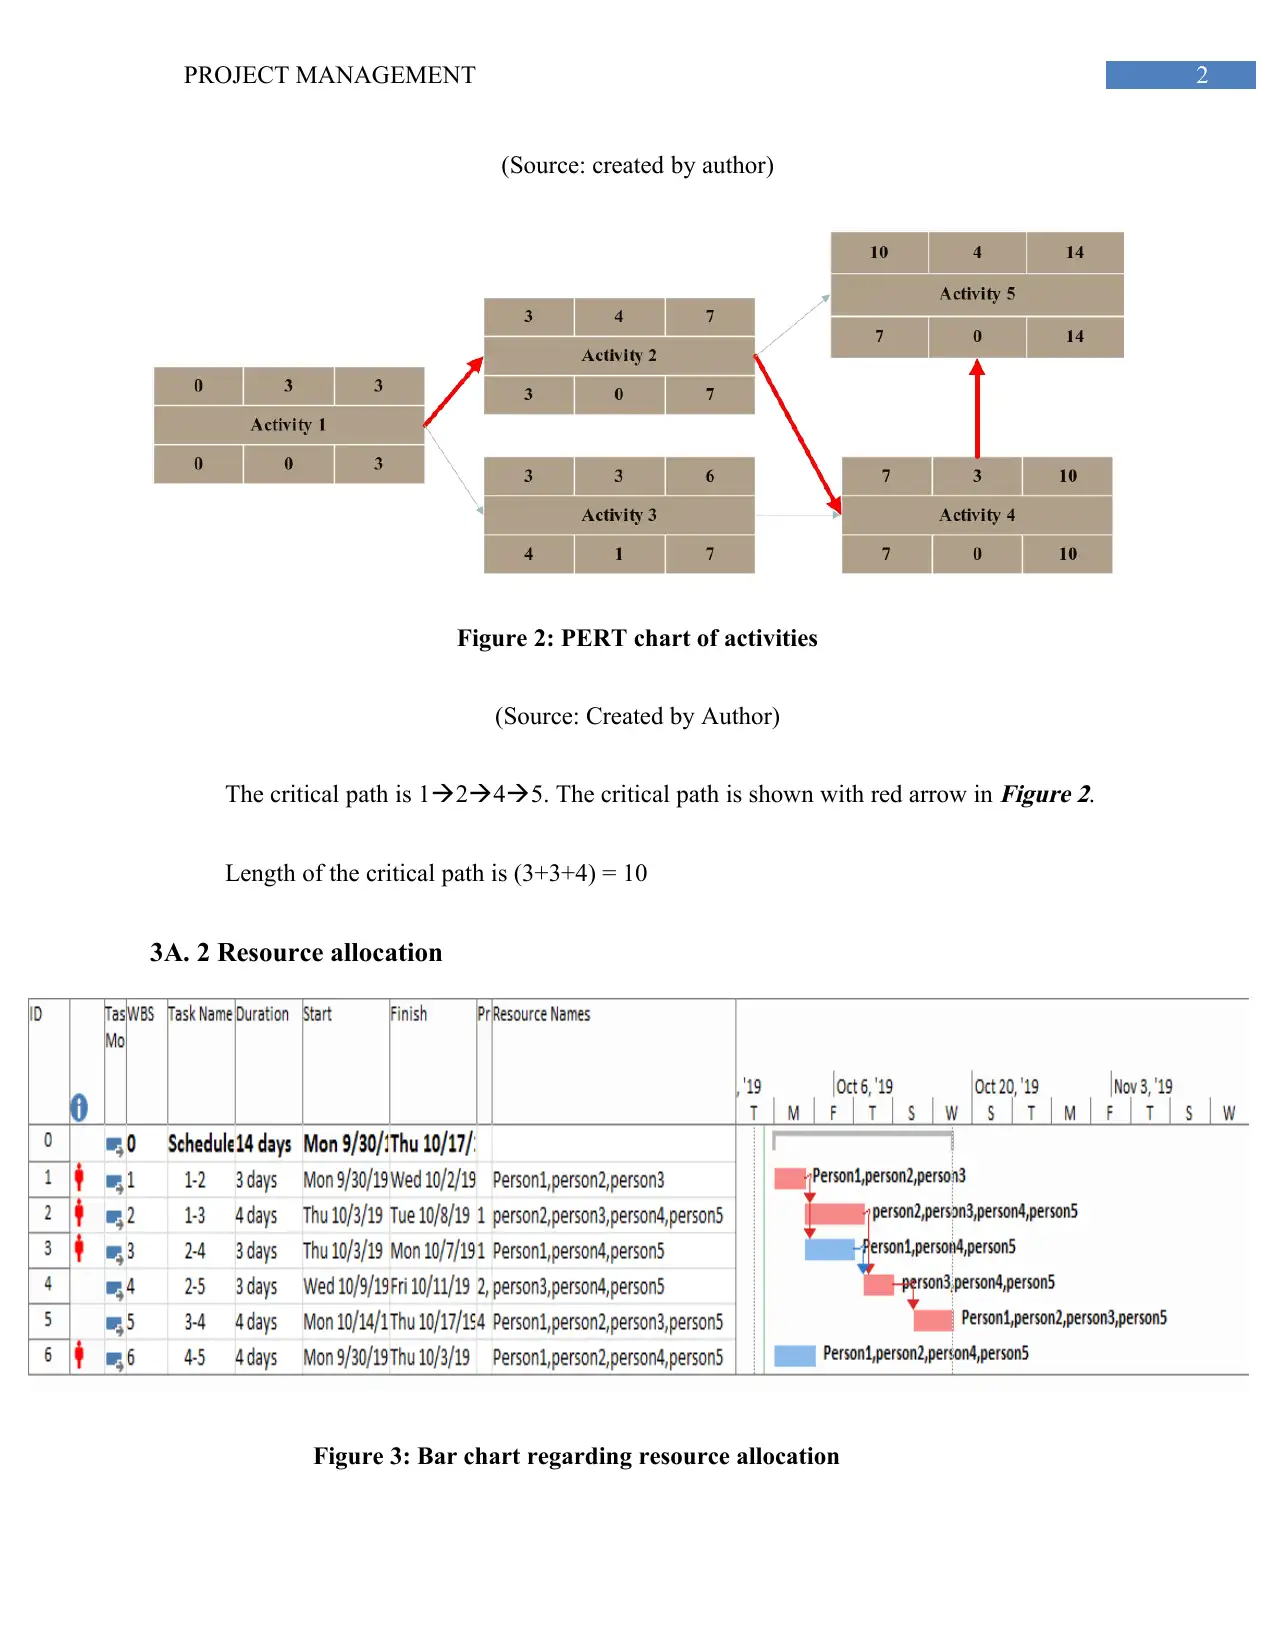
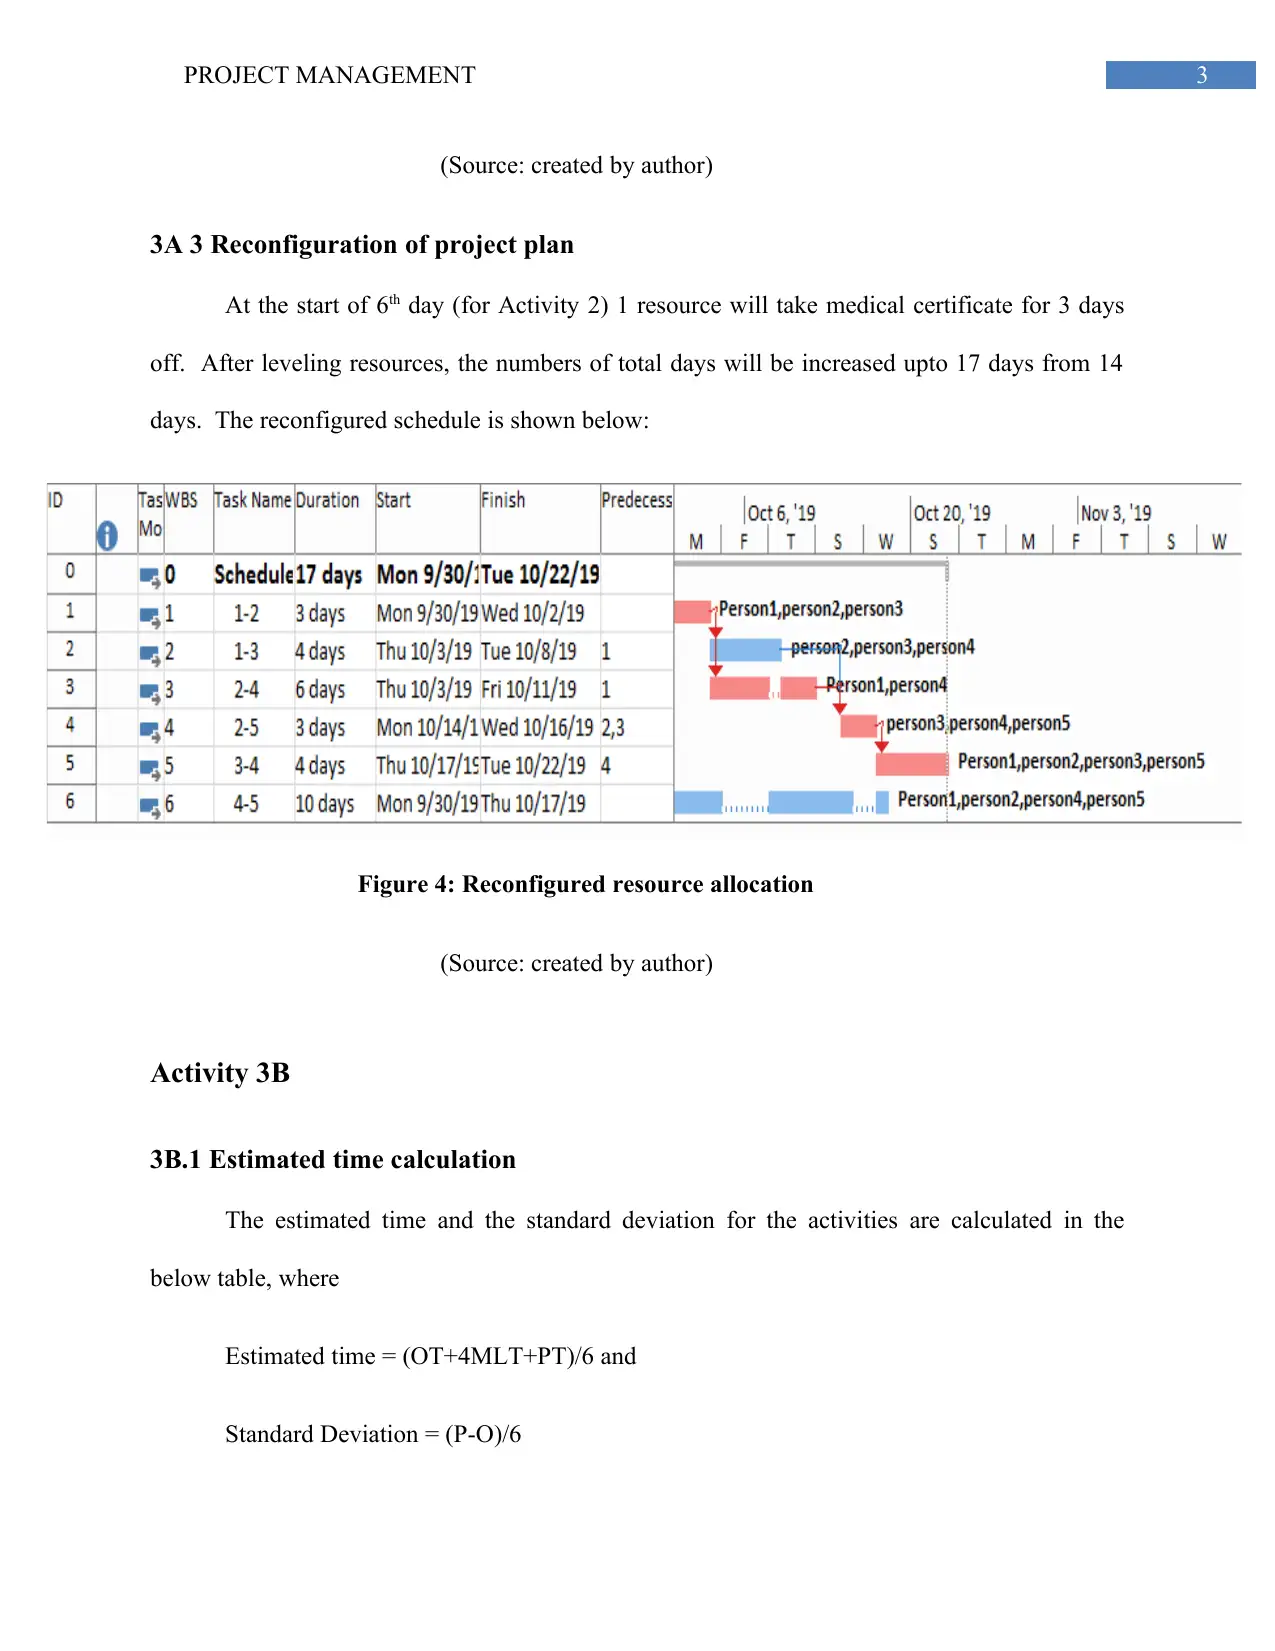
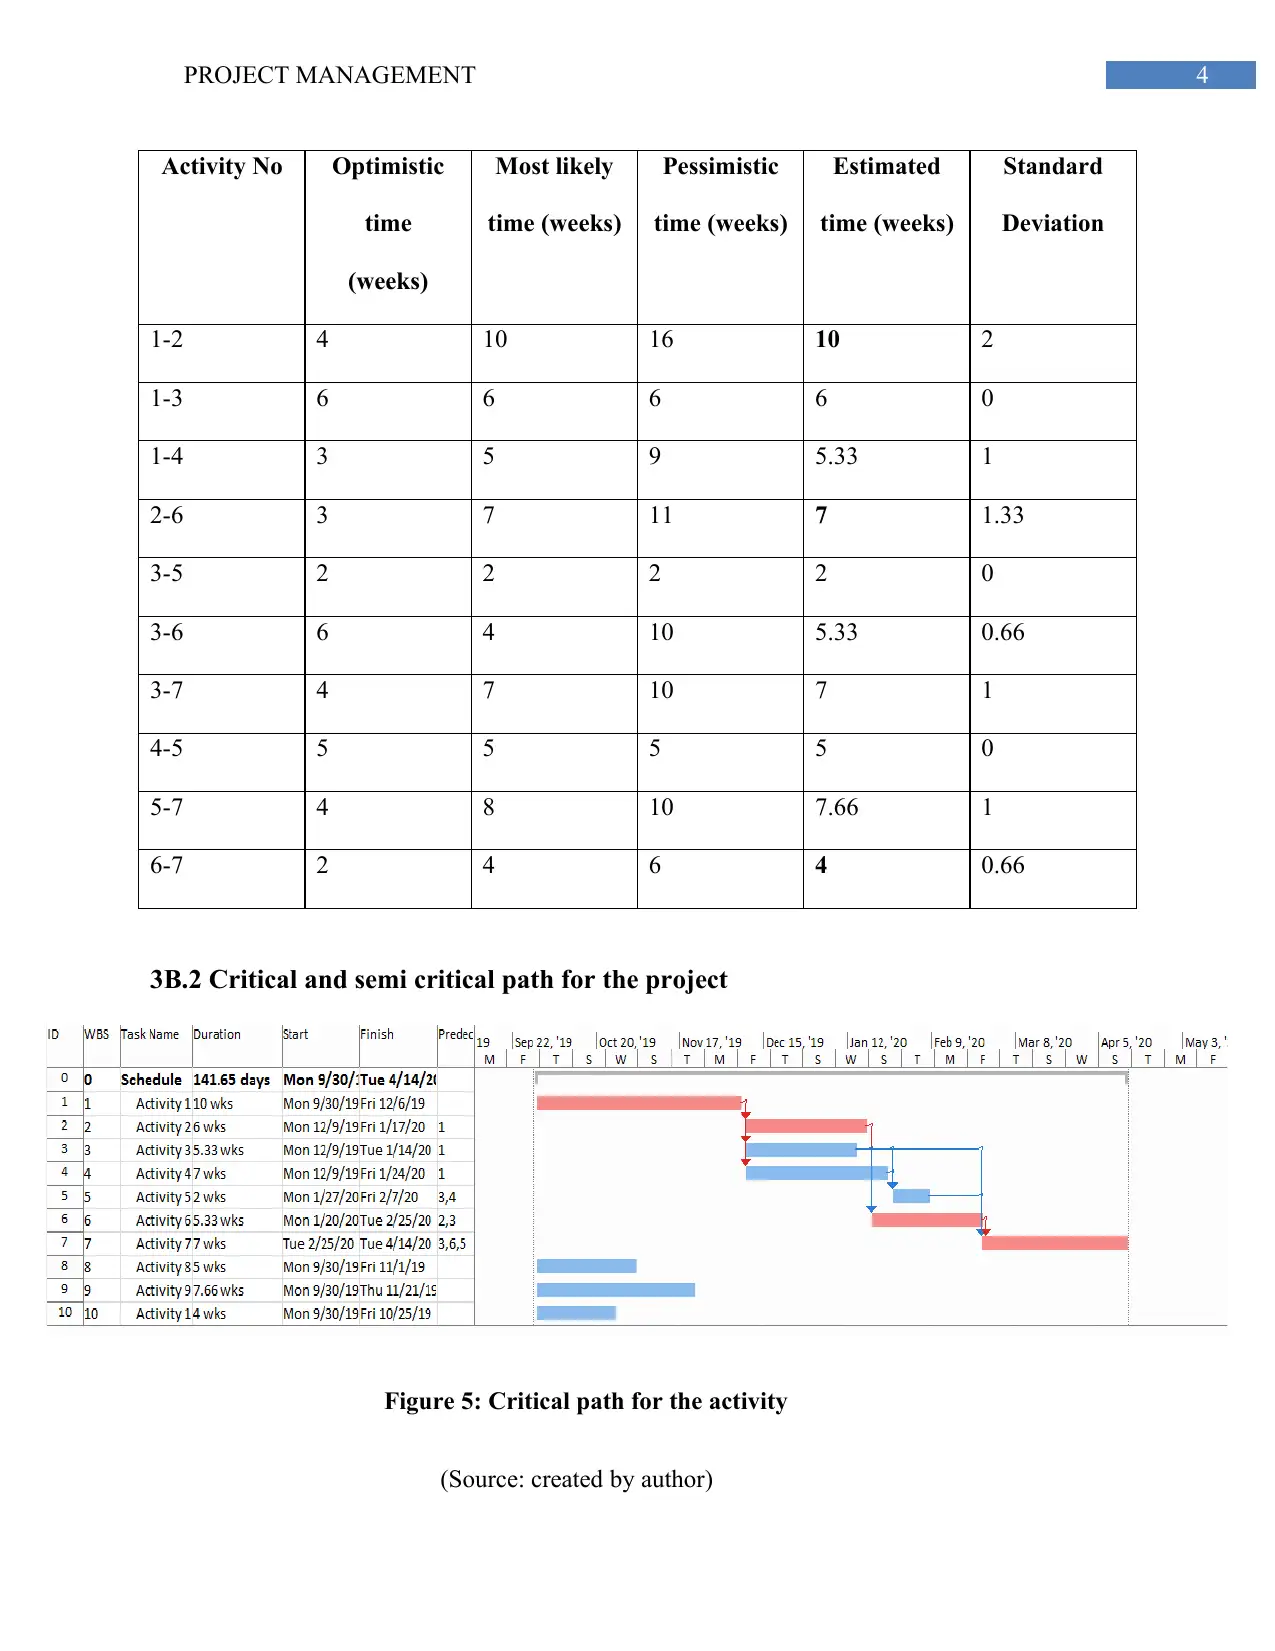
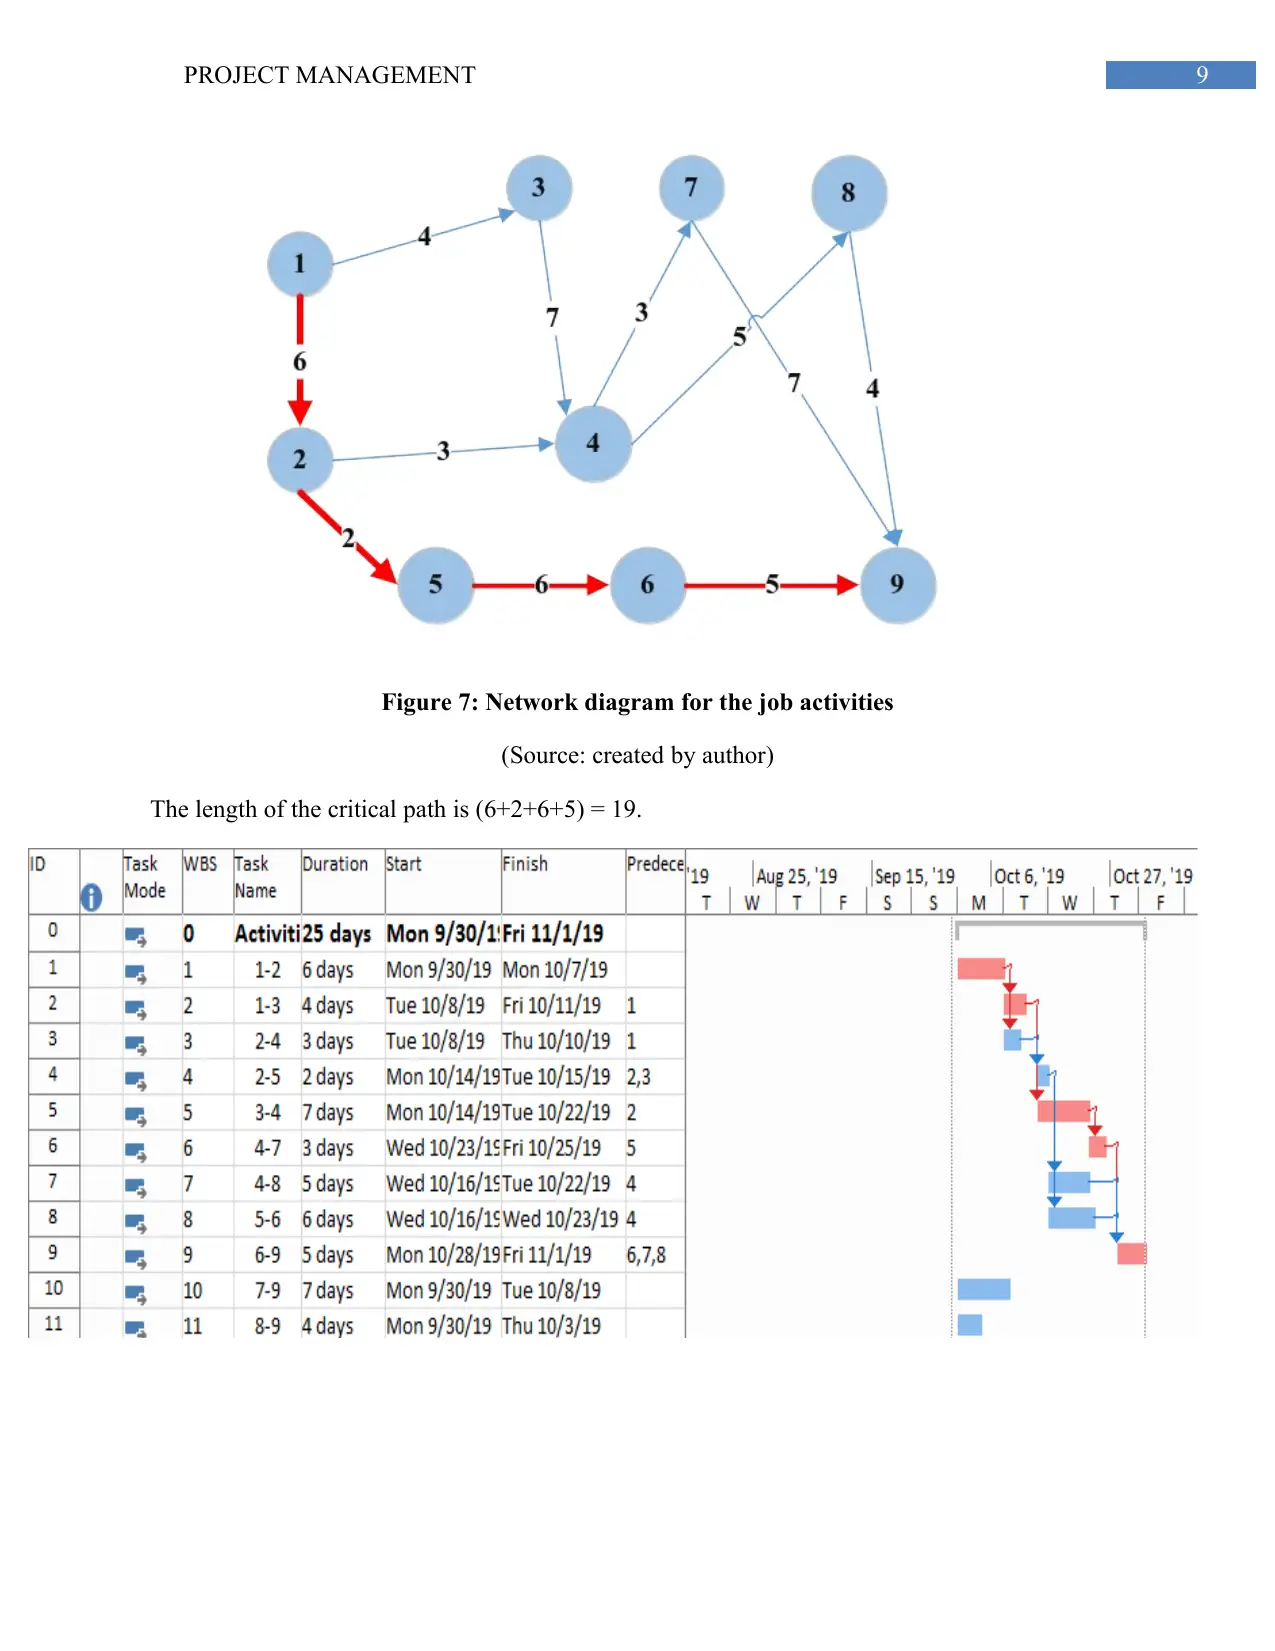
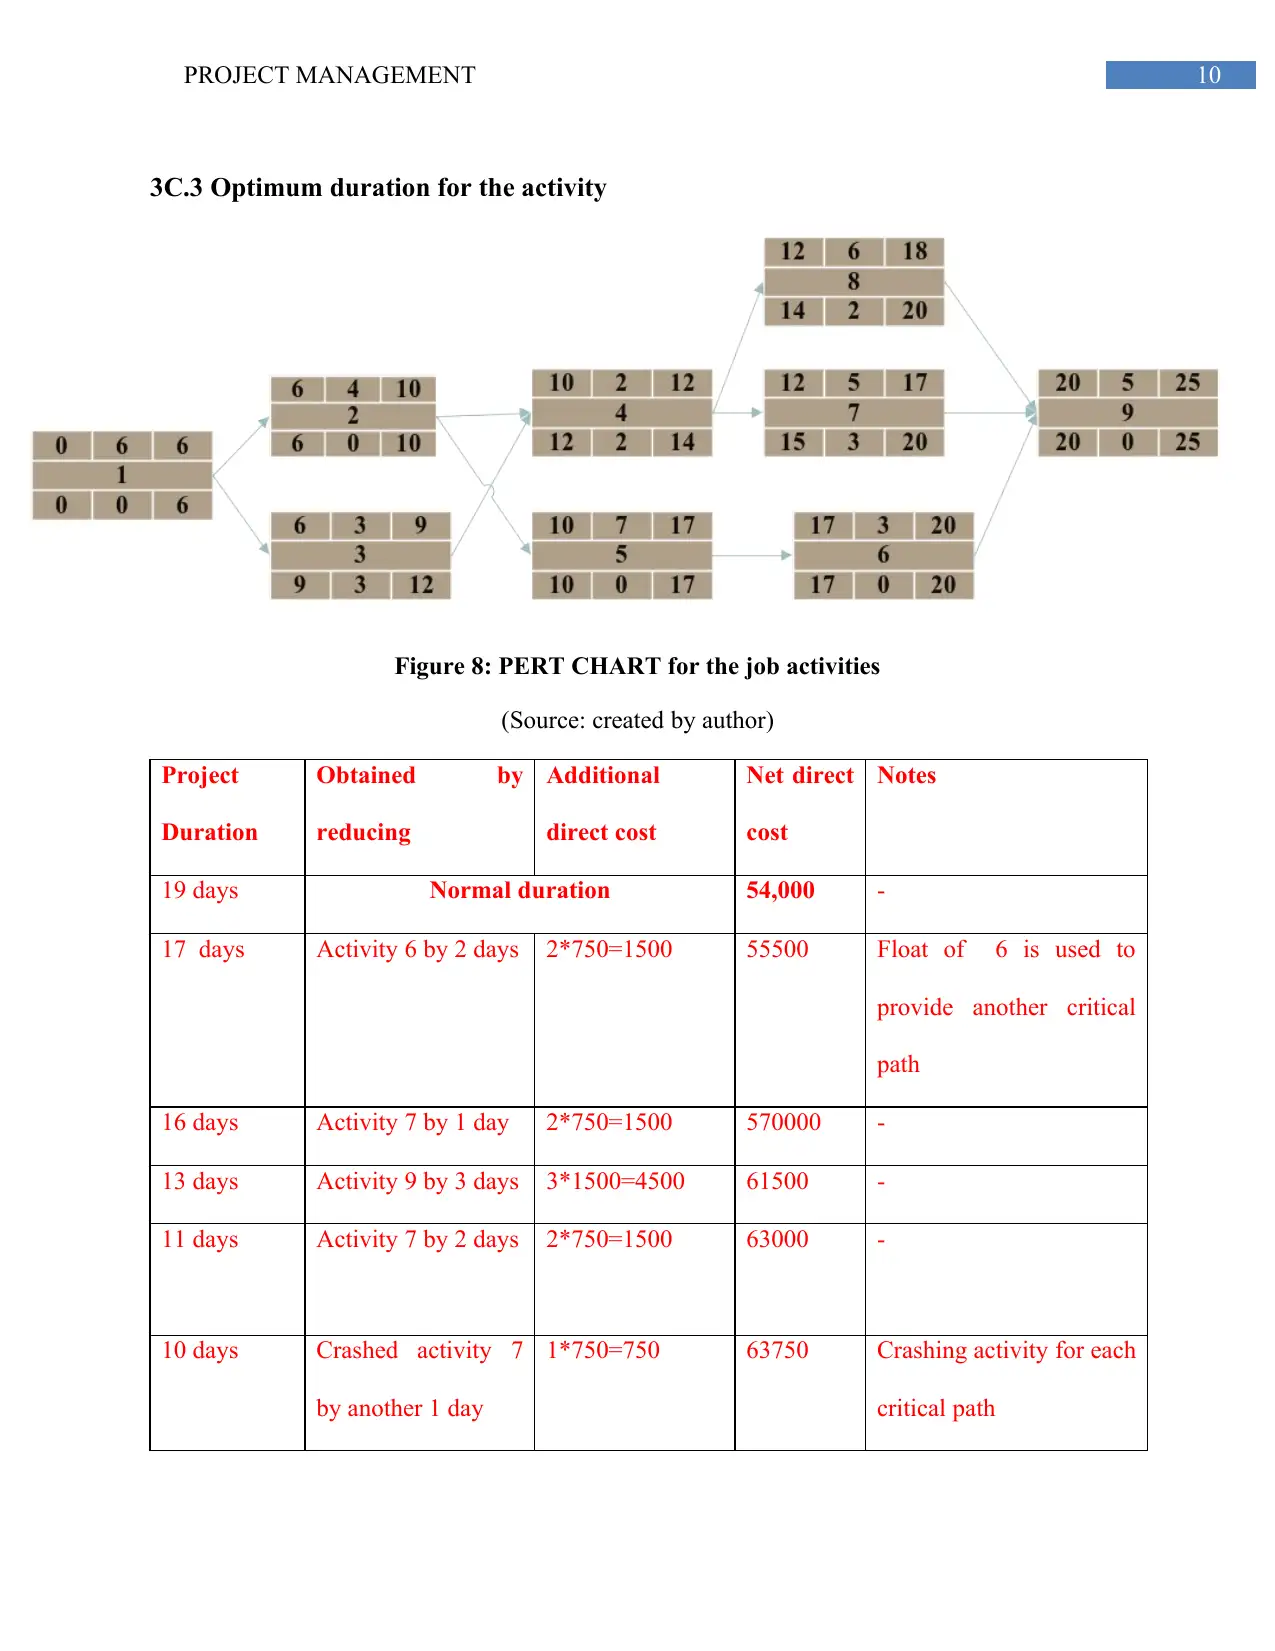
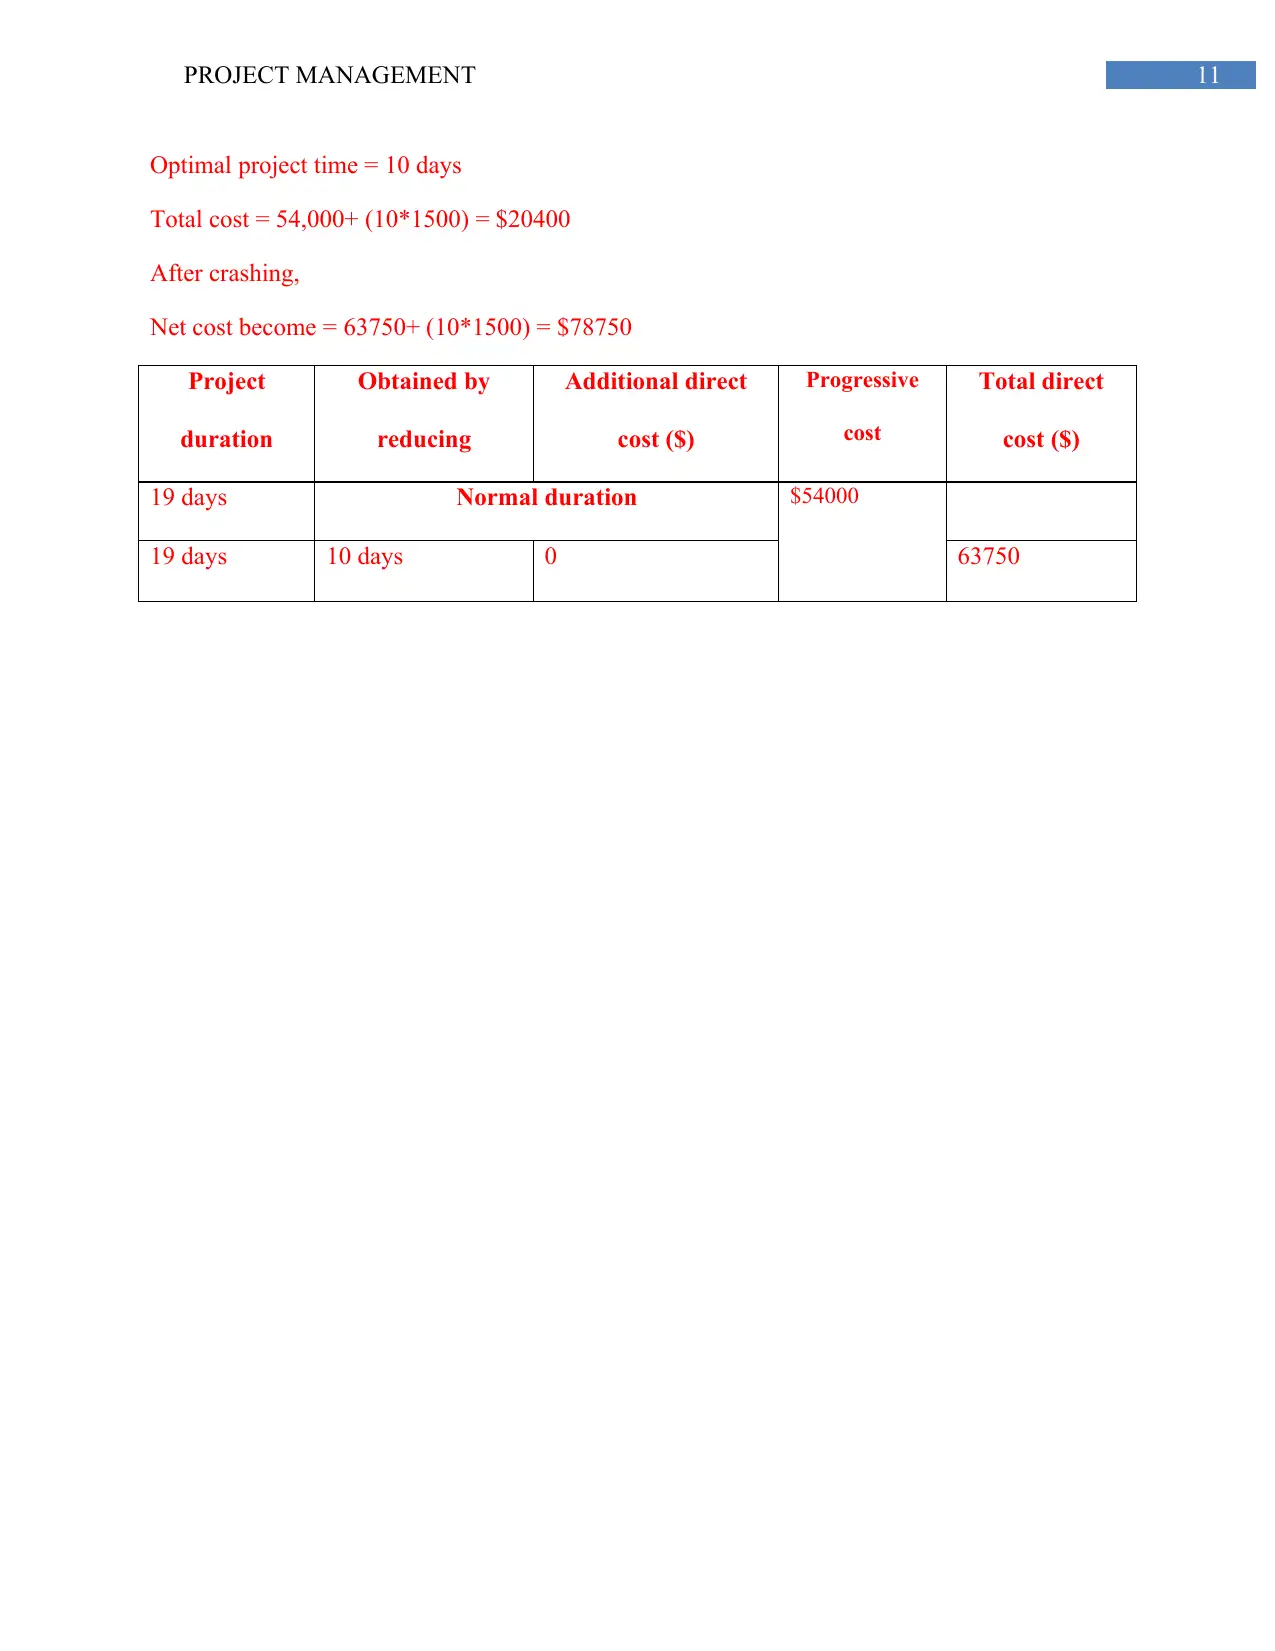
This document presents a comprehensive solution to a project management assignment, addressing key aspects of project planning and execution. It begins with activity analysis, network diagram creation, and critical path identification using PERT and network diagrams. The solution then delves into resource allocation using bar charts. Further, it explores project reconfiguration in response to resource constraints. The assignment also involves estimating time and standard deviation for project activities, critical and semi-critical path analysis, and calculating probabilities related to project completion time. The document further includes network diagrams, crash analysis, and project cost optimization, demonstrating how to minimize project duration and cost. The document also contains all the necessary charts and diagrams for better understanding.

Running head: PROJECT MANAGEMENT
Project Management: Networks, scheduling and analysis
Name of the Student:
Name of the University:
Project Management: Networks, scheduling and analysis
Name of the Student:
Name of the University:
Paraphrase This Document
Need a fresh take? Get an instant paraphrase of this document with our AI Paraphraser

1PROJECT MANAGEMENT
Activity 3A
3A. 1The table is elaborated in the below section:
Activity People
required at
the same
time
Duration
(Days)
EFT LFT Float
1-2 3 3 3 3 0
1-3 2 4 7 7 0
2-4 4 3 6 7 1
2-5 5 3 10 10 0
3-4 3 4 14 14 0
4-5 2 4 - - -
Figure 1: Network diagram of the activities
Activity 3A
3A. 1The table is elaborated in the below section:
Activity People
required at
the same
time
Duration
(Days)
EFT LFT Float
1-2 3 3 3 3 0
1-3 2 4 7 7 0
2-4 4 3 6 7 1
2-5 5 3 10 10 0
3-4 3 4 14 14 0
4-5 2 4 - - -
Figure 1: Network diagram of the activities

2PROJECT MANAGEMENT
(Source: created by author)
Figure 2: PERT chart of activities
(Source: Created by Author)
The critical path is 1ïƒ 2ïƒ 4ïƒ 5. The critical path is shown with red arrow in
Figure 2.
Length of the critical path is (3+3+4) = 10
3A. 2 Resource allocation
Figure 3: Bar chart regarding resource allocation
⊘ This is a preview!⊘
Do you want full access?
Subscribe today to unlock all pages.

Trusted by 1+ million students worldwide

3PROJECT MANAGEMENT
(Source: created by author)
3A 3 Reconfiguration of project plan
At the start of 6th day (for Activity 2) 1 resource will take medical certificate for 3 days
off. After leveling resources, the numbers of total days will be increased upto 17 days from 14
days. The reconfigured schedule is shown below:
Figure 4: Reconfigured resource allocation
(Source: created by author)
Activity 3B
3B.1 Estimated time calculation
The estimated time and the standard deviation for the activities are calculated in the
below table, where
Estimated time = (OT+4MLT+PT)/6 and
Standard Deviation = (P-O)/6
(Source: created by author)
3A 3 Reconfiguration of project plan
At the start of 6th day (for Activity 2) 1 resource will take medical certificate for 3 days
off. After leveling resources, the numbers of total days will be increased upto 17 days from 14
days. The reconfigured schedule is shown below:
Figure 4: Reconfigured resource allocation
(Source: created by author)
Activity 3B
3B.1 Estimated time calculation
The estimated time and the standard deviation for the activities are calculated in the
below table, where
Estimated time = (OT+4MLT+PT)/6 and
Standard Deviation = (P-O)/6
Paraphrase This Document
Need a fresh take? Get an instant paraphrase of this document with our AI Paraphraser

4PROJECT MANAGEMENT
Activity No Optimistic
time
(weeks)
Most likely
time (weeks)
Pessimistic
time (weeks)
Estimated
time (weeks)
Standard
Deviation
1-2 4 10 16 10 2
1-3 6 6 6 6 0
1-4 3 5 9 5.33 1
2-6 3 7 11 7 1.33
3-5 2 2 2 2 0
3-6 6 4 10 5.33 0.66
3-7 4 7 10 7 1
4-5 5 5 5 5 0
5-7 4 8 10 7.66 1
6-7 2 4 6 4 0.66
3B.2 Critical and semi critical path for the project
Figure 5: Critical path for the activity
(Source: created by author)

5PROJECT MANAGEMENT
The project will take approximately 20.23 weeks to be completed and critical path for the
project is (1ïƒ 2ïƒ 6ïƒ 7) the length of the critical path is = (10+7+4) =21 weeks
3B. 3 Probability of project taking 23 weeks
Length of the critical path= 21
Total Standard Deviation= (2+1+1.33+0.66+1+1+0.66) = 7.65
Probability of taking more than 23 weeks = (Number of weeks- Critical Path)/ total SD
= (23- 21)/ 7.65
= 2/7.65
= 0.2613
Therefore, NORMSDIST (0.2613) = 0.6030
Probability of occurrences = 60% or there is 60 % chances where the project will take 23
weeks to be completed instead of 20.23 weeks.
3B.4 Likelihood of the happening
Likelihood of the happening = (Number of days- Critical path length)/ total SD
= (18- 21)/7.65
=-0.39216
Therefore, Probability of (-0.3921)
= NORMSDIST (-0.39216)
⊘ This is a preview!⊘
Do you want full access?
Subscribe today to unlock all pages.

Trusted by 1+ million students worldwide

6PROJECT MANAGEMENT
= 34747
Thus, if the job can be done in 18 weeks, it will result a $100,000 bonus amount. In such
case the value of likelihood is 34%.
3B.5 Completion time that would be specified
If there is 97% chances for the occurrence, then number of days has to be calculated.
Let, number of days= X
Therefore, NORMSDIST (97%)
Or, NORMS (9.7) = 1.880794
Or, (X- Critical Path)/ total standard deviation= 1.880794
Or, (X-21)/ 7.65= 1.880794
Or, (X-21) = 1.880794 *7.65
Or, X-21= 14.388074
Or, X= 14.3880741+21
Or, X= 35.3880741
The completion time that would be specified is 35.39 days.
Paraphrase This Document
Need a fresh take? Get an instant paraphrase of this document with our AI Paraphraser

7PROJECT MANAGEMENT
3B.6 Network diagram for the project and Time scale Activity on Arrow (AOA)
Figure 6: Network diagram for the project
(Source: created by author)
The red path is the critical path for the project and value of the length is (10+7+4) =21.
Activity 3C
3C.1 Network diagram for the job
Activity Normal Crashed Float
Te Cost Tc Cost Crashed Cost (Rate/day)
1-2 6 12000 3 18000 2000 0
1-3 4 4000 3 8000 4000 0

8PROJECT MANAGEMENT
2-4 3 3000 3 N/A 3000 3
2-5 2 8000 2 N/A 8000 2
3-4 7 2000 4 5000 1000 0
4-7 3 3000 1 4500 750 0
4-8 5 6000 4 11000 5000 3
5-6 6 8000 3 14000 2000 2
6-9 5 4000 2 9000 1666.66 0
7-9 7 2000 5 4000 1000 NA
8-9 4 2000 3 4000 2000 NA
Total cost 54,000 77,500
3C. 2 Total cost for the work
Crashed cost rate/day = (Crashed cost- Normal cost)
Total cost for the normal work = $ 54,000
Total cost for the crashed cost = $77,500
⊘ This is a preview!⊘
Do you want full access?
Subscribe today to unlock all pages.

Trusted by 1+ million students worldwide

9PROJECT MANAGEMENT
Figure 7: Network diagram for the job activities
(Source: created by author)
The length of the critical path is (6+2+6+5) = 19.
Figure 7: Network diagram for the job activities
(Source: created by author)
The length of the critical path is (6+2+6+5) = 19.
Paraphrase This Document
Need a fresh take? Get an instant paraphrase of this document with our AI Paraphraser

10PROJECT MANAGEMENT
3C.3 Optimum duration for the activity
Figure 8: PERT CHART for the job activities
(Source: created by author)
Project
Duration
Obtained by
reducing
Additional
direct cost
Net direct
cost
Notes
19 days Normal duration 54,000 -
17 days Activity 6 by 2 days 2*750=1500 55500 Float of 6 is used to
provide another critical
path
16 days Activity 7 by 1 day 2*750=1500 570000 -
13 days Activity 9 by 3 days 3*1500=4500 61500 -
11 days Activity 7 by 2 days 2*750=1500 63000 -
10 days Crashed activity 7
by another 1 day
1*750=750 63750 Crashing activity for each
critical path

11PROJECT MANAGEMENT
Optimal project time = 10 days
Total cost = 54,000+ (10*1500) = $20400
After crashing,
Net cost become = 63750+ (10*1500) = $78750
Project
duration
Obtained by
reducing
Additional direct
cost ($)
Progressive
cost
Total direct
cost ($)
19 days Normal duration $54000
19 days 10 days 0 63750
Optimal project time = 10 days
Total cost = 54,000+ (10*1500) = $20400
After crashing,
Net cost become = 63750+ (10*1500) = $78750
Project
duration
Obtained by
reducing
Additional direct
cost ($)
Progressive
cost
Total direct
cost ($)
19 days Normal duration $54000
19 days 10 days 0 63750
⊘ This is a preview!⊘
Do you want full access?
Subscribe today to unlock all pages.

Trusted by 1+ million students worldwide
1 out of 14
Related Documents

Your All-in-One AI-Powered Toolkit for Academic Success.
 +13062052269
info@desklib.com
Available 24*7 on WhatsApp / Email
Unlock your academic potential
Copyright © 2020–2025 A2Z Services. All Rights Reserved. Developed and managed by ZUCOL.