Project Management Report: Iron Triangle, Risk, and Cost Analysis

Verified

Added on  2023/01/12

|18
|3586
|51
Report
AI Summary
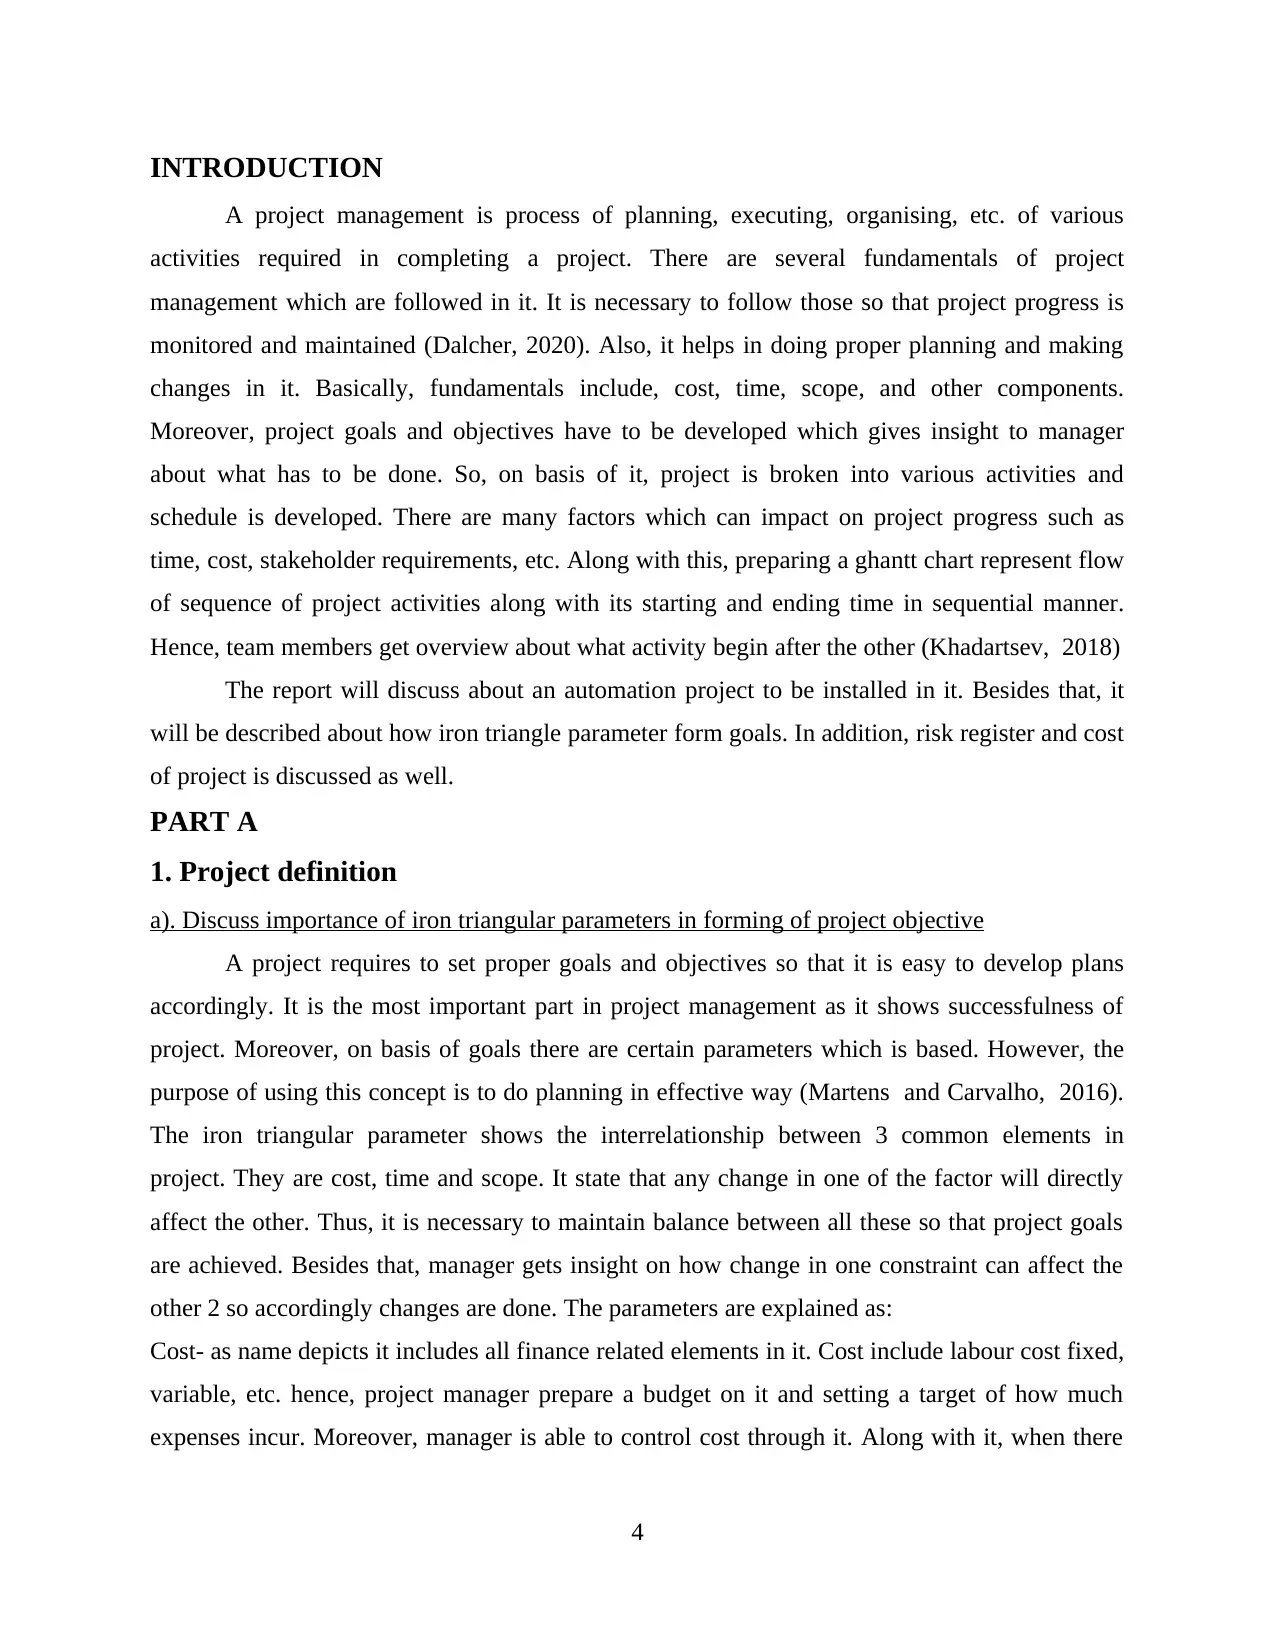
This report delves into the core principles of project management, examining the application of the iron triangle parameters (cost, time, and scope) in setting project goals and planning. It explores risk management within a PLC project context, utilizing a risk register to identify and mitigate potential issues. The report includes the development of a network diagram and Gantt chart for project scheduling, alongside an analysis of project costs and resources using earned value analysis. Furthermore, it offers suggestions for project managers, reflecting on the challenges encountered during the project and providing recommendations for improved project execution. The report provides a detailed analysis of the project's progress, budget, and earned value, offering a comprehensive overview of project management techniques.
Document Page
Foundation of project
management
1
tabler-icon-diamond-filled.svg

Paraphrase This Document

Need a fresh take? Get an instant paraphrase of this document with our AI Paraphraser
Document Page
ABSTRACT
In this report it is discussed about fundamentals of project management and how iron
triangular parameters is useful in setting of goals and planning. Besides, the various risk which
can occur in PLC project is been described with help of risk register. Also, network diagram is
developed along with ghantt chart. Furthermore, earned value analysis is been done to calculate
various types of cost and resources. Furthermore, it has been described about some suggestion
which can be taken into consideration by project manager. At last reflection is written on
challenges faced during project.
2
Document Page
3
Document Page
INTRODUCTION
A project management is process of planning, executing, organising, etc. of various
activities required in completing a project. There are several fundamentals of project
management which are followed in it. It is necessary to follow those so that project progress is
monitored and maintained (Dalcher, 2020). Also, it helps in doing proper planning and making
changes in it. Basically, fundamentals include, cost, time, scope, and other components.
Moreover, project goals and objectives have to be developed which gives insight to manager
about what has to be done. So, on basis of it, project is broken into various activities and
schedule is developed. There are many factors which can impact on project progress such as
time, cost, stakeholder requirements, etc. Along with this, preparing a ghantt chart represent flow
of sequence of project activities along with its starting and ending time in sequential manner.
Hence, team members get overview about what activity begin after the other (Khadartsev, 2018)
The report will discuss about an automation project to be installed in it. Besides that, it
will be described about how iron triangle parameter form goals. In addition, risk register and cost
of project is discussed as well.
PART A
1. Project definition
a). Discuss importance of iron triangular parameters in forming of project objective
A project requires to set proper goals and objectives so that it is easy to develop plans
accordingly. It is the most important part in project management as it shows successfulness of
project. Moreover, on basis of goals there are certain parameters which is based. However, the
purpose of using this concept is to do planning in effective way (Martens and Carvalho, 2016).
The iron triangular parameter shows the interrelationship between 3 common elements in
project. They are cost, time and scope. It state that any change in one of the factor will directly
affect the other. Thus, it is necessary to maintain balance between all these so that project goals
are achieved. Besides that, manager gets insight on how change in one constraint can affect the
other 2 so accordingly changes are done. The parameters are explained as:
Cost- as name depicts it includes all finance related elements in it. Cost include labour cost fixed,
variable, etc. hence, project manager prepare a budget on it and setting a target of how much
expenses incur. Moreover, manager is able to control cost through it. Along with it, when there
4
tabler-icon-diamond-filled.svg

Paraphrase This Document

Need a fresh take? Get an instant paraphrase of this document with our AI Paraphraser
Document Page
occurs any fluctuation in cost it impact on time and scope. This consumer more time and scope is
changed (Young, 2016).
Time – here, time of overall project completion is calculated. It shows that what things are to be
done at which date and time. It is represented by preparing a schedule where all project tasks are
written and for each one start and end date is mentioned. If there is any delay in completion of
particular tasks then it impact on cost and scope. So, project manager track progress of project
through it.
Scope – in this all activities are included in it of project. In this if activities are not completed on
time than it leads to rise in cost and delay of entire project. Besides, change in stakeholder
expectations also affect on scope of project. Therefore, project manager prioritize activities on
basis of goal and objectives.
These three components are highly useful in defining the project direction and its
successful completion. It can be explained with help of example like if there is change in rise in
budget due to lack of resources then it will impact on delay in project task, then similarly, it will
also affect on further tasks as well. This will automatically lead to delay in activities and
changing the overall scope of project. Likewise, if there is delay in task completion then it will
led to rise in cost and change in scope of project. Hence, this iron triangular parameters are
useful in evaluating impact of these three components which are interlinked together to make
things easy. With that it becomes easy to make changes in them according to impact identified.
b) Risk register
There are many risk which can occur in project. This entirely impact on overall project in
negative way. So, risk register helps in finding out risk in it. The register shows risk level,
strategy, etc. for it. Hence, risk impact can be easily reduced from it (Zheng, Le and Li, 2016).
Moreover, mitigation measures are taken in order to minimize its impact so that project can be
completed within time. Besides, it gives insight on how things are to be changed and how project
will be proceeded. Similarly, as PLC project is complex and large it also required to be conduct
risk analysis. It will be useful in giving insight about types of risk, its likelihood, impact, etc.
Risk Likelihood Impact Mitigation
measures
Risk factor
1= low
5 = high
5
Document Page
Rise in cost 3 4 Here, it a back up
or additional cost
will be estimated.
Insufficient
resources
3 4 The allocation of
resources will be
done through
budget and
monitoring of
utilization of
resources will be
done.
Delay in project
completion
4 5 A schedule will
be prepared and
prioritize
activities will be
mentioned .
Technical error 3 4 There will be
proper testing
done in it
Damage of
equipment
3 4 The equipment
will be kept safe
along with all
security measures
ensured and
taken.
Failure of
software
4 5 The software will
be checked and
tested properly.
Fault in product 3 4 Software will be
6
Document Page
line used to monitor
product line and
its proper
monitoring will
be done.
Insufficient HR 3 4 Outside labor will
be hired.
Lack of tool to
train TTF staff
3 4 A training
assessment will
be done to find
out requirements.
Failure of
production of
product
2 3 High and advance
software will be
used.
2. Planning and cost
This is an important stage project management as in here overall planning of project is
done and along with it cost is allocated. The planning has to be done properly so that project is
completed on time. Other than this, on basis of planning, cost is estimated and budget is
prepared. In addition, this gives overview about that on which tasks how much cost is required.
a) Network diagram
A network diagram represents connection and relationship between project tasks and
activities that how they are connected with other. The tasks are described in boxes and it also
shows flow of activities with one another. Project duration will be 96 weeks.
7
tabler-icon-diamond-filled.svg

Paraphrase This Document

Need a fresh take? Get an instant paraphrase of this document with our AI Paraphraser
Document Page
Network diagram
Ghantt chart
A ghannt chart is a graphical representation of activity to be carried out in project. In this
it describe project date and time. Also, duration of task is mentioned in it by which it becomes
easy to evaluate how much time task will need to be completed. There are some predecessors as
well to find out how activity is dependent on another one.
8
Document Page
testing of product line 6 wks Mon 5/25/20 Fri 7/3/20 14,15
Train TTF engineer 6 wks Mon 7/6/20 Fri 8/14/20 16
Completion of project 0 wks Mon 8/17/20 Mon 8/17/20 17
9
Document Page
10
tabler-icon-diamond-filled.svg

Paraphrase This Document

Need a fresh take? Get an instant paraphrase of this document with our AI Paraphraser
Document Page
c) Budget of project
A budget is an estimate values of income and expenses that are incurred during project
for a particular period of time. It is necessary for project manager to prepare a budget so that it
helps in allocating of resources. However, there are various components in it such as fixed cost,
variable, labor, materials, etc. thus, there is a great impact on these components on project as any
change in it affect entire budget. It is because it increases cost of budget and many things are
assumed in it.
Expenses
Per
hour
Electrician 69 1656000
Technician 39 936000
2 Assistant
Project
Manager
and 2
Project
Planner 5500 5500
2
Commercial
Manager 2750*2 5000
Total 2602500
From the above budget it is interpreted that estimated budget is 2602500. In that all cost
and expenses are included such as salary of engineers, technician, electrician, etc. with help of
that, it will be easy for project manager to allocate resources for each task. So, it shows profit
and bonus as well.
3. Managing progress and spending
It is a stage there project progress is managed to find out whether it is moving in right
direction or not. So, it gives insight on how much is been spend and whether tasks are completed
within deadline or not. Through that, it enables project manager to make changes in plan and
analyze things easily.
11
Document Page
a) Determine the planned progress after 17 weeks
Task Planned Actual
PI 1 1
A 3 3
B 2 2
C 1 1
D 8 6
E 8 8
F 10 3
G 10 4
H 9 4
From above table it is evaluated that at initial stage progress of project is good but after
coming to F, G and H activity the progress is very low and behind. It has highly impacted on
further progress of project. Along with it, there is decline in 50% progress of project.
b) Actual progress values of project from revised table
Here, a comparison is made by creating a table that what actual progress value and
planned progress. By this it is easy for manager to find out how much more time is required for
its completion and what are the tasks which is lacking behind. Then, accordingly on basis of it
planning can be done and prioritize activities are completed first.
12
chevron_up_icon
1 out of 18
circle_padding
hide_on_mobile
zoom_out_icon
[object Object]