Project Management Planning Report: New International Airport Project
VerifiedAdded on 2022/09/17
|11
|2384
|22
Report
AI Summary
This report provides a comprehensive analysis of project management planning, focusing on the construction of a new international airport. The report begins by identifying key stakeholders, classifying them based on internal/external status and power-interest levels, and then develops a quality management plan, outlining quality metrics and tools like flowcharts, check sheets, and control charts. It also addresses procurement management, recommending contract types and delivery systems for various project aspects. Furthermore, the report identifies potential risks in a youth rugby project and proposes appropriate risk responses. Finally, it selects the best model for a venture using an Expected Monetary Value (EMV) analysis. The report provides valuable insights into project planning, stakeholder management, risk mitigation, and financial decision-making, making it a useful resource for students and professionals alike.

Running head: PROJECT MANAGEMENT PLANNING
Project Management Planning
Name of the Student
Name of the University
Author note
Project Management Planning
Name of the Student
Name of the University
Author note
Paraphrase This Document
Need a fresh take? Get an instant paraphrase of this document with our AI Paraphraser
1PROJECT MANAGEMENT PLANNING
Table of Contents
1. Project Management for New International Airport at Western Sydney....................................2
2. Identified Risks and their risk response in The Youth Rugby project team................................6
3. Selection of the best model for the venture.................................................................................8
References........................................................................................................................................9
2PROJECT MANAGEMENT PLANNING
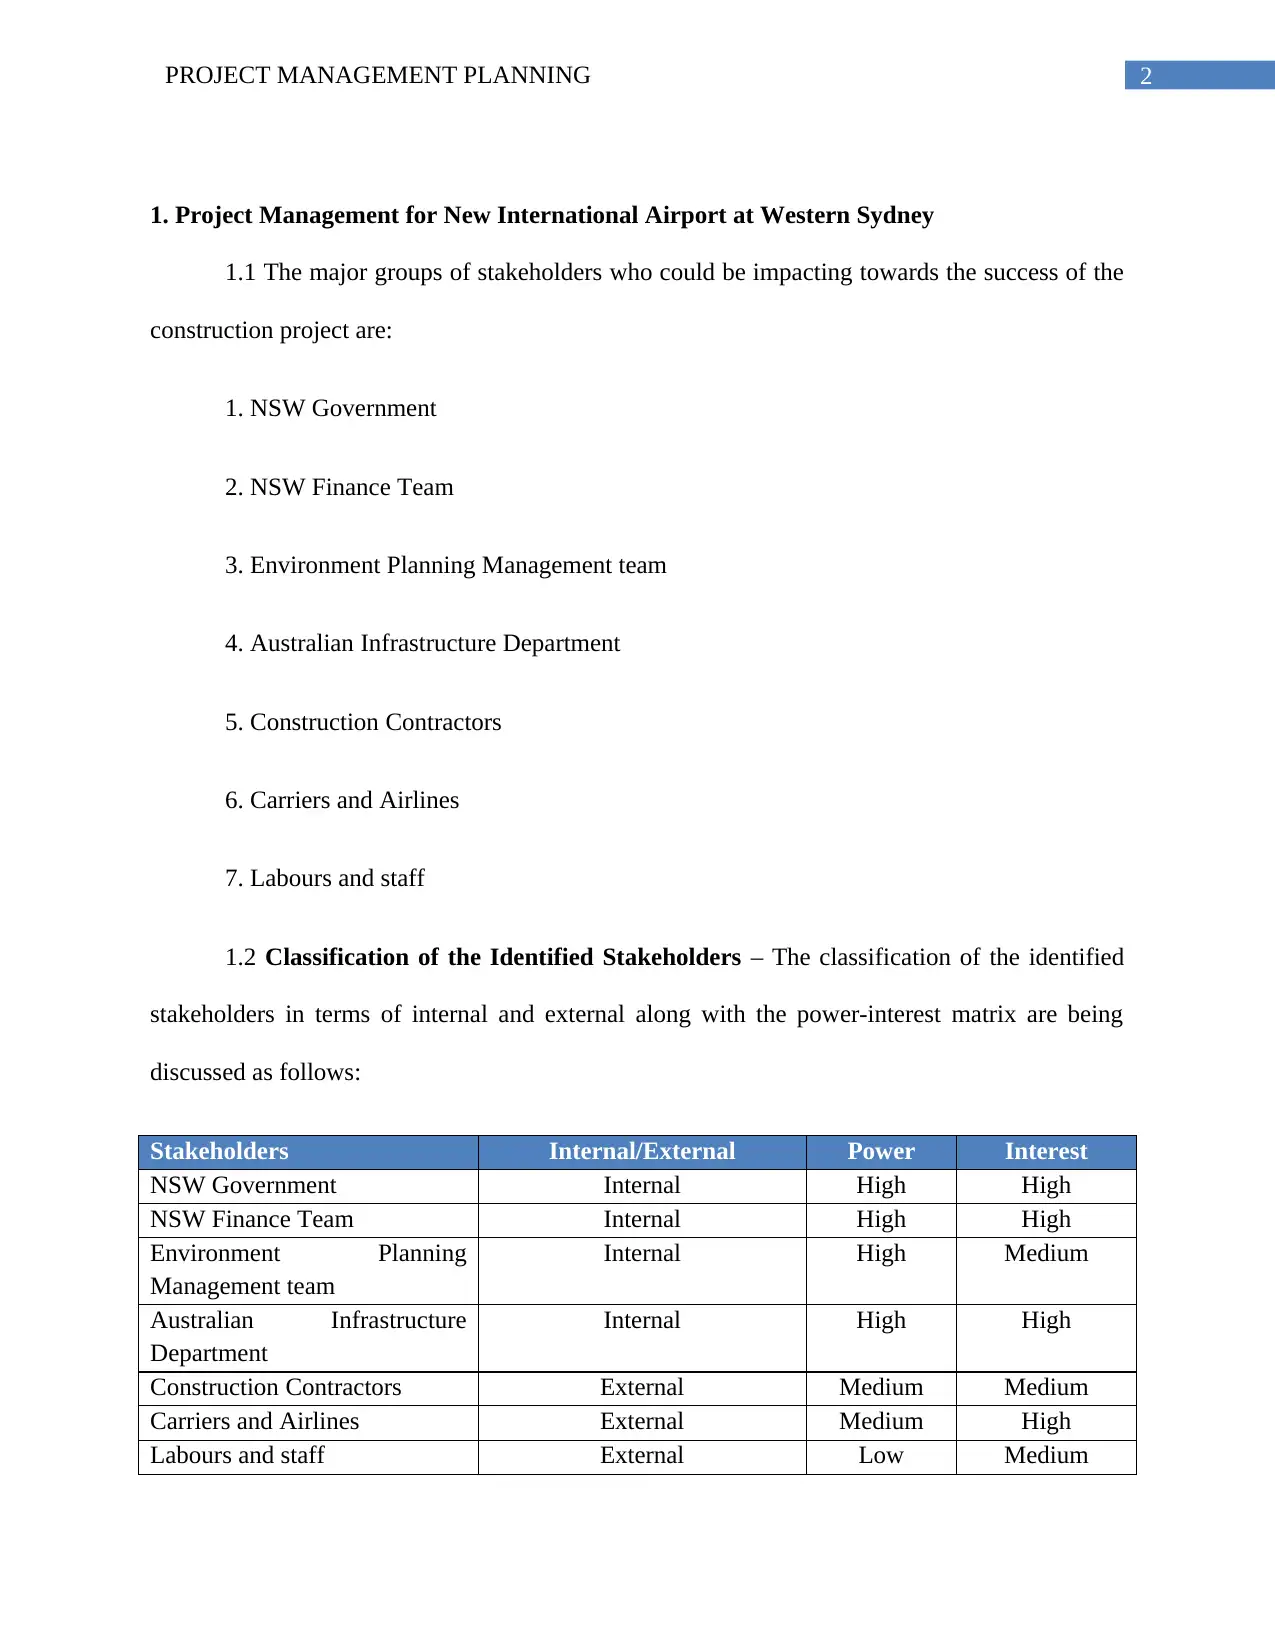
1. Project Management for New International Airport at Western Sydney
1.1 The major groups of stakeholders who could be impacting towards the success of the
construction project are:
1. NSW Government
2. NSW Finance Team
3. Environment Planning Management team
4. Australian Infrastructure Department
5. Construction Contractors
6. Carriers and Airlines
7. Labours and staff
1.2 Classification of the Identified Stakeholders – The classification of the identified
stakeholders in terms of internal and external along with the power-interest matrix are being
discussed as follows:
Stakeholders Internal/External Power Interest
NSW Government Internal High High
NSW Finance Team Internal High High
Environment Planning
Management team
Internal High Medium
Australian Infrastructure
Department
Internal High High
Construction Contractors External Medium Medium
Carriers and Airlines External Medium High
Labours and staff External Low Medium
⊘ This is a preview!⊘
Do you want full access?
Subscribe today to unlock all pages.
Trusted by 1+ million students worldwide
3PROJECT MANAGEMENT PLANNING
1.3 A Quality management plan that would depict the impact of quality management
tools for use within the construction project are being discussed as follows:
Aspects of Quality Quality Metric Quality Management tool Responsible person
Determining the schedule
of the project as per
project deliverables and
outcomes expected
Accordance to
project plan
Flowchart Project manager
Defining the cost
management in
accordance with the
planned activities
Cost
management
plan
Check sheets Project manager, NSW
Finance Team
Understanding the
activities are being
performed accordingly
and stability is
maintained across all
departments and
performed processes
Project
productivity,
stakeholder
satisfaction
Control charts Project manager,
Environment Planning
Management team,
Australian Infrastructure
Department and
Construction Contractors
The above discussion focuses over the different type of quality management tools, which
are required and applied to the construction project for the new airport at Western Sydney. The
justification for the application and use of the quality management tool are considered as
follows:
1. Flowchart – The use of flowchart would help in identifying the different aspects that
would be performed in an order within the project (Chi, Wang and Jiao 2015). The flowchart
diagram that would be designed for the project would comprise of a workflow process, which
would be defined in a step by step manner and would be connected by arrows directing to the
next process in the project.
Paraphrase This Document
Need a fresh take? Get an instant paraphrase of this document with our AI Paraphraser
4PROJECT MANAGEMENT PLANNING
The flowchart would also help in the identification of the different flow of events that
would be performed in relevance to the system. Based on determining the flowchart process the
determining of the exact form of quality issue would need be detected in a particular process
(Kim et al. 2015). Hence, after the detection of the particular issue in quality, the particular
activity would be rectified by the stakeholder assigned over that particular aspect.
2. Check sheets – Each of the defined activities within the project would have a certain
cost included within them. The responsible perform managing the entire project should thus be
able to determine that each of the processes or activities are being done as per the costs allocated
to them (Hamzeh, Zankoul and Rouhana 2015). Any additional cost that might incur at any
particular stage should be approved by the NSW Finance team who would look into the
appropriateness of data collected after which an approval could be given.
The use of check sheet could be used for the identification of problems if detected at any
stage. These sheets are further been used during the process of review over the documents that
have been used during the project (Lu et al. 2015). It should also be ensured that each pre-
requisite activity would be completed according to proper costs, schedule and allocated
resources.
3. Control charts – These charts are defined as statistical process control, which are used
for determining that the business processes are being performed in a certain state of control. The
control chart is depicted in a form of graph, which helps in showing the changes in certain
processes that are made over a certain period of time (Hazır 2015). The use of control in the
aspect of the construction project could be helpful towards indicating that the processes are being
performed in a stable manner and there would be less form of variation or alterations within the
5PROJECT MANAGEMENT PLANNING
project. Changes should be properly sought in accordance with the project norms and standards
as approved during the initial stages.
In case if certain aspects of the project under discussion are found to be non-compliant
with the standards, corrective actions could be sought immediately. These would be further be
helpful for determining that the project is progressing as per requirements and detailed mentions
by the project manager and the higher officials proposing the project. Variation detected in the
control chart could be sometimes larger than the expected variation and thus could be noticeable
immediately (Abd El-Karim et al. 2017). However, in other cases, the variation might not be
noticeable. Based on the understanding of the control chart and the plotted points, the involved
team would be able to identify the variation in processes and trends to be sought for controlling
the project alterations.
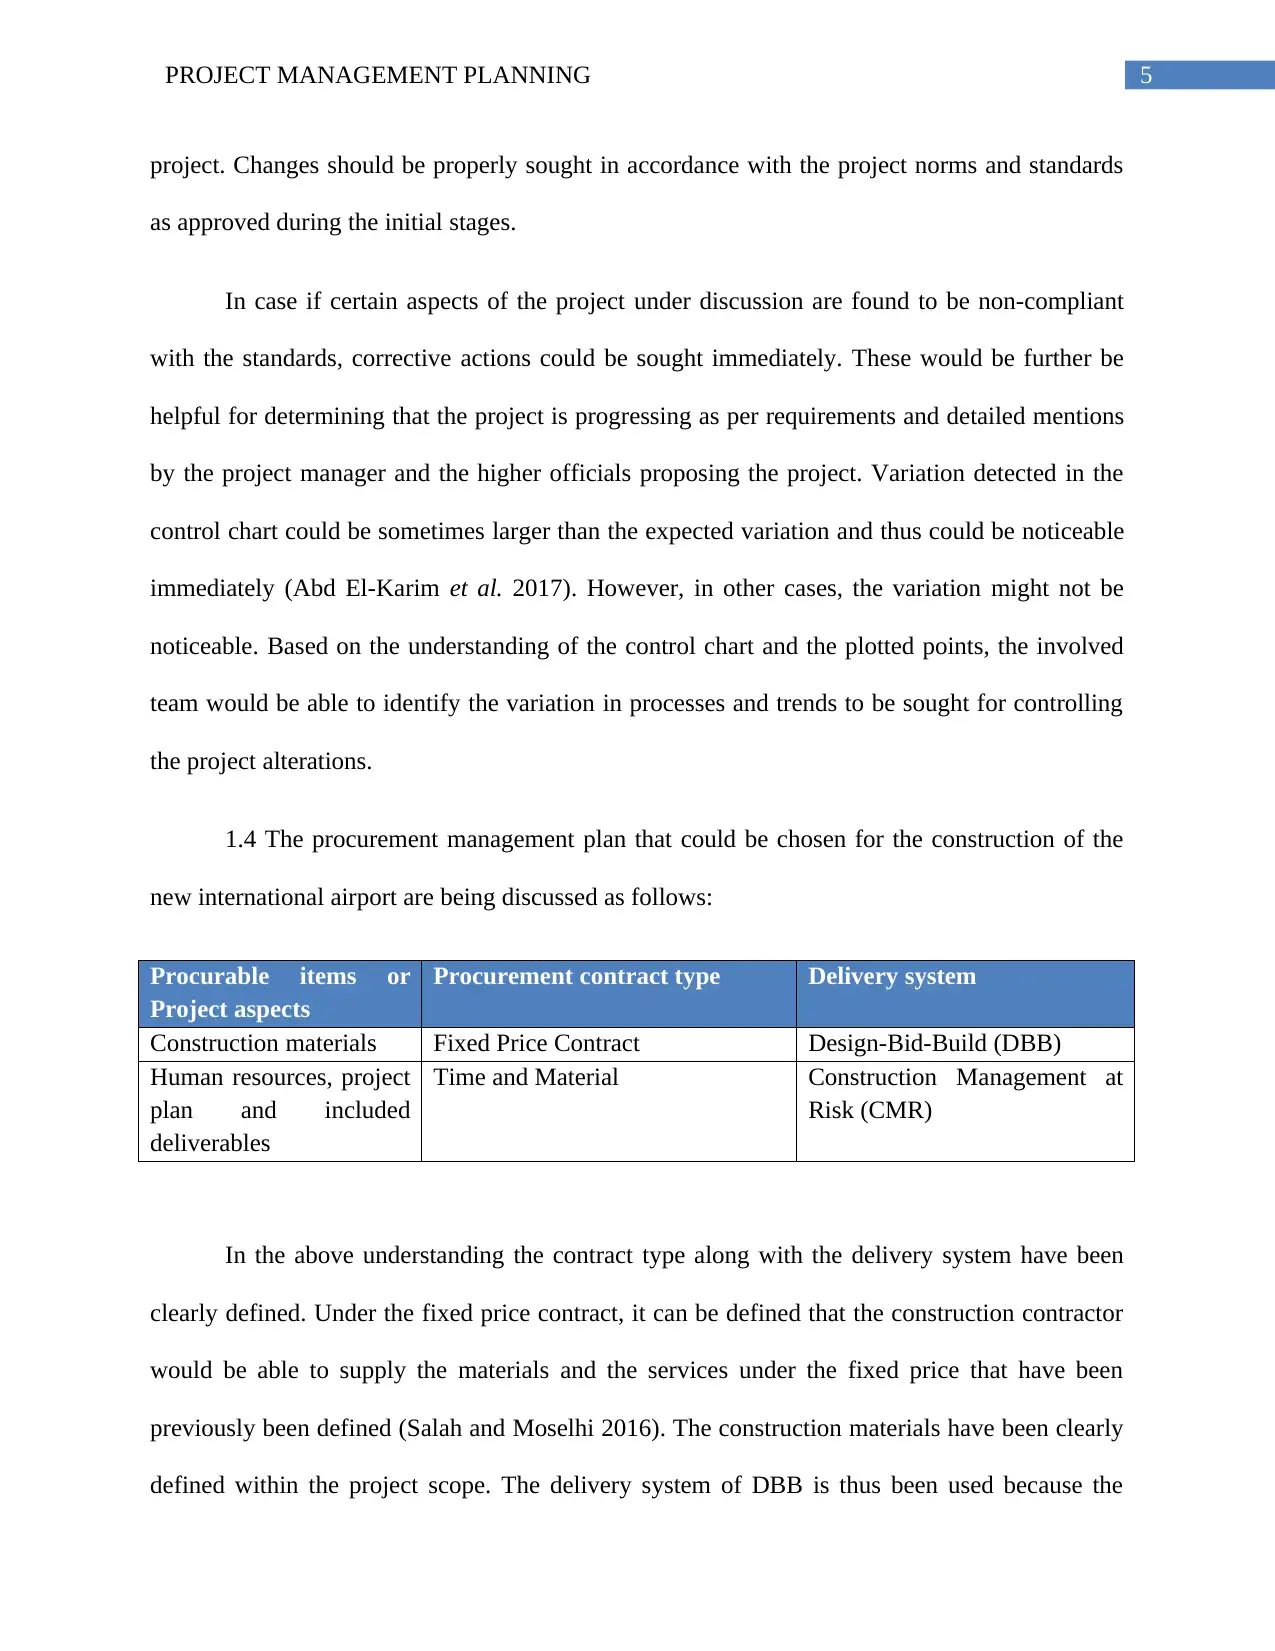
1.4 The procurement management plan that could be chosen for the construction of the
new international airport are being discussed as follows:
Procurable items or
Project aspects
Procurement contract type Delivery system
Construction materials Fixed Price Contract Design-Bid-Build (DBB)
Human resources, project
plan and included
deliverables
Time and Material Construction Management at
Risk (CMR)
In the above understanding the contract type along with the delivery system have been
clearly defined. Under the fixed price contract, it can be defined that the construction contractor
would be able to supply the materials and the services under the fixed price that have been
previously been defined (Salah and Moselhi 2016). The construction materials have been clearly
defined within the project scope. The delivery system of DBB is thus been used because the
project. Changes should be properly sought in accordance with the project norms and standards
as approved during the initial stages.
In case if certain aspects of the project under discussion are found to be non-compliant
with the standards, corrective actions could be sought immediately. These would be further be
helpful for determining that the project is progressing as per requirements and detailed mentions
by the project manager and the higher officials proposing the project. Variation detected in the
control chart could be sometimes larger than the expected variation and thus could be noticeable
immediately (Abd El-Karim et al. 2017). However, in other cases, the variation might not be
noticeable. Based on the understanding of the control chart and the plotted points, the involved
team would be able to identify the variation in processes and trends to be sought for controlling
the project alterations.
1.4 The procurement management plan that could be chosen for the construction of the
new international airport are being discussed as follows:
Procurable items or
Project aspects
Procurement contract type Delivery system
Construction materials Fixed Price Contract Design-Bid-Build (DBB)
Human resources, project
plan and included
deliverables
Time and Material Construction Management at
Risk (CMR)
In the above understanding the contract type along with the delivery system have been
clearly defined. Under the fixed price contract, it can be defined that the construction contractor
would be able to supply the materials and the services under the fixed price that have been
previously been defined (Salah and Moselhi 2016). The construction materials have been clearly
defined within the project scope. The delivery system of DBB is thus been used because the
⊘ This is a preview!⊘
Do you want full access?
Subscribe today to unlock all pages.
Trusted by 1+ million students worldwide
6PROJECT MANAGEMENT PLANNING
project would be selected by a particular contractor of the project (Park and Kwak 2017). Hence,
the entire construction would need to be performed within a fixed-price contract method and
delivery system.
On the other hand, for the human resources and included deliverables, the contract type
chosen is Time and Material. This has been mainly been chosen because the amount of effort
that would be put within the project would be considered as uncertain within the construction
project (Dziadosz and Rejment 2015). The contract could also be titled as contract price. The
purchaser of the different resources pays the stakeholders on a per hour basis or per item basis.
Hence, the hourly rate or the unit price could be defined as fixed for the project. Hence, the level
of effort or the total time taken for the contract would be considered as unknown. The project
delivery method that has been chosen at this step is discussed as CMR. Under this project
delivery method, it could be discussed that the delivery method would be put under a certain
form of commitment. Based on the performance of the construction. The performance sought for
the construction would be performed within a defined price and schedule (De Marco, Rafele and
Thaheem 2016). The CMR would be helpful for providing a construction input towards the
owner during the phases of project design and thus the general contractor would be awarded with
the position during the phase of construction.
2. Identified Risks and their risk response in The Youth Rugby project team
1. Referees failing to show up at designated games – The risk response to be applicable
is: Transfer. The referees who would not be able to show up to the designated games should be
replaced with another referee who would be eligible for the game event.
Paraphrase This Document
Need a fresh take? Get an instant paraphrase of this document with our AI Paraphraser
7PROJECT MANAGEMENT PLANNING
2. Fighting between teams – Risk response applicable is Avoid. The issue arising
between teams should be carefully be listened and then the issue should be resolved accordingly
by proper discussion.
3. Pivotal error committed by a referee that determines the outcome of a game – The
risk response applied is mitigate. The risk arising within the team could be mitigated based on
determining the error that has happened (Quarrie et al. 2017). The risk mitigation action should
be taken in order to avoid such kind of errors.
4. Abusive behaviour along the sidelines by parents – Risk response to be chosen is
share. The risk that has been made should be shared with the volunteers appointed during the
tournament. They should ensure that parents should maintain a proper behaviour during the
entire tournament.
5. Inadequate parking – Risk response is mitigate. Actions should thus be taken for the
reduction of the risk. The project officials should ensure that proper parking facility should be
provided for all stakeholders invited during the event.
6. Not enough teams sign up for different age brackets – Risk response should be
avoid. A proper strategy should be planned for inspiring each team to participate during the
tournament. Having enough times to sign up would help in ensuring a successful atmosphere
during the tournament.
7. Serious injury – Risk response is mitigate. The risk that has might approach the
project (Sjödin and Fahlström 2018). Hence, the medical team should approach each team
member who might face injury during the sport event.
8PROJECT MANAGEMENT PLANNING
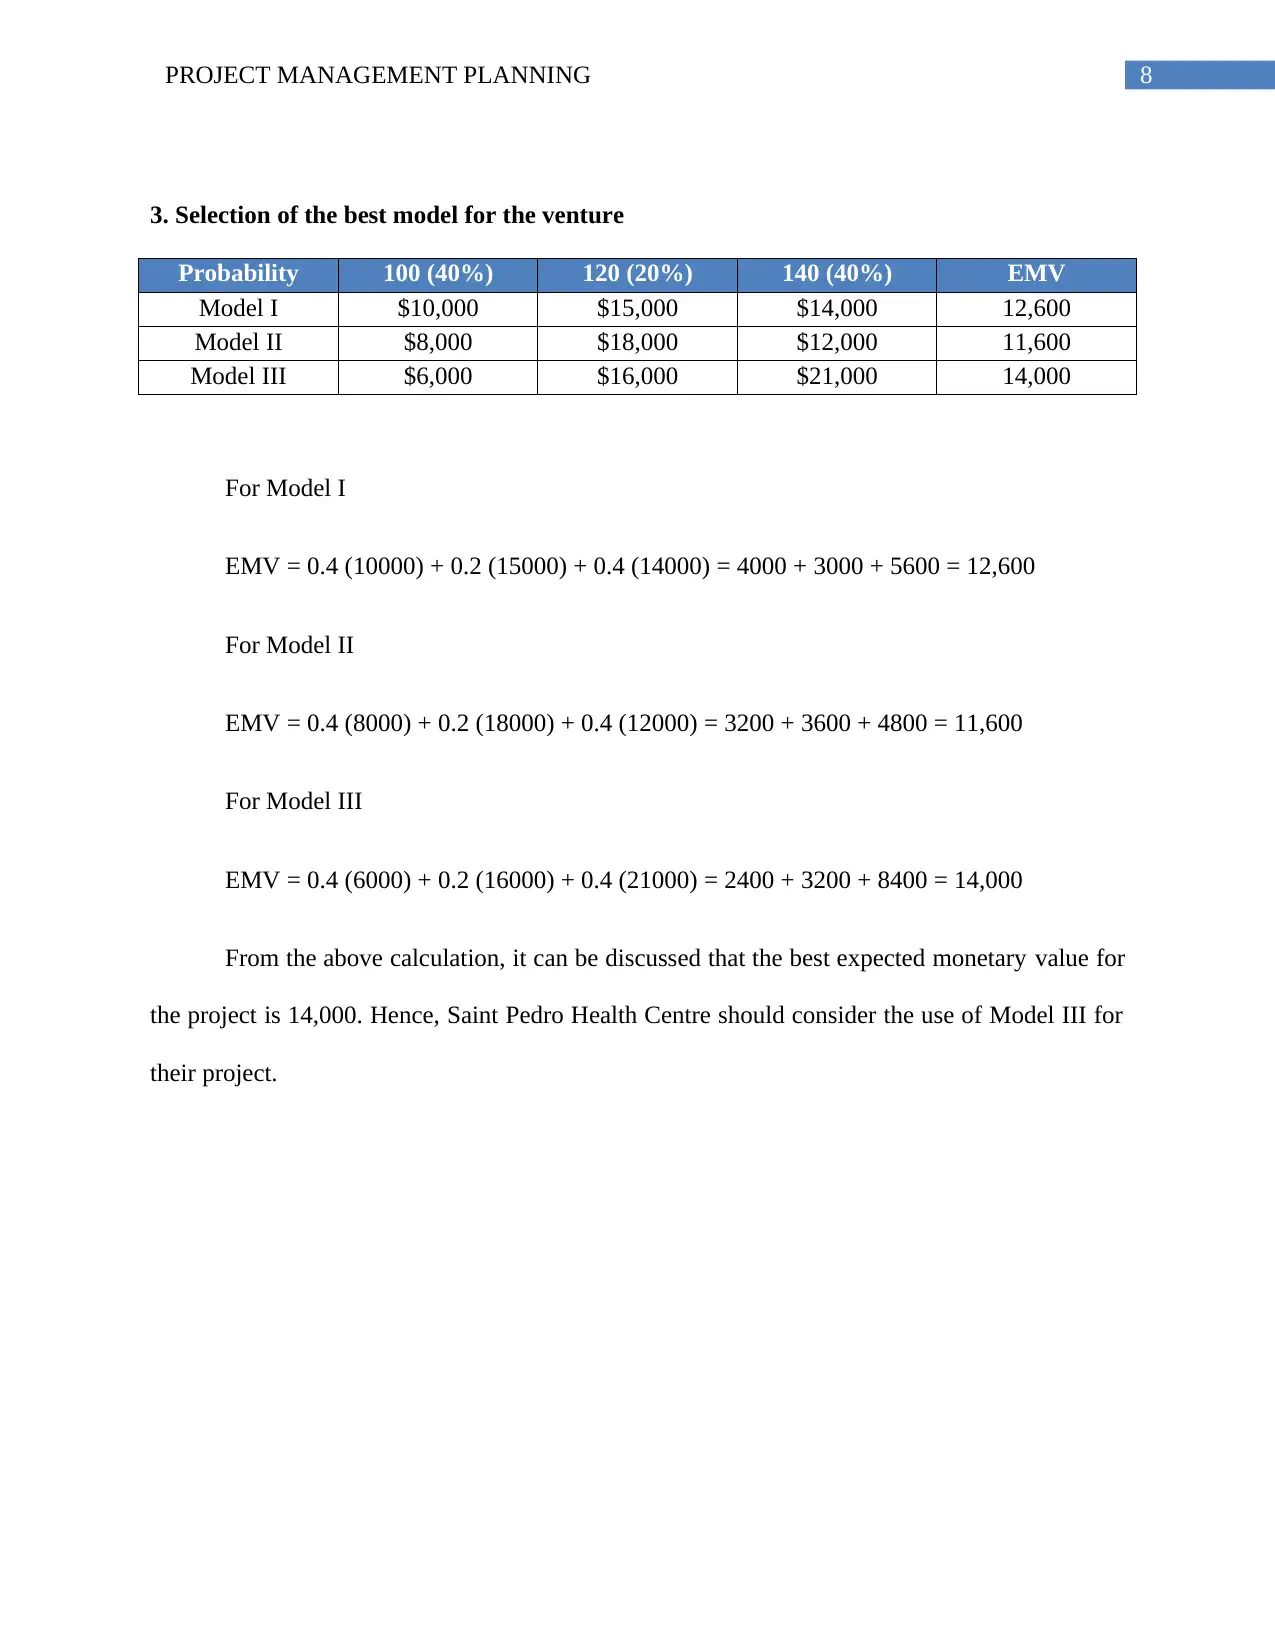
3. Selection of the best model for the venture
Probability 100 (40%) 120 (20%) 140 (40%) EMV
Model I $10,000 $15,000 $14,000 12,600
Model II $8,000 $18,000 $12,000 11,600
Model III $6,000 $16,000 $21,000 14,000
For Model I
EMV = 0.4 (10000) + 0.2 (15000) + 0.4 (14000) = 4000 + 3000 + 5600 = 12,600
For Model II
EMV = 0.4 (8000) + 0.2 (18000) + 0.4 (12000) = 3200 + 3600 + 4800 = 11,600
For Model III
EMV = 0.4 (6000) + 0.2 (16000) + 0.4 (21000) = 2400 + 3200 + 8400 = 14,000
From the above calculation, it can be discussed that the best expected monetary value for
the project is 14,000. Hence, Saint Pedro Health Centre should consider the use of Model III for
their project.
⊘ This is a preview!⊘
Do you want full access?
Subscribe today to unlock all pages.
Trusted by 1+ million students worldwide
9PROJECT MANAGEMENT PLANNING
References
Abd El-Karim, M.S.B.A., Mosa El Nawawy, O.A. and Abdel-Alim, A.M., 2017. Identification
and assessment of risk factors affecting construction projects. HBRC journal, 13(2), pp.202-216.
Chi, H.L., Wang, X. and Jiao, Y., 2015. BIM-enabled structural design: impacts and future
developments in structural modelling, analysis and optimisation processes. Archives of
computational methods in engineering, 22(1), pp.135-151.
De Marco, A., Rafele, C. and Thaheem, M.J., 2016. Dynamic management of risk contingency in
complex design-build projects. Journal of Construction Engineering and Management, 142(2),
p.04015080.
Dziadosz, A. and Rejment, M., 2015. Risk analysis in construction project-chosen
methods. Procedia Engineering, 122, pp.258-265.
Hamzeh, F.R., Zankoul, E. and Rouhana, C., 2015. How can ‘tasks made ready’during
lookahead planning impact reliable workflow and project duration?. Construction management
and economics, 33(4), pp.243-258.
Hazır, Ö., 2015. A review of analytical models, approaches and decision support tools in project
monitoring and control. International Journal of Project Management, 33(4), pp.808-815.
Kim, S.C., Kim, Y.W., Park, K.S. and Yoo, C.Y., 2015. Impact of measuring operational-level
planning reliability on management-level project performance. Journal of Management in
Engineering, 31(5), p.05014021.
Paraphrase This Document
Need a fresh take? Get an instant paraphrase of this document with our AI Paraphraser
10PROJECT MANAGEMENT PLANNING
Lu, W., Fung, A., Peng, Y., Liang, C. and Rowlinson, S., 2015. Demystifying construction
project time–effort distribution curves: BIM and non-BIM comparison. Journal of management
in engineering, 31(6), p.04015010.
Park, J. and Kwak, Y.H., 2017. Design-bid-build (DBB) vs. design-build (DB) in the US public
transportation projects: The choice and consequences. International Journal of Project
Management, 35(3), pp.280-295.
Quarrie, K.L., Brooks, J.H., Burger, N., Hume, P.A. and Jackson, S., 2017. Facts and values: on
the acceptability of risks in children’s sport using the example of rugby—a narrative review. Br J
Sports Med, 51(15), pp.1134-1139.
Salah, A. and Moselhi, O., 2016. Risk identification and assessment for engineering procurement
construction management projects using fuzzy set theory. Canadian Journal of Civil
Engineering, 43(5), pp.429-442.
Sjödin, F. and Fahlström, M., 2018. Noise Exposure and Hearing Related Risks for Technical
Officials during a Major Badminton Tournament. Jacobs Journal of Physical Rehabilitation
Medicine, 4(1), pp.1-11.
1 out of 11
Related Documents


Your All-in-One AI-Powered Toolkit for Academic Success.
+13062052269
info@desklib.com
Available 24*7 on WhatsApp / Email
![[object Object]](/_next/static/media/star-bottom.7253800d.svg)
Unlock your academic potential
Copyright © 2020–2026 A2Z Services. All Rights Reserved. Developed and managed by ZUCOL.