Project Management: B&W Systems Case Study Solution

Verified

Added on  2023/04/11

|6
|625
|145
Project
AI Summary
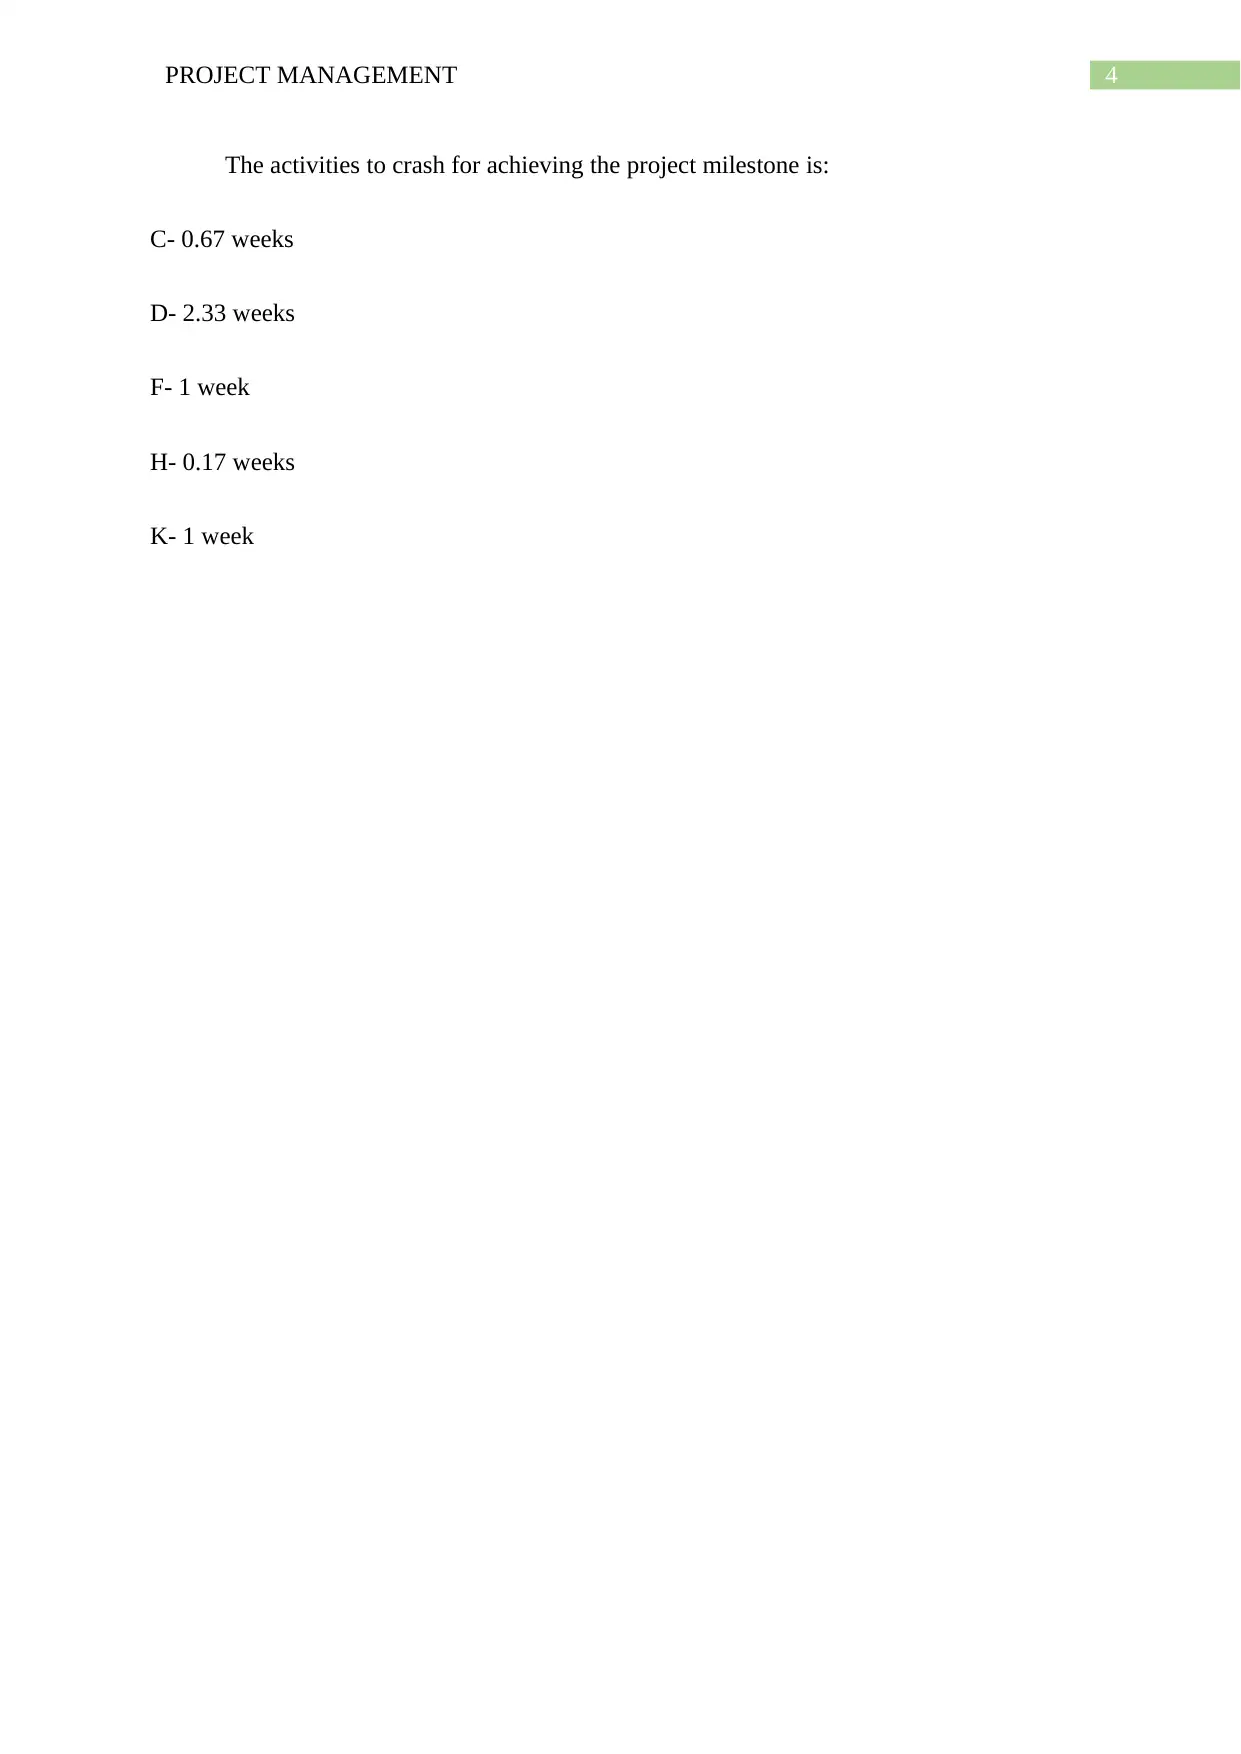
This document presents a project management solution for a case study involving B&W Systems and the development of an internet-based forecasting system. The solution addresses key project management aspects, including scheduling, cost analysis, and project crashing. The assignment begins with calculating the expected time for each task using PERT, followed by the development of an activity graph to determine the critical path. The solution then calculates the additional cost required to reduce the project timeline to 35 weeks, identifying specific tasks recommended for crashing based on their cost per week. The analysis includes detailed tables outlining task dependencies, expected times, crash times, and associated costs. Finally, the document provides a bibliography of relevant project management resources.
Document Page
Running head: PROJECT MANAGEMENT
Project Management
Name of the Student:
Name of the University:
tabler-icon-diamond-filled.svg

Secure Best Marks with AI Grader

Need help grading? Try our AI Grader for instant feedback on your assignments.
Document Page
1PROJECT MANAGEMENT
Question 3
a) Additional cost for reducing the project time to required 35 weeks
The expected time required for each task is calculated as:
Expected time = (Most optimistic time+4*most likely time + most pessimistic time) /6
Task
Most
optimistic
time
Most likely
time
Most
pessimistic time
Expecte
d time
A 2 3 4 3.00
B 4 7 10 7.00
C 5 6 9 6.33
D 6 7 16 8.33
E 7 9 10 8.83
F 4 5 6 5.00
G 3 6 10 6.17
H 2 4 7 4.17
I 2 2 2 2.00
J 3 4 14 5.50
K 2 3 4 3.00
Document Page
2PROJECT MANAGEMENT
Activity graph
Task
Expecte
d time
Earliest
start
time
Earliset
finish
time
Latest
start
time
Latest
finish
time Slack
A 3.00 0.00 3.00 0.00 3.00 0.00
B 7.00 3.00 10.00 19.50 26.50 16.50
C 6.33 3.00 9.33 3.00 9.33 0.00
D 8.33 9.33 17.67 9.33 17.67 0.00
E 8.83 17.67 26.50 17.67 26.50 0.00
F 5.00 26.50 31.50 26.50 31.50 0.00
G 6.17 17.67 23.83 25.33 31.50 7.67
H 4.17 26.50 30.67 27.33 31.50 0.83
I 2.00 10.00 12.00 29.50 31.50 19.50
J 5.50 31.50 37.00 31.50 37.00 0.00
K 3.00 37.00 40.00 37.00 40.00 0.00
Figure 1: Activity graph
(Source: Created by author)
Additional cost for reducing the project time to required 35 weeks is shown in following
table as:
Document Page
3PROJECT MANAGEMENT
Task
Expecte
d time
Crash
time
(weeks)
Max
numbe
r of
crashes
Normal
cost ($)
Crash
cost ($)
Crash
increas
e
Crash
cost per
week ($)
Numbe
r of
week
cashed
Crashing
cost ($)
A 3.00 3 0 10,000 10,000 0 0 0 0
B 7.00 6 1.00 20,000 25,000 5,000 5000 0 0
C 6.33 5 1.33 15,000 30,000 15,000 11278.2 0.67 7,500
D 8.33 6 2.33 45,000 65,000 20,000 8583.691 2.33 20000
E 8.83 8 0.83 10,000 20,000 10,000 12048.19 0 0
F 5.00 4 1.00 15,000 18,000 3,000 3000 1 3000
G 6.17 4 2.17 20,000 30,000 10,000 4608.295 0 0
H 4.17 3 1.17 10,000 15,000 5,000 4273.504 0.17 714.285
I 2.00 2 0.00 5,000 5,000 0 0 0 0
J 5.50 5 0.50 40,000 50,000 10,000 20000 0 0
K 3.00 2 1.00 15,000 25,000 10,000 10000 1 10000
5.17 41214.285
The additional cost is: $41,214.85.
b) Specific tasks recommend crashing in order to achieve the milestone
Task
Expecte
d time
Crash
time
(weeks)
Max
numbe
r of
crashes
Normal
cost ($)
Crash
cost ($)
Crash
increas
e
Crash
cost per
week ($)
Numbe
r of
week
cashed
A 3.00 3 0 10,000 10,000 0 0 0
B 7.00 6 1.00 20,000 25,000 5,000 5000 0
C 6.33 5 1.33 15,000 30,000 15,000 11278.2 0.67
D 8.33 6 2.33 45,000 65,000 20,000 8583.691 2.33
E 8.83 8 0.83 10,000 20,000 10,000 12048.19 0
F 5.00 4 1.00 15,000 18,000 3,000 3000 1
G 6.17 4 2.17 20,000 30,000 10,000 4608.295 0
H 4.17 3 1.17 10,000 15,000 5,000 4273.504 0.17
I 2.00 2 0.00 5,000 5,000 0 0 0
J 5.50 5 0.50 40,000 50,000 10,000 20000 0
K 3.00 2 1.00 15,000 25,000 10,000 10000 1
5.17
tabler-icon-diamond-filled.svg

Secure Best Marks with AI Grader

Need help grading? Try our AI Grader for instant feedback on your assignments.
Document Page
4PROJECT MANAGEMENT
The activities to crash for achieving the project milestone is:
C- 0.67 weeks
D- 2.33 weeks
F- 1 week
H- 0.17 weeks
K- 1 week
Document Page
5PROJECT MANAGEMENT
Bibliography
Fleming, Q.W. and Koppelman, J.M., 2016, December. Earned value project management.
Project Management Institute.
Heagney, J., 2016. Fundamentals of project management. Amacom.
Kerzner, H. and Kerzner, H.R., 2017. Project management: a systems approach to planning,
scheduling, and controlling. John Wiley & Sons.
Schwalbe, K., 2015. Information technology project management. Cengage Learning.
chevron_up_icon
1 out of 6
circle_padding
hide_on_mobile
zoom_out_icon
logo.png

Your All-in-One AI-Powered Toolkit for Academic Success.

Available 24*7 on WhatsApp / Email

[object Object]