Project Network Analysis - Production & Operations Management, AAU

Verified

Added on  2023/06/12

|6
|820
|407
Homework Assignment
AI Summary
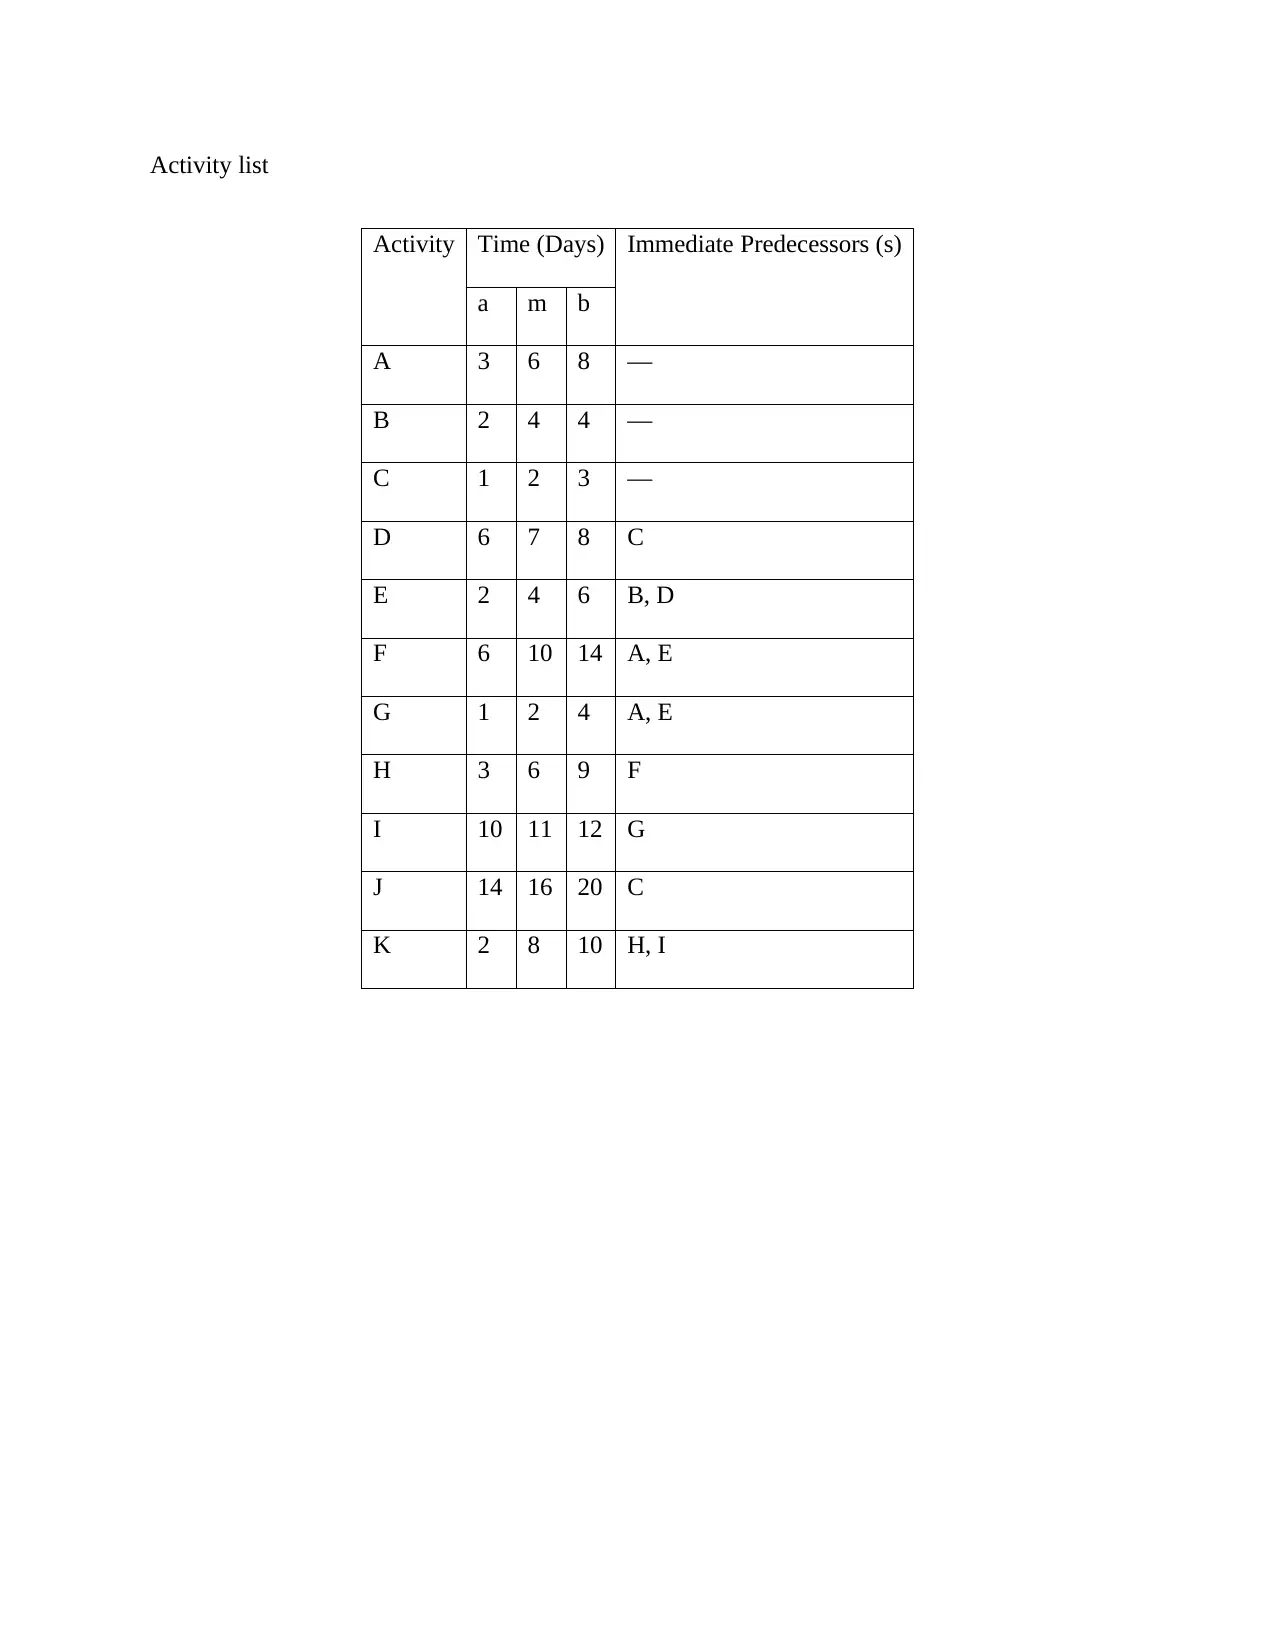
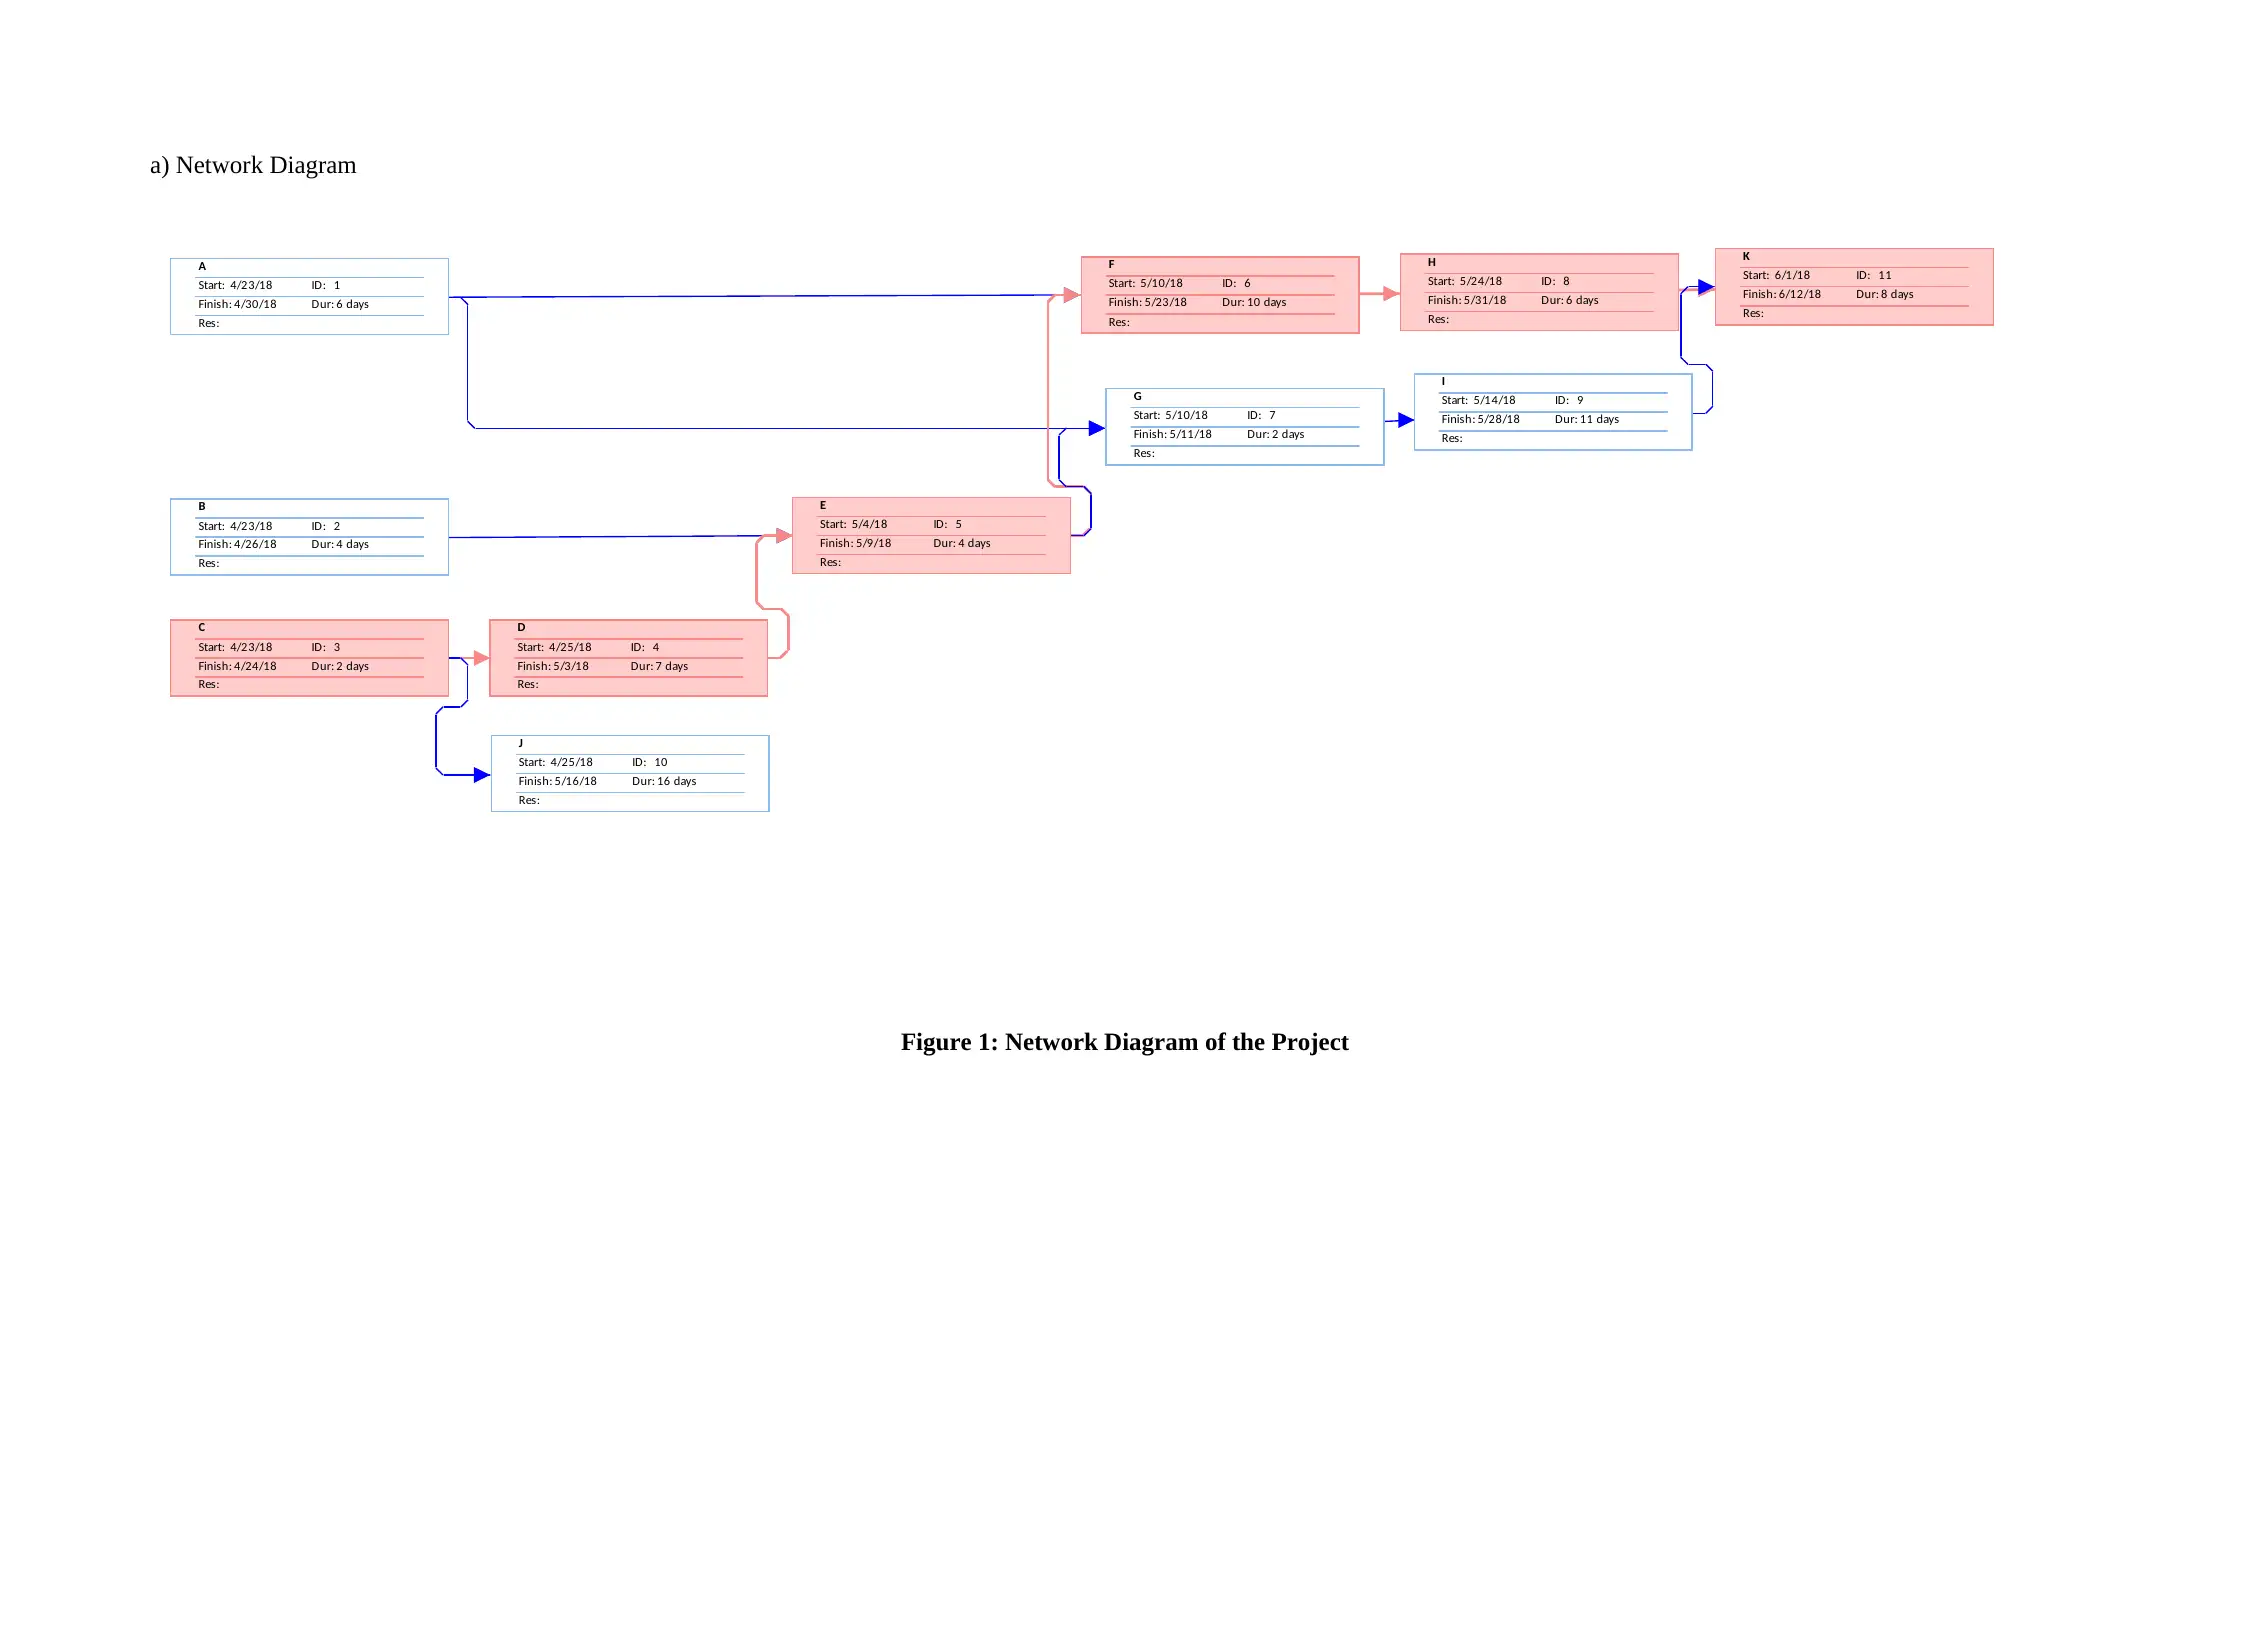
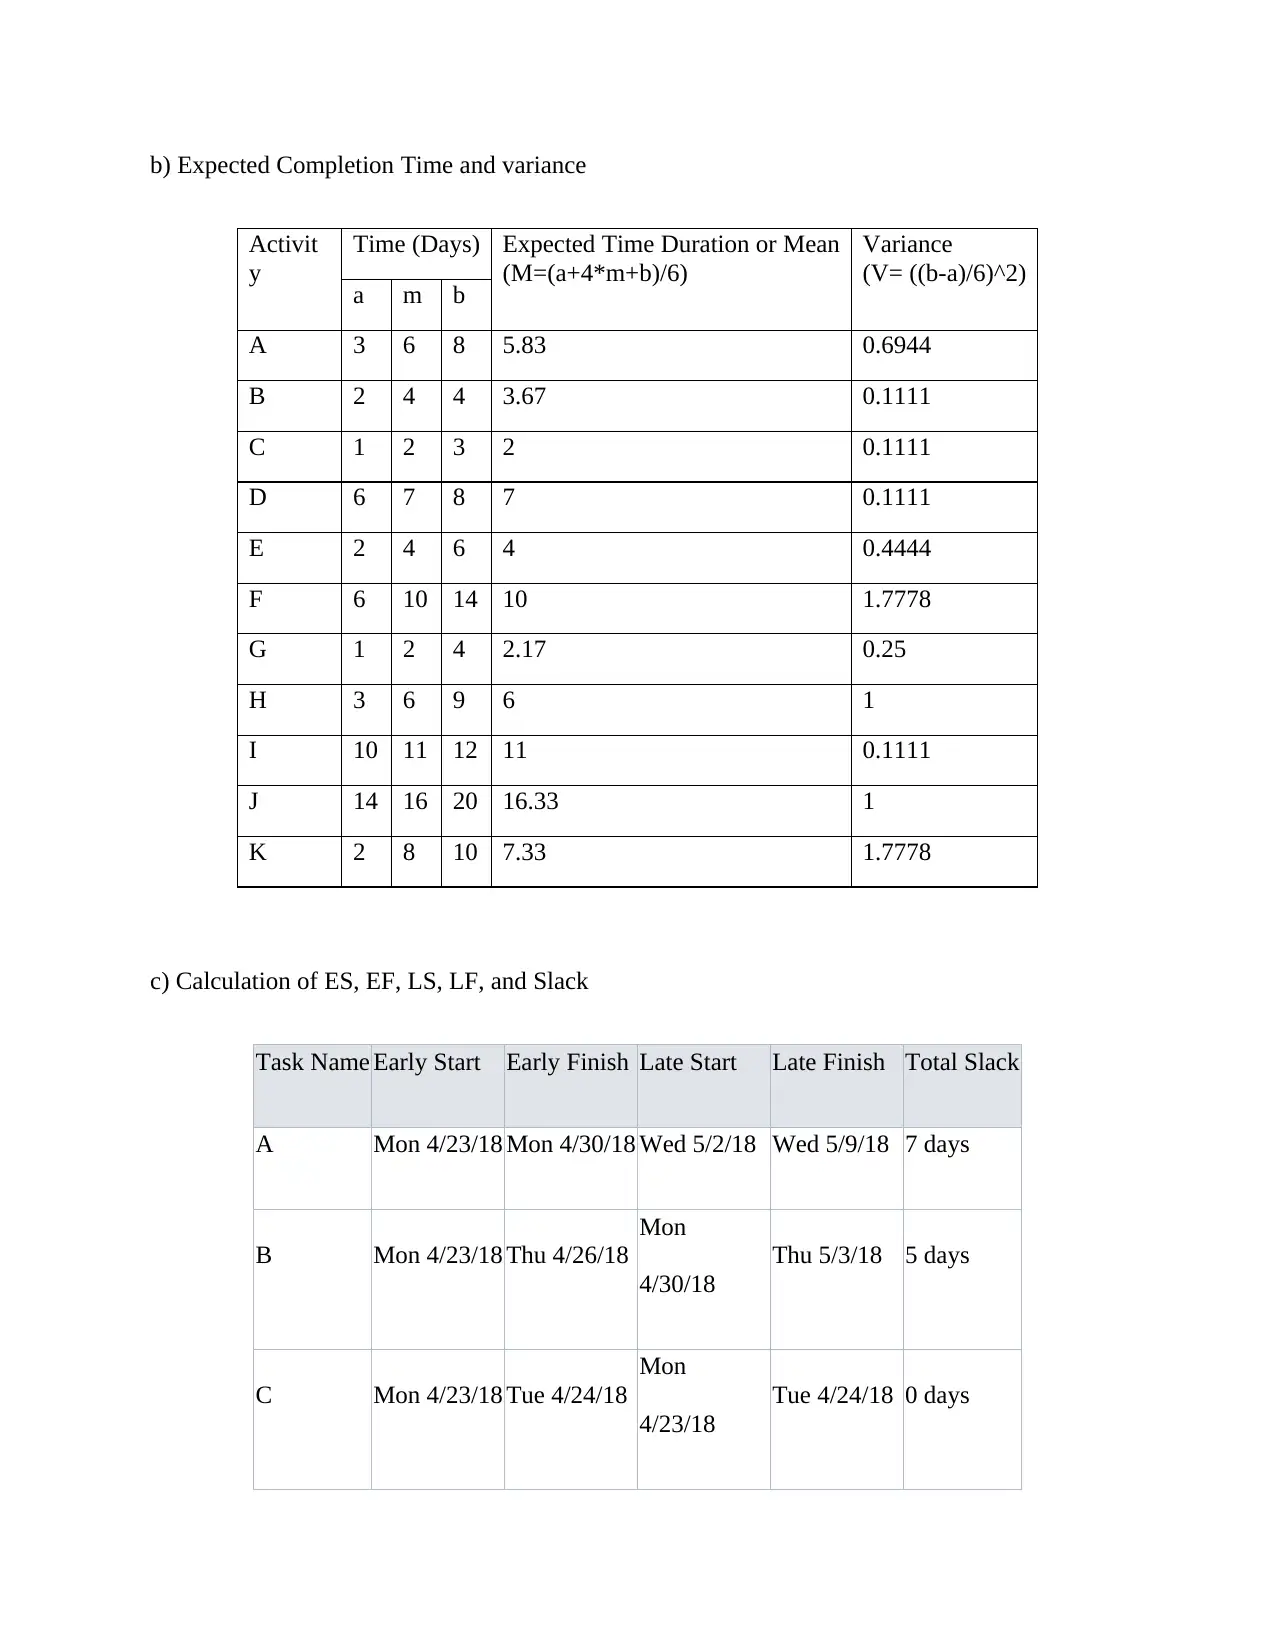
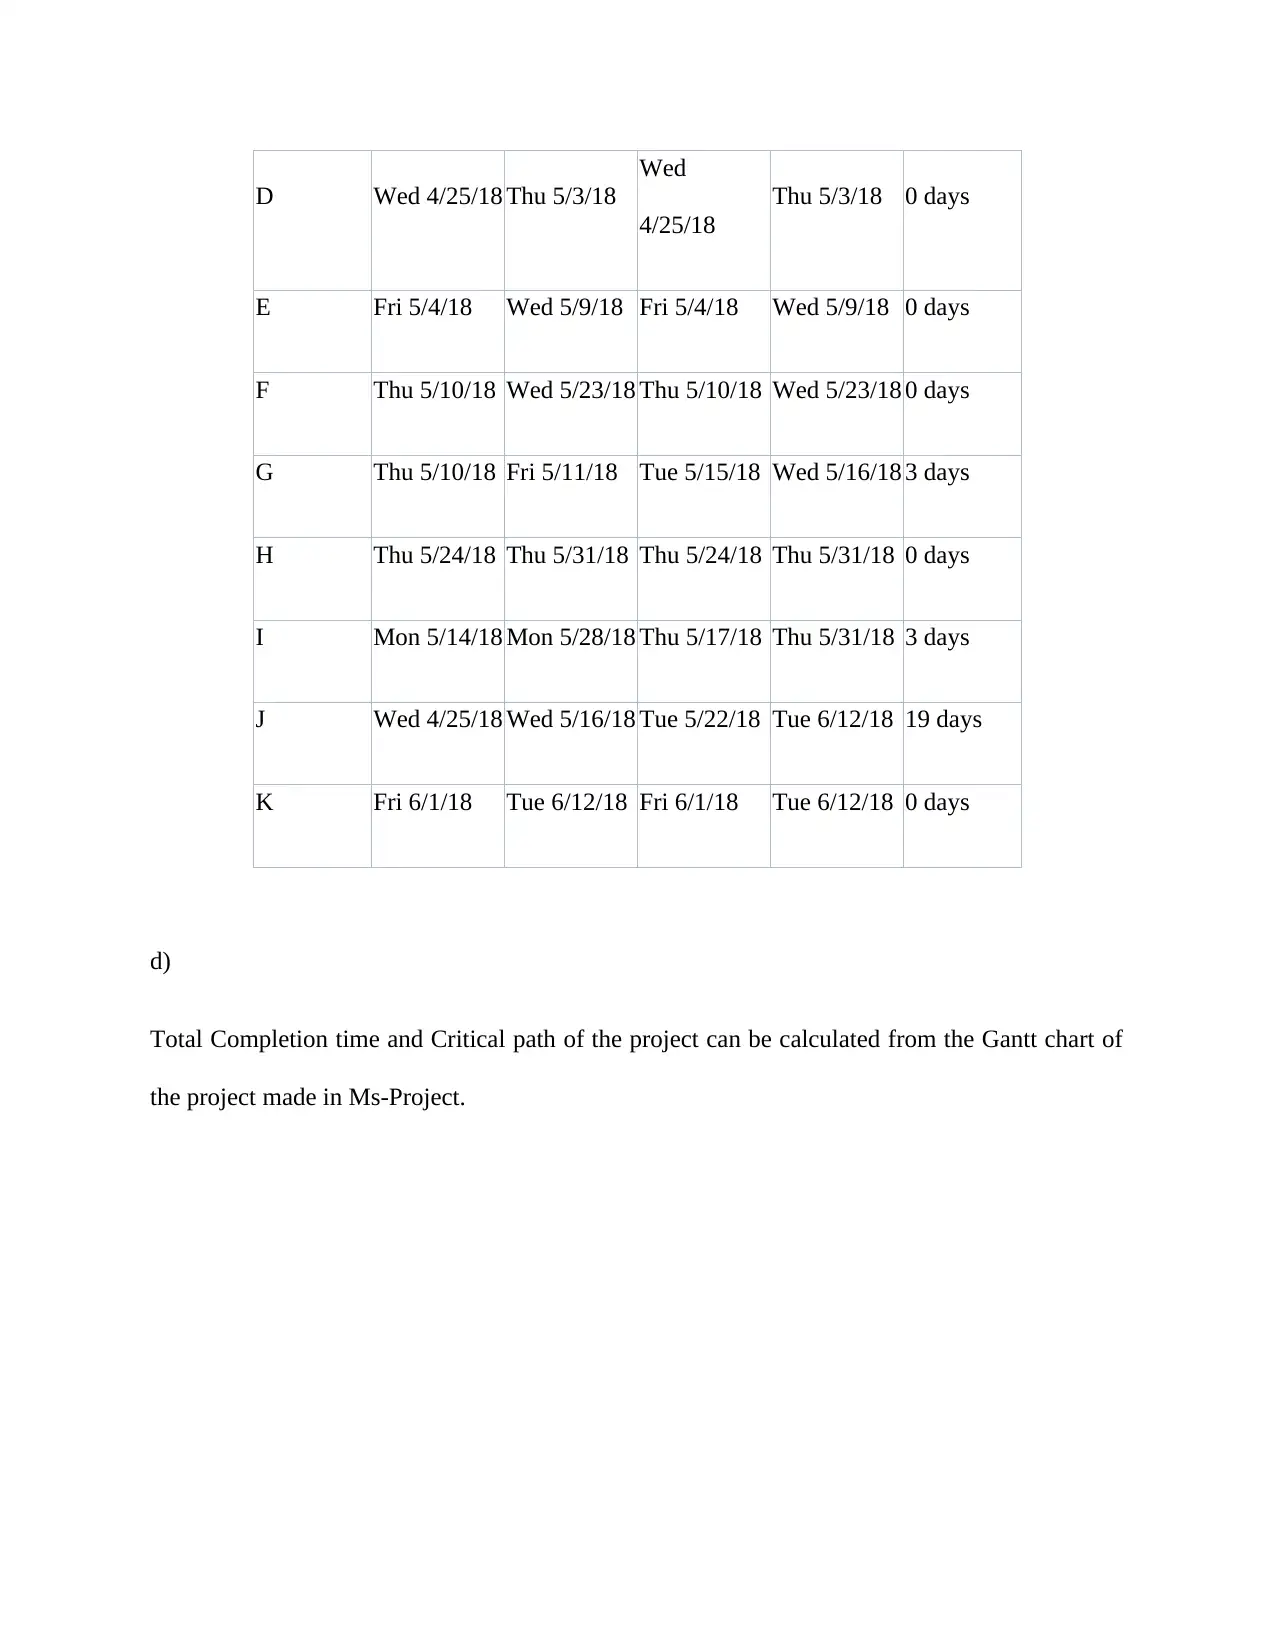
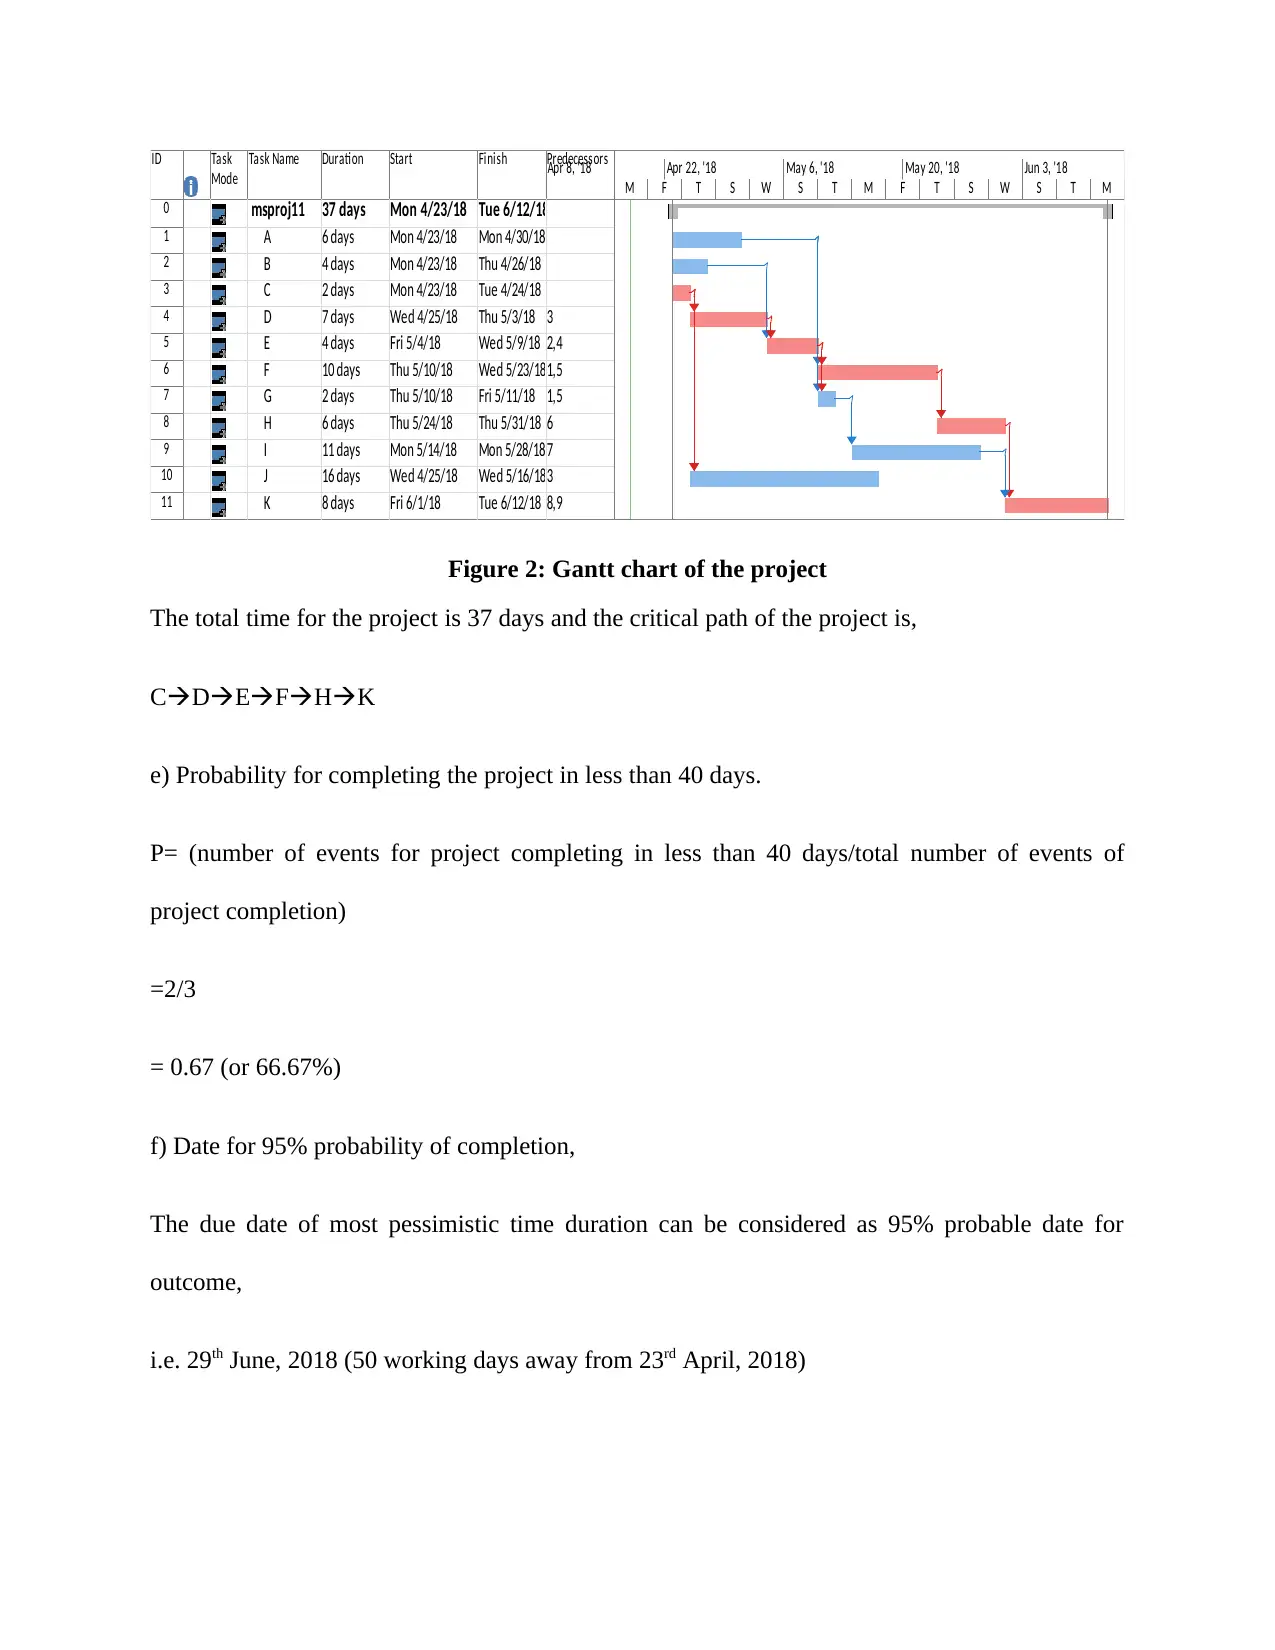
This document presents a solved assignment on project network analysis, focusing on Kelle Carpet and Trim's installation projects. It includes a network diagram illustrating project activities and their dependencies, calculations for expected completion time and variance for each activity, and the determination of Early Start (ES), Early Finish (EF), Late Start (LS), Late Finish (LF), and Slack times. A Gantt chart is provided to visualize the project schedule, identify the critical path (CDEFHK), and estimate the total project completion time (37 days). Furthermore, the solution calculates the probability of completing the project within 40 days (66.67%) and estimates the date for a 95% probability of completion (June 29th, 2018). This solved assignment is available on Desklib, a platform offering study tools and resources for students.
Document Page
Project Network Analysis
Name of the Student:
Student ID:
Name of the University:
tabler-icon-diamond-filled.svg

Paraphrase This Document

Need a fresh take? Get an instant paraphrase of this document with our AI Paraphraser
Document Page
Activity list
Activity Time (Days) Immediate Predecessors (s)
a m b
A 3 6 8
B 2 4 4
C 1 2 3
D 6 7 8 C
E 2 4 6 B, D
F 6 10 14 A, E
G 1 2 4 A, E
H 3 6 9 F
I 10 11 12 G
J 14 16 20 C
K 2 8 10 H, I
Document Page
a) Network Diagram
B
Start: 4/23/18 ID: 2
Finish: 4/26/18 Dur: 4 days
Res:
C
Start: 4/23/18 ID: 3
Finish: 4/24/18 Dur: 2 days
Res:
D
Start: 4/25/18 ID: 4
Finish: 5/3/18 Dur: 7 days
Res:
J
Start: 4/25/18 ID: 10
Finish: 5/16/18 Dur: 16 days
Res:
E
Start: 5/4/18 ID: 5
Finish: 5/9/18 Dur: 4 days
Res:
I
Start: 5/14/18 ID: 9
Finish: 5/28/18 Dur: 11 days
Res:
G
Start: 5/10/18 ID: 7
Finish: 5/11/18 Dur: 2 days
Res:
H
Start: 5/24/18 ID: 8
Finish: 5/31/18 Dur: 6 days
Res:
F
Start: 5/10/18 ID: 6
Finish: 5/23/18 Dur: 10 days
Res:
K
Start: 6/1/18 ID: 11
Finish: 6/12/18 Dur: 8 days
Res:
A
Start: 4/23/18 ID: 1
Finish: 4/30/18 Dur: 6 days
Res:
Figure 1: Network Diagram of the Project
Document Page
b) Expected Completion Time and variance
Activit
y
Time (Days) Expected Time Duration or Mean
(M=(a+4*m+b)/6)
Variance
(V= ((b-a)/6)^2)
a m b
A 3 6 8 5.83 0.6944
B 2 4 4 3.67 0.1111
C 1 2 3 2 0.1111
D 6 7 8 7 0.1111
E 2 4 6 4 0.4444
F 6 10 14 10 1.7778
G 1 2 4 2.17 0.25
H 3 6 9 6 1
I 10 11 12 11 0.1111
J 14 16 20 16.33 1
K 2 8 10 7.33 1.7778
c) Calculation of ES, EF, LS, LF, and Slack
Task Name Early Start Early Finish Late Start Late Finish Total Slack
A Mon 4/23/18 Mon 4/30/18 Wed 5/2/18 Wed 5/9/18 7 days
B Mon 4/23/18 Thu 4/26/18
Mon
4/30/18
Thu 5/3/18 5 days
C Mon 4/23/18 Tue 4/24/18
Mon
4/23/18
Tue 4/24/18 0 days
tabler-icon-diamond-filled.svg

Paraphrase This Document

Need a fresh take? Get an instant paraphrase of this document with our AI Paraphraser
Document Page
D Wed 4/25/18 Thu 5/3/18
Wed
4/25/18
Thu 5/3/18 0 days
E Fri 5/4/18 Wed 5/9/18 Fri 5/4/18 Wed 5/9/18 0 days
F Thu 5/10/18 Wed 5/23/18 Thu 5/10/18 Wed 5/23/18 0 days
G Thu 5/10/18 Fri 5/11/18 Tue 5/15/18 Wed 5/16/18 3 days
H Thu 5/24/18 Thu 5/31/18 Thu 5/24/18 Thu 5/31/18 0 days
I Mon 5/14/18 Mon 5/28/18 Thu 5/17/18 Thu 5/31/18 3 days
J Wed 4/25/18 Wed 5/16/18 Tue 5/22/18 Tue 6/12/18 19 days
K Fri 6/1/18 Tue 6/12/18 Fri 6/1/18 Tue 6/12/18 0 days
d)
Total Completion time and Critical path of the project can be calculated from the Gantt chart of
the project made in Ms-Project.
Document Page
ID Task
Mode
Task Name Duration Start Finish Predecessors
0 msproj11 37 days Mon 4/23/18 Tue 6/12/18
1 A 6 days Mon 4/23/18 Mon 4/30/18
2 B 4 days Mon 4/23/18 Thu 4/26/18
3 C 2 days Mon 4/23/18 Tue 4/24/18
4 D 7 days Wed 4/25/18 Thu 5/3/18 3
5 E 4 days Fri 5/4/18 Wed 5/9/18 2,4
6 F 10 days Thu 5/10/18 Wed 5/23/181,5
7 G 2 days Thu 5/10/18 Fri 5/11/18 1,5
8 H 6 days Thu 5/24/18 Thu 5/31/18 6
9 I 11 days Mon 5/14/18 Mon 5/28/18 7
10 J 16 days Wed 4/25/18 Wed 5/16/183
11 K 8 days Fri 6/1/18 Tue 6/12/18 8,9
M F T S W S T M F T S W S T M
Apr 8, '18 Apr 22, '18 May 6, '18 May 20, '18 Jun 3, '18
Figure 2: Gantt chart of the project
The total time for the project is 37 days and the critical path of the project is,
CDEFHK
e) Probability for completing the project in less than 40 days.
P= (number of events for project completing in less than 40 days/total number of events of
project completion)
=2/3
= 0.67 (or 66.67%)
f) Date for 95% probability of completion,
The due date of most pessimistic time duration can be considered as 95% probable date for
outcome,
i.e. 29th June, 2018 (50 working days away from 23rd April, 2018)
chevron_up_icon
1 out of 6
circle_padding
hide_on_mobile
zoom_out_icon
[object Object]