Project Networks, Scheduling, and Analysis Report with Crashing
VerifiedAdded on 2020/06/05
|14
|1684
|39
Report
AI Summary
This report presents a comprehensive analysis of a small maintenance project and a plant improvement project. It begins with an introduction to project planning, emphasizing resource allocation and project constraints. The report then details the use of network diagrams to visualize project activities and determine critical paths. It includes calculations for estimated project time, standard deviation, and various probabilities related to project completion. The report also explores the impact of crashing techniques to minimize project duration, considering both direct and indirect costs. The findings highlight optimal labor allocation decisions, estimated project timelines, and the cost implications of accelerating project completion. The report concludes with a summary of the key findings and provides references to relevant literature.

Networks , Scheduling &
Analysis
Analysis
Paraphrase This Document
Need a fresh take? Get an instant paraphrase of this document with our AI Paraphraser
Table of Contents
INTRODUCTION...........................................................................................................................1
ACTIVITY 3A.................................................................................................................................1
3A.1 Network diagram with the help of table and distance between the critical path...........1
3.A.2 Showing the bar graph to allocate labor.......................................................................2
3.A.3. Revised manpower schedule.......................................................................................3
ACTIVITY 3B.................................................................................................................................3
3B.1 Calculation of estimated time and standard deviation of activities...............................3
3B.2 Critical path development and estimated project completion time................................5
3B.3 Probability of projecting taking more that 24 weeks.....................................................5
3B.4 Calculate the likelihood of the project, if the job can be completed in 18 weeks.........7
3B.5 Analyse completion time, if 95% of time is required to be done in time......................7
3B.6 Network diagram of the project on the basis of Activity- on – Arrow format..............8
ACTIVITY 3C.................................................................................................................................8
3C.1 Drawing the network diagram for the job......................................................................9
3C.2. Identify the critical path, also determine total cost through both the methods.............9
3C.3 Optimum duration of outage at minimum possible cost..............................................10
CONCLUSION..............................................................................................................................11
REFERENCES..............................................................................................................................12
1
INTRODUCTION
Project planning is the procedure by which managers set their target, define scope, and
identify resources i.e. fund, skilled labour requirement and other to carry out their project
activities and finish it with the set targeted limit (Martinelli and Milosevic, 2016). There are
number of projects i.e. construction, engineering, site development, plant installation, purchase
of new machinery, software designing, repair and maintenance and others which often can be
seen. Many-times, project manager faces some issues regarding project constraints means limited
availability of certain resources i.e. efficient and multi-skilled labors, in such case, they have to
made better resource allocation decision to ensure smooth flow of work and assure the
completion of project within the set time. The aim of the report is to make optimum labor
allocation decisions for the small maintenance project. Besides this, it will also determine the
estimated project time, standard deviation and different probability for the plant improvement
project. Lastly, the report focuses on crashing so as to minimize the completion time at some
additional direct and indirect cost.
ACTIVITY 3A
3A.1 Network diagram with the help of table and distance between the critical path
Network diagram refers to the visual presentation of various project activities, their link
and the completion duration of each and every activity. It helps project manager to find out the
critical path, which is the longest path of the project, still, takes shortest completion duration for
the entire project (Teller, Kock and Gemünden, 2014). On the critical path, no single day of slack
or float is available, it means, such project activities must be finished within the given duration,
if it is delayed then it will resultant in delaying the entire project completion period (Papke
Shields and Boyer-Wright, 2017).
Activit
y
People
require
d at the
same
time
Duratio
n
ES EFT
(Earlies
t Finish
Time)
LS LFT
(Late
Finis
h
Time)
Total
Float
Float
(LFT
–
EFT)
IF
(TF-
FF)
1 to 2 3 1 0 1 4 5 4 0 4
1 to 3 2 3 0 3 0 3 0 0 0
2 to 4 4 2 1 7 5 7 4 4 0
2 to 5 5 3 1 10 7 10 6 6 0
1
⊘ This is a preview!⊘
Do you want full access?
Subscribe today to unlock all pages.
Trusted by 1+ million students worldwide
3 to 4 3 4 3 7 3 7 0 0 0
4 to 5 1 3 7 10 7 10 0 0 0
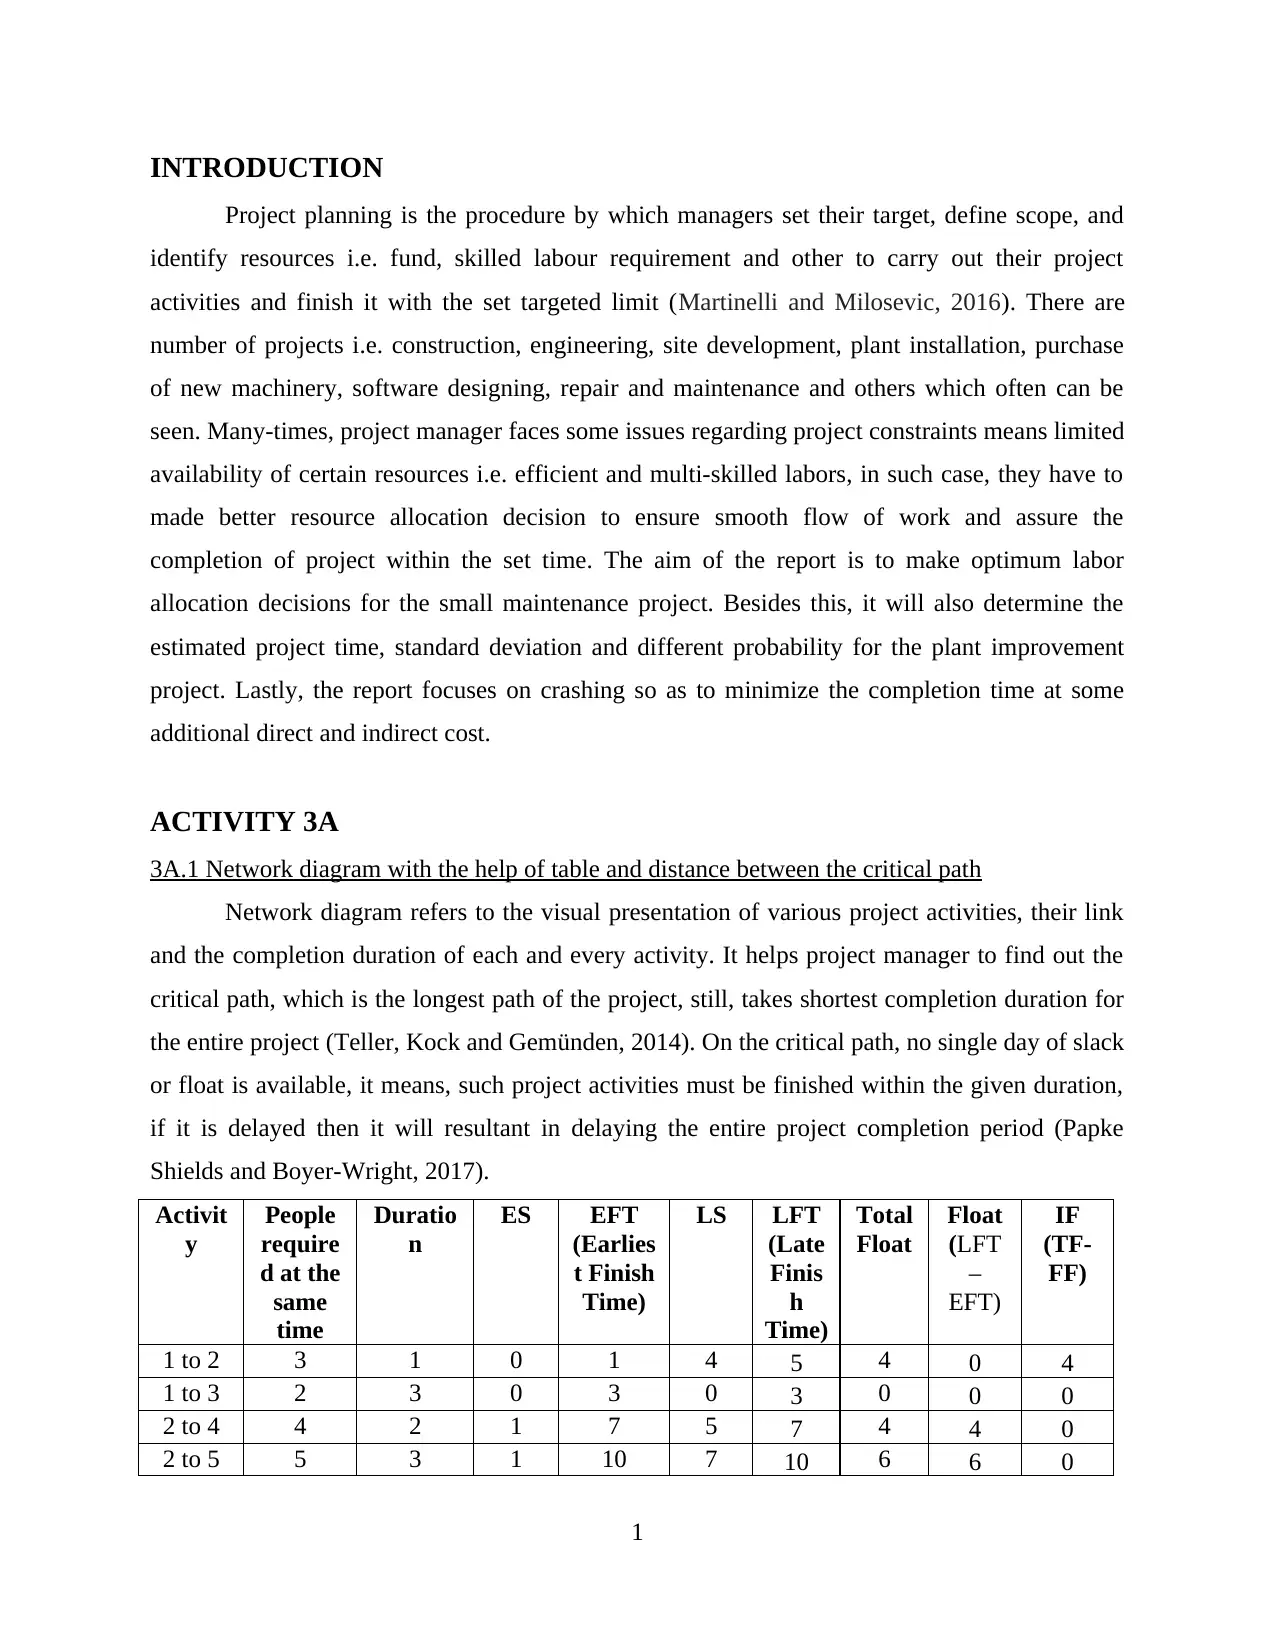
As per the designed network diagram, it can be seen that activity 1-3-4-5 is the critical
path of the given maintenance project, because on all the highlighted activities, there is no float
exists. According to this, project completion duration will be 3 days + 4 days + 3 days = 10
days. There is only activity 2 that is not covered in the critical path on which 4 day slack is
available which means delaying its completion time by 4 days will not have any impact over the
completion period (Bingham and Gibson Jr, 2016).
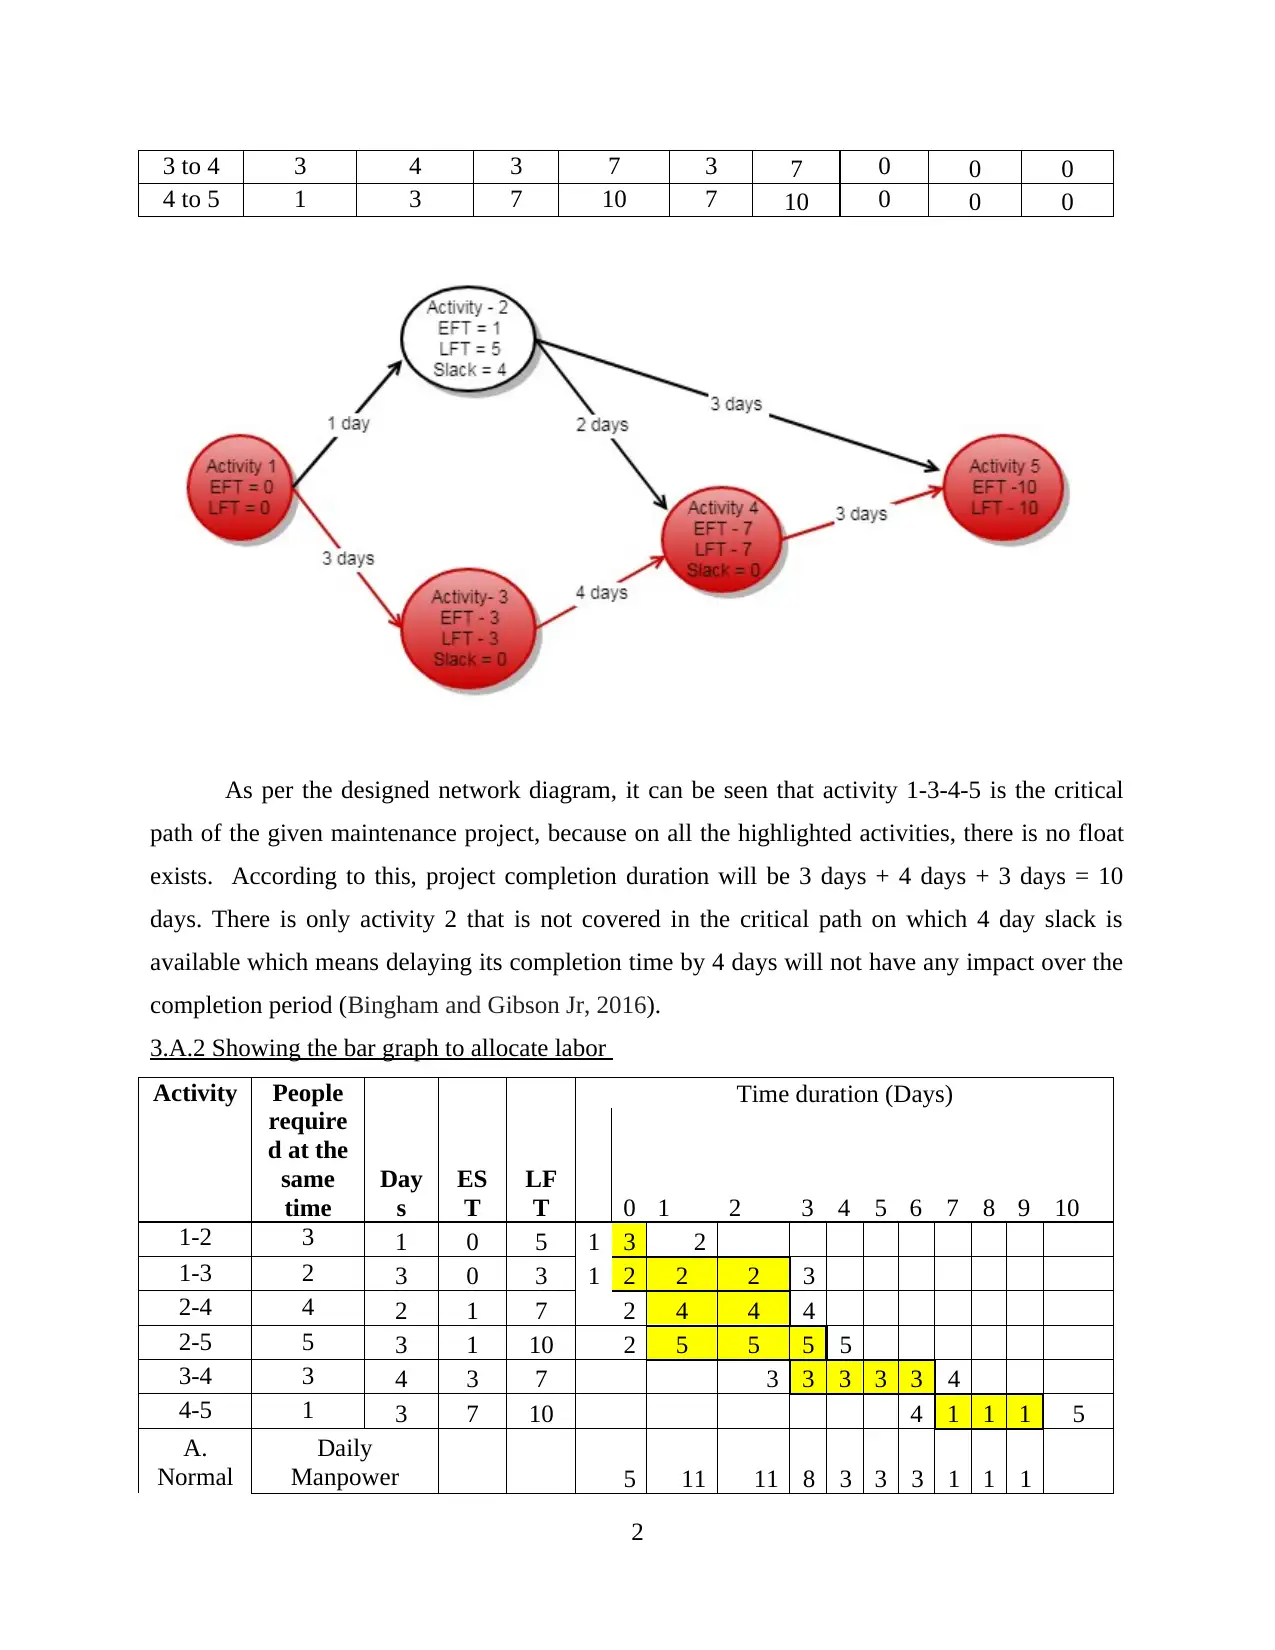
3.A.2 Showing the bar graph to allocate labor
Activity People
require
d at the
same
time
Day
s
ES
T
LF
T
Time duration (Days)
0 1 2 3 4 5 6 7 8 9 10
1-2 3 1 0 5 1 3 2
1-3 2 3 0 3 1 2 2 2 3
2-4 4 2 1 7 2 4 4 4
2-5 5 3 1 10 2 5 5 5 5
3-4 3 4 3 7 3 3 3 3 3 4
4-5 1 3 7 10 4 1 1 1 5
A.
Normal
Daily
Manpower 5 11 11 8 3 3 3 1 1 1
2
4 to 5 1 3 7 10 7 10 0 0 0
As per the designed network diagram, it can be seen that activity 1-3-4-5 is the critical
path of the given maintenance project, because on all the highlighted activities, there is no float
exists. According to this, project completion duration will be 3 days + 4 days + 3 days = 10
days. There is only activity 2 that is not covered in the critical path on which 4 day slack is
available which means delaying its completion time by 4 days will not have any impact over the
completion period (Bingham and Gibson Jr, 2016).
3.A.2 Showing the bar graph to allocate labor
Activity People
require
d at the
same
time
Day
s
ES
T
LF
T
Time duration (Days)
0 1 2 3 4 5 6 7 8 9 10
1-2 3 1 0 5 1 3 2
1-3 2 3 0 3 1 2 2 2 3
2-4 4 2 1 7 2 4 4 4
2-5 5 3 1 10 2 5 5 5 5
3-4 3 4 3 7 3 3 3 3 3 4
4-5 1 3 7 10 4 1 1 1 5
A.
Normal
Daily
Manpower 5 11 11 8 3 3 3 1 1 1
2
Paraphrase This Document
Need a fresh take? Get an instant paraphrase of this document with our AI Paraphraser
schedule Schedule (A)
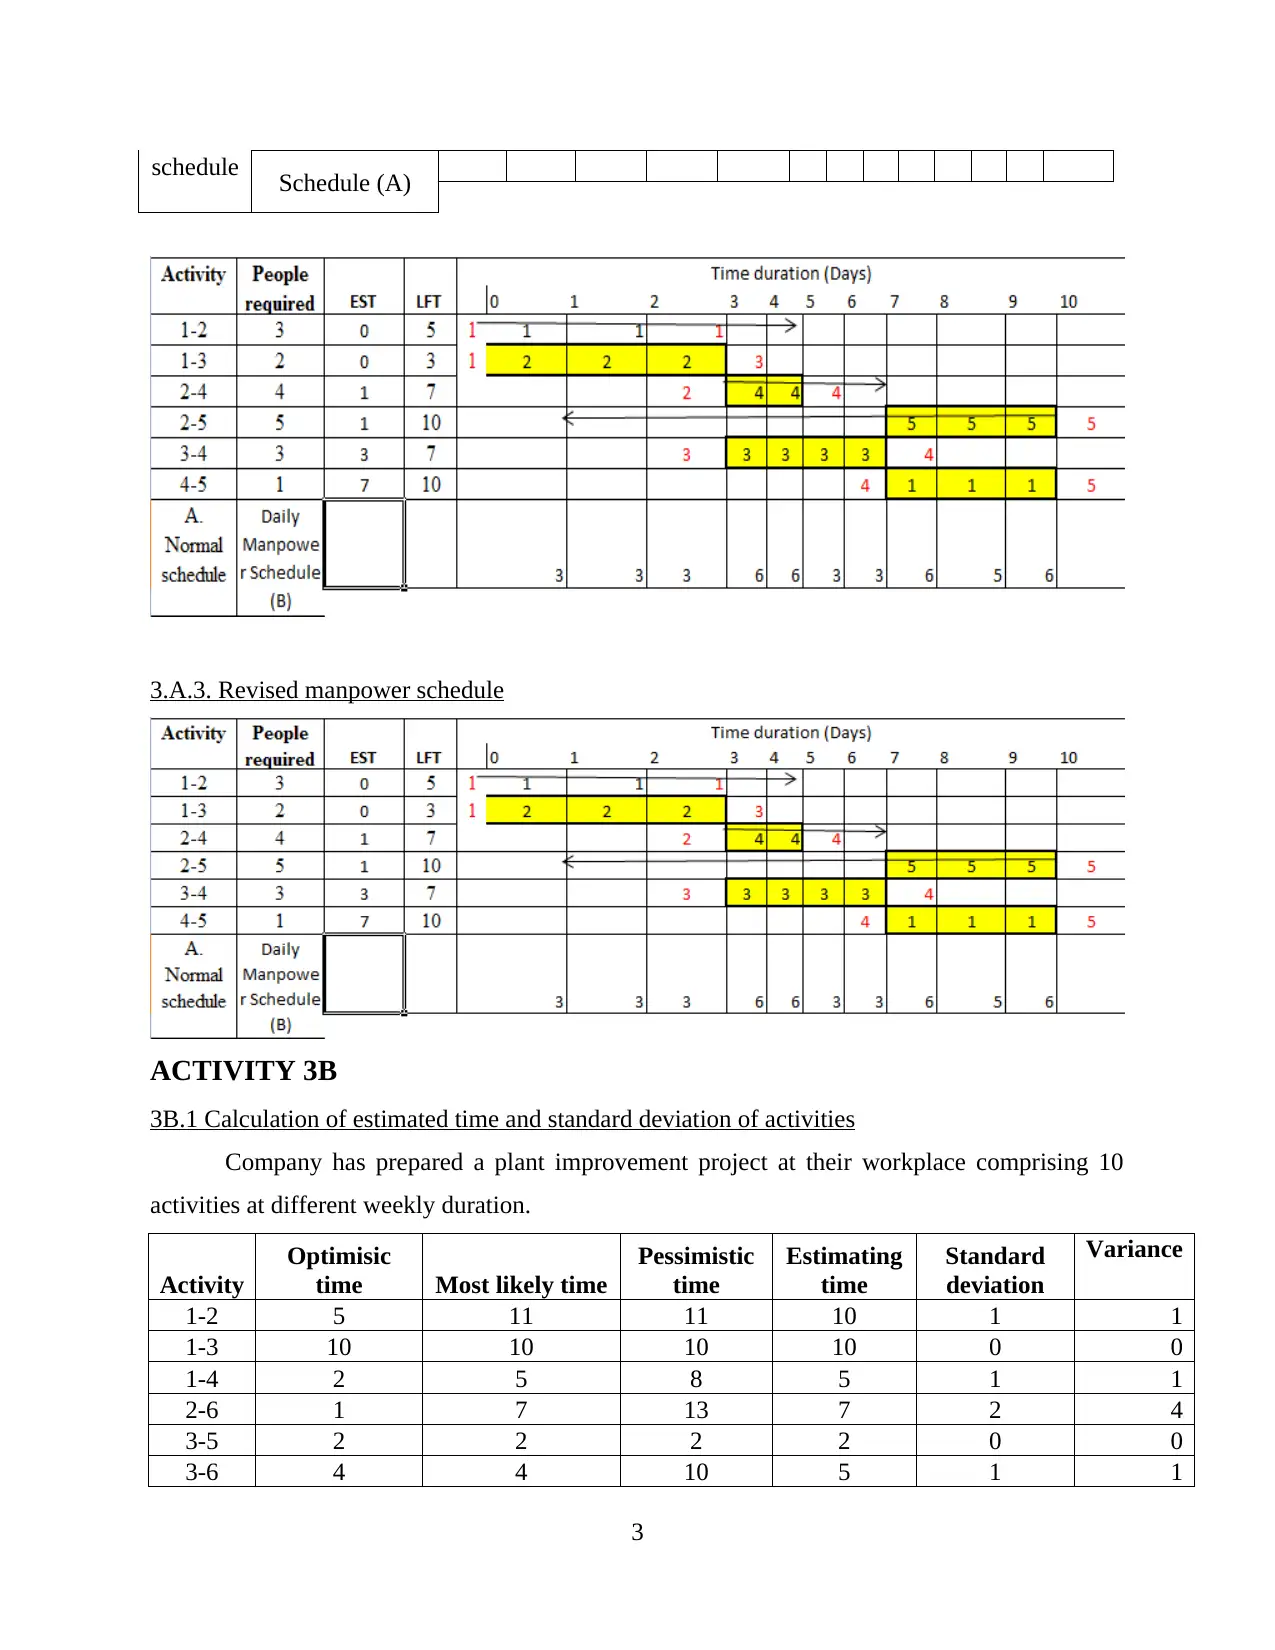
3.A.3. Revised manpower schedule
ACTIVITY 3B
3B.1 Calculation of estimated time and standard deviation of activities
Company has prepared a plant improvement project at their workplace comprising 10
activities at different weekly duration.
Activity
Optimisic
time Most likely time
Pessimistic
time
Estimating
time
Standard
deviation
Variance
1-2 5 11 11 10 1 1
1-3 10 10 10 10 0 0
1-4 2 5 8 5 1 1
2-6 1 7 13 7 2 4
3-5 2 2 2 2 0 0
3-6 4 4 10 5 1 1
3
3-7 4 7 10 7 1 1
4-5 0 6 6 5 1 1
5-7 2 8 14 8 2 4
6-7 1 4 7 4 1 1
Mean
duration =
63 weeks
Standard
deviation =
10 weeks
Estimated time = Three point-estimating method
[O + 4 M + P] / 6
Where O = optimistic time
P = Pessimistic time
M = Most likely
Standard deviation (σ) = [P- O]/ 6
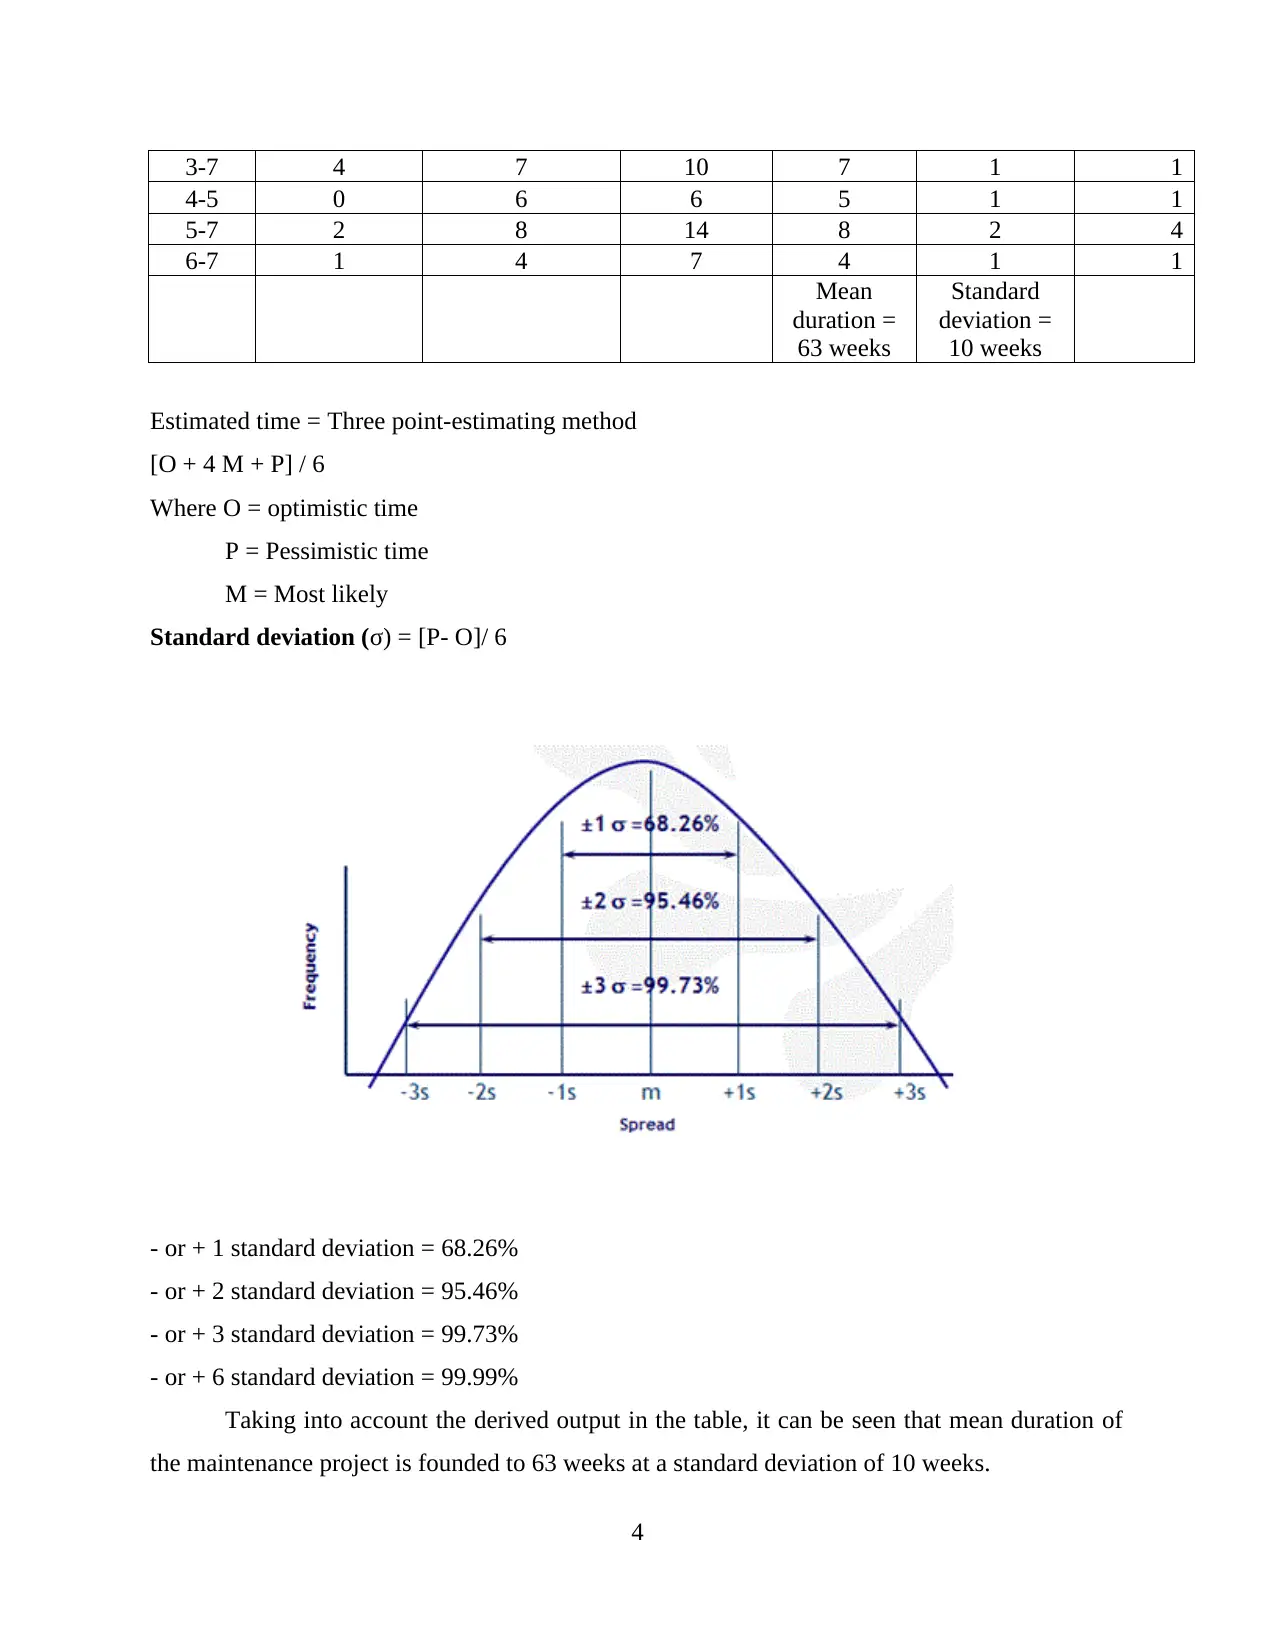
- or + 1 standard deviation = 68.26%
- or + 2 standard deviation = 95.46%
- or + 3 standard deviation = 99.73%
- or + 6 standard deviation = 99.99%
Taking into account the derived output in the table, it can be seen that mean duration of
the maintenance project is founded to 63 weeks at a standard deviation of 10 weeks.
4
4-5 0 6 6 5 1 1
5-7 2 8 14 8 2 4
6-7 1 4 7 4 1 1
Mean
duration =
63 weeks
Standard
deviation =
10 weeks
Estimated time = Three point-estimating method
[O + 4 M + P] / 6
Where O = optimistic time
P = Pessimistic time
M = Most likely
Standard deviation (σ) = [P- O]/ 6
- or + 1 standard deviation = 68.26%
- or + 2 standard deviation = 95.46%
- or + 3 standard deviation = 99.73%
- or + 6 standard deviation = 99.99%
Taking into account the derived output in the table, it can be seen that mean duration of
the maintenance project is founded to 63 weeks at a standard deviation of 10 weeks.
4
⊘ This is a preview!⊘
Do you want full access?
Subscribe today to unlock all pages.
Trusted by 1+ million students worldwide
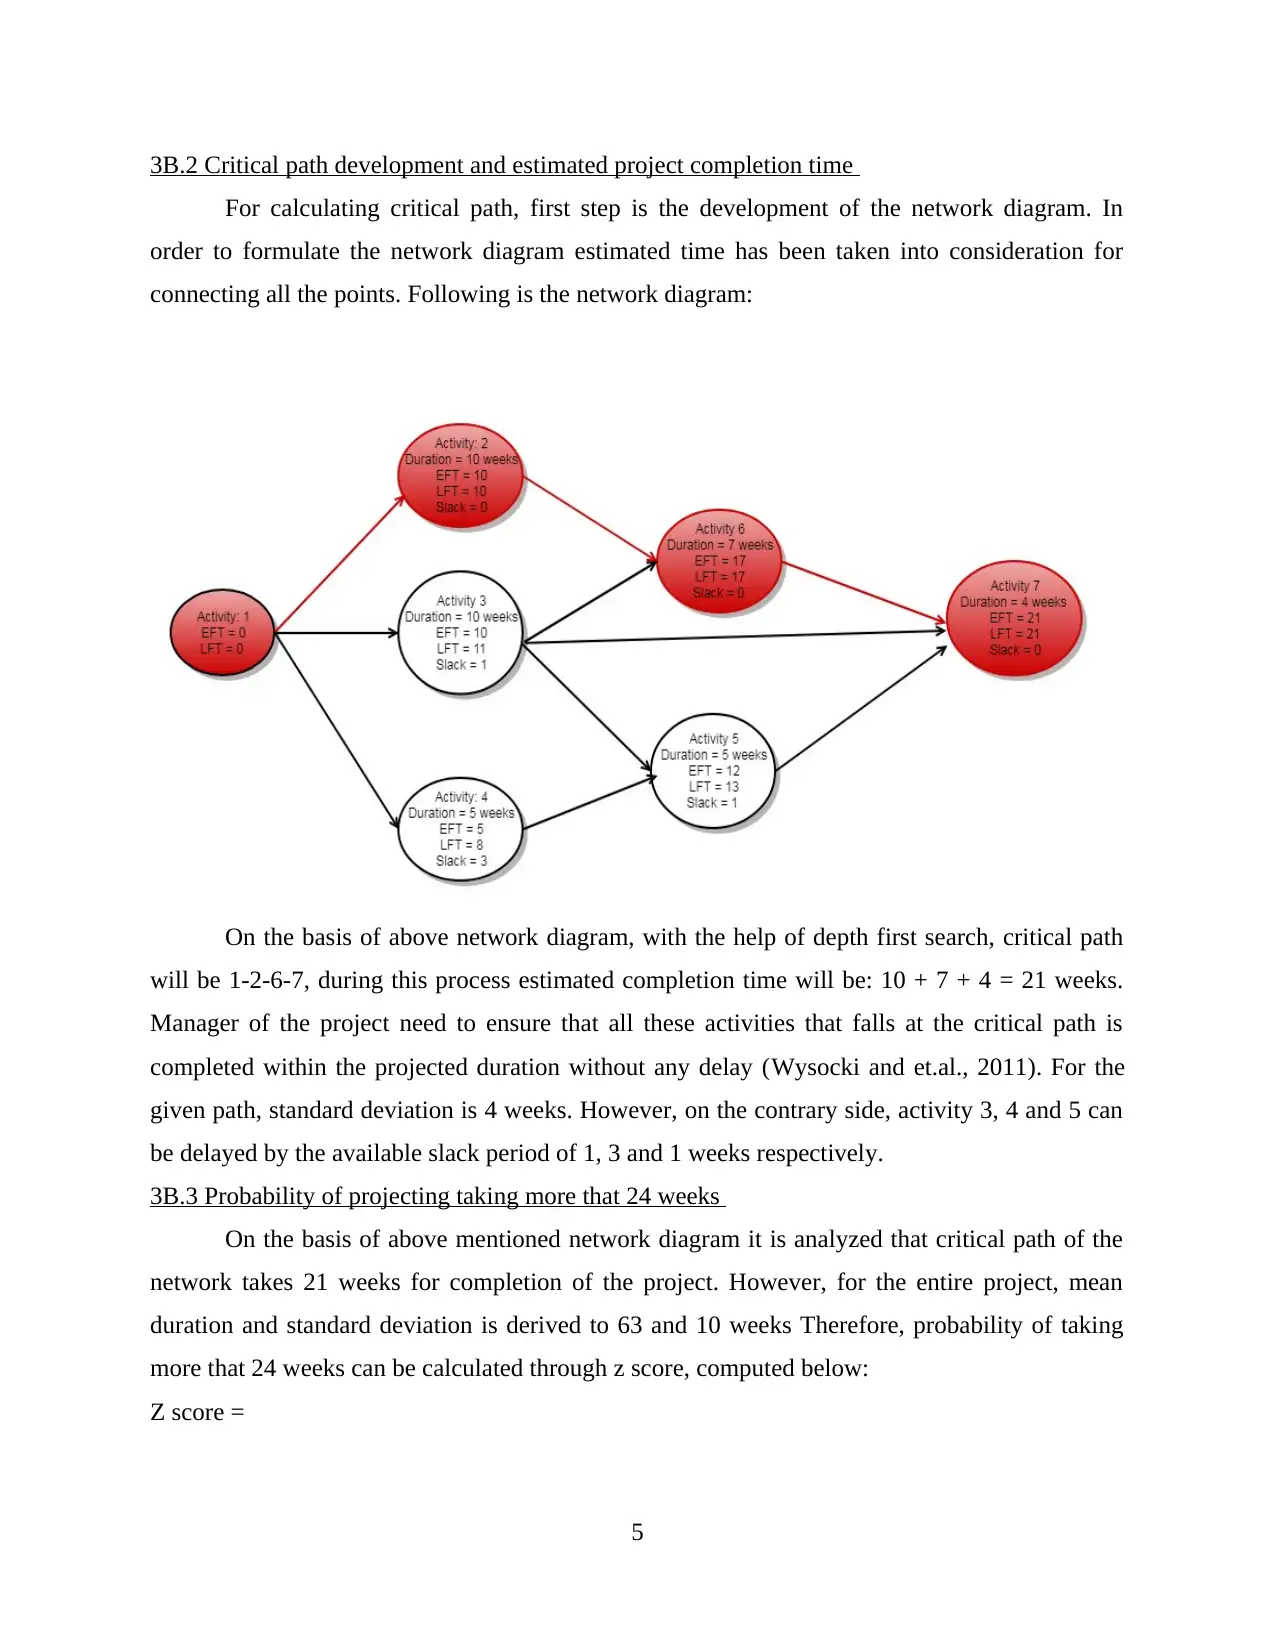
3B.2 Critical path development and estimated project completion time
For calculating critical path, first step is the development of the network diagram. In
order to formulate the network diagram estimated time has been taken into consideration for
connecting all the points. Following is the network diagram:
On the basis of above network diagram, with the help of depth first search, critical path
will be 1-2-6-7, during this process estimated completion time will be: 10 + 7 + 4 = 21 weeks.
Manager of the project need to ensure that all these activities that falls at the critical path is
completed within the projected duration without any delay (Wysocki and et.al., 2011). For the
given path, standard deviation is 4 weeks. However, on the contrary side, activity 3, 4 and 5 can
be delayed by the available slack period of 1, 3 and 1 weeks respectively.
3B.3 Probability of projecting taking more that 24 weeks
On the basis of above mentioned network diagram it is analyzed that critical path of the
network takes 21 weeks for completion of the project. However, for the entire project, mean
duration and standard deviation is derived to 63 and 10 weeks Therefore, probability of taking
more that 24 weeks can be calculated through z score, computed below:
Z score =
5
Paraphrase This Document
Need a fresh take? Get an instant paraphrase of this document with our AI Paraphraser
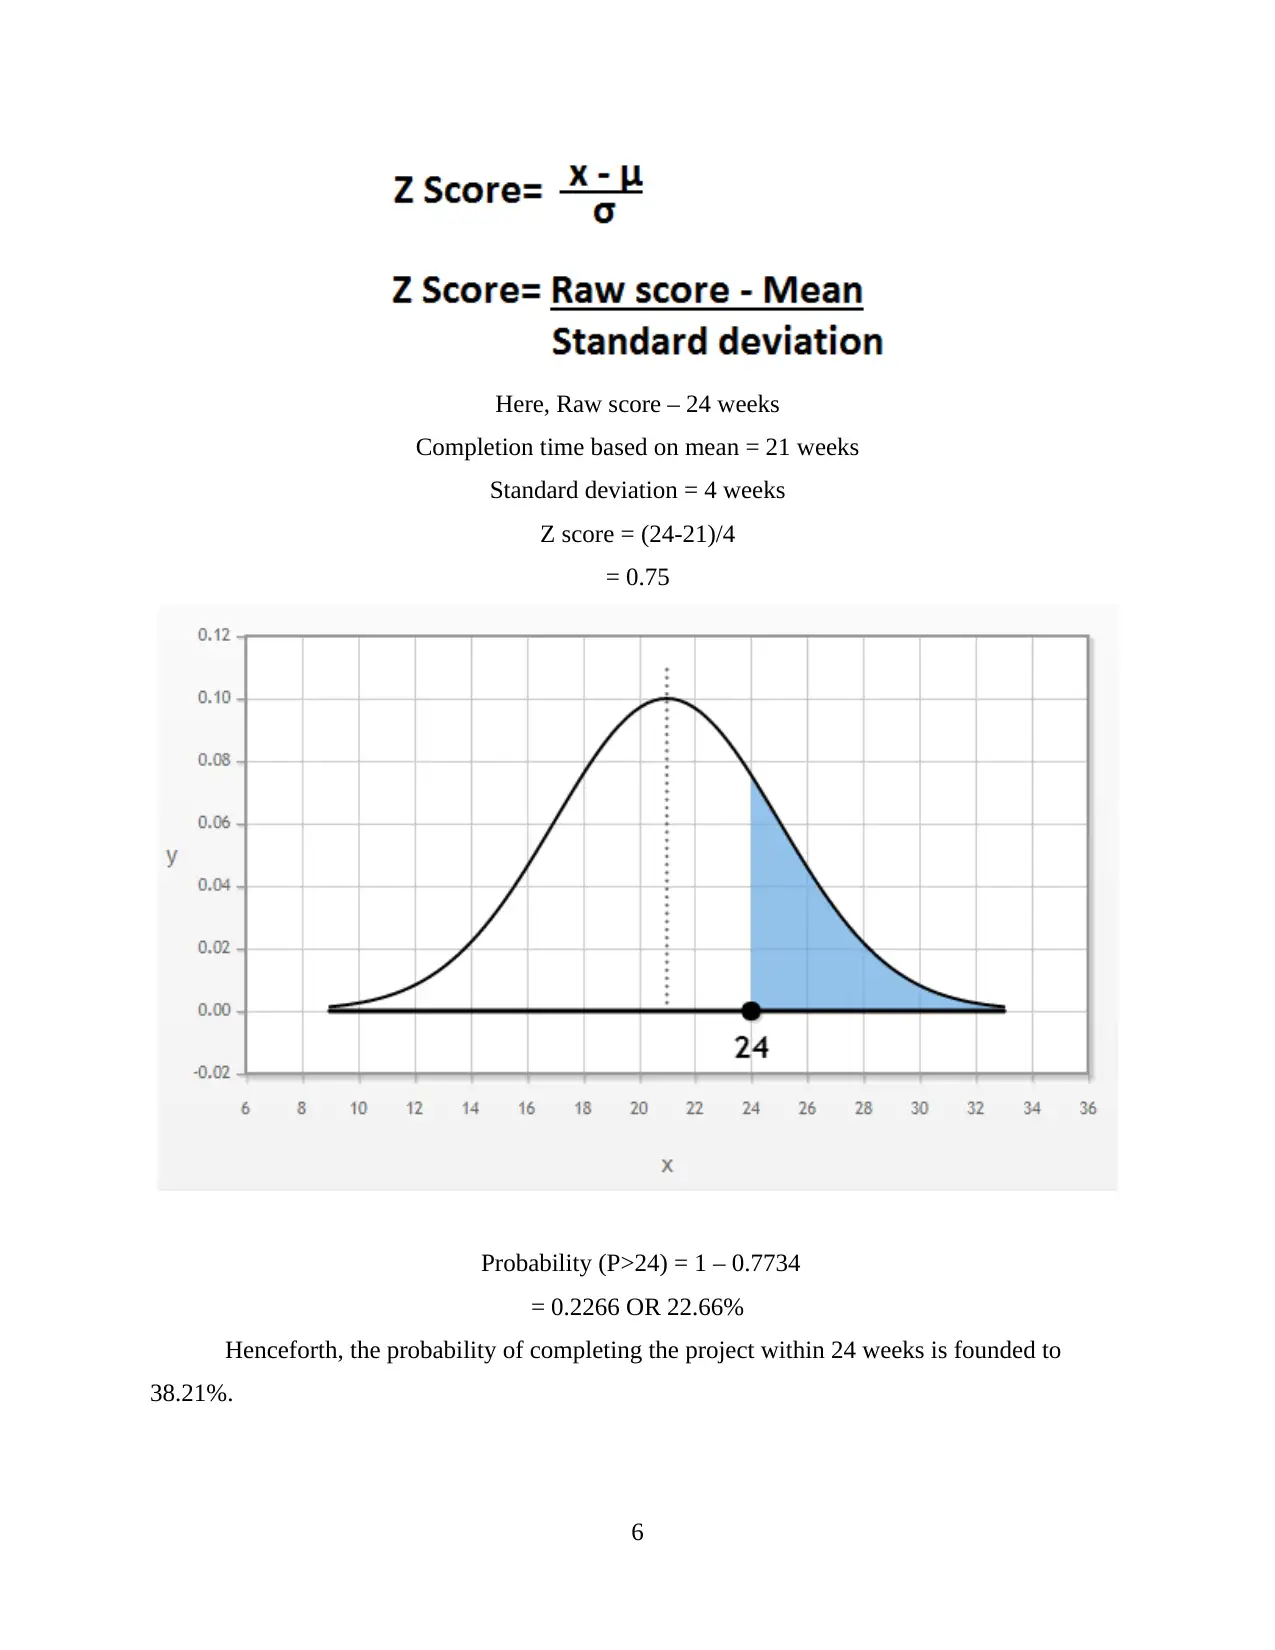
Here, Raw score – 24 weeks
Completion time based on mean = 21 weeks
Standard deviation = 4 weeks
Z score = (24-21)/4
= 0.75
Probability (P>24) = 1 – 0.7734
= 0.2266 OR 22.66%
Henceforth, the probability of completing the project within 24 weeks is founded to
38.21%.
6
Completion time based on mean = 21 weeks
Standard deviation = 4 weeks
Z score = (24-21)/4
= 0.75
Probability (P>24) = 1 – 0.7734
= 0.2266 OR 22.66%
Henceforth, the probability of completing the project within 24 weeks is founded to
38.21%.
6
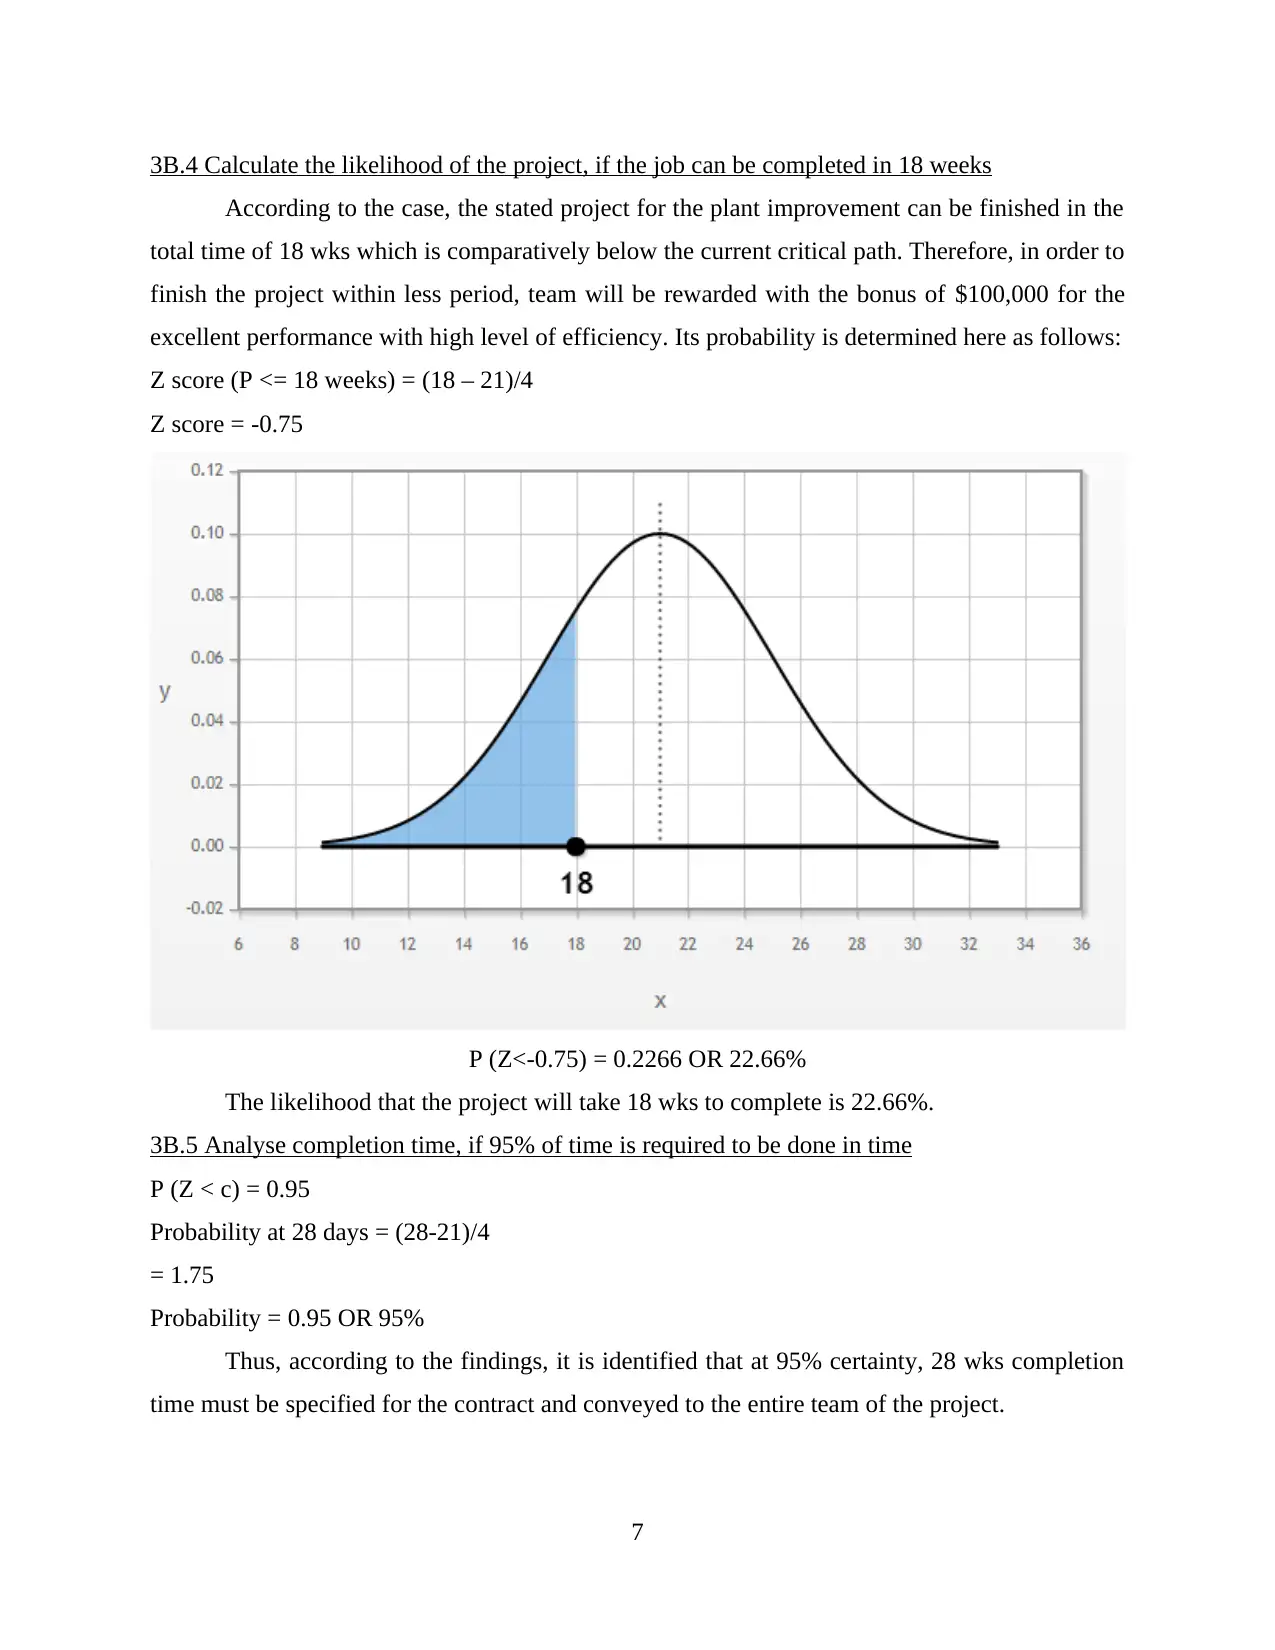
3B.4 Calculate the likelihood of the project, if the job can be completed in 18 weeks
According to the case, the stated project for the plant improvement can be finished in the
total time of 18 wks which is comparatively below the current critical path. Therefore, in order to
finish the project within less period, team will be rewarded with the bonus of $100,000 for the
excellent performance with high level of efficiency. Its probability is determined here as follows:
Z score (P <= 18 weeks) = (18 – 21)/4
Z score = -0.75
P (Z<-0.75) = 0.2266 OR 22.66%
The likelihood that the project will take 18 wks to complete is 22.66%.
3B.5 Analyse completion time, if 95% of time is required to be done in time
P (Z < c) = 0.95
Probability at 28 days = (28-21)/4
= 1.75
Probability = 0.95 OR 95%
Thus, according to the findings, it is identified that at 95% certainty, 28 wks completion
time must be specified for the contract and conveyed to the entire team of the project.
7
⊘ This is a preview!⊘
Do you want full access?
Subscribe today to unlock all pages.
Trusted by 1+ million students worldwide
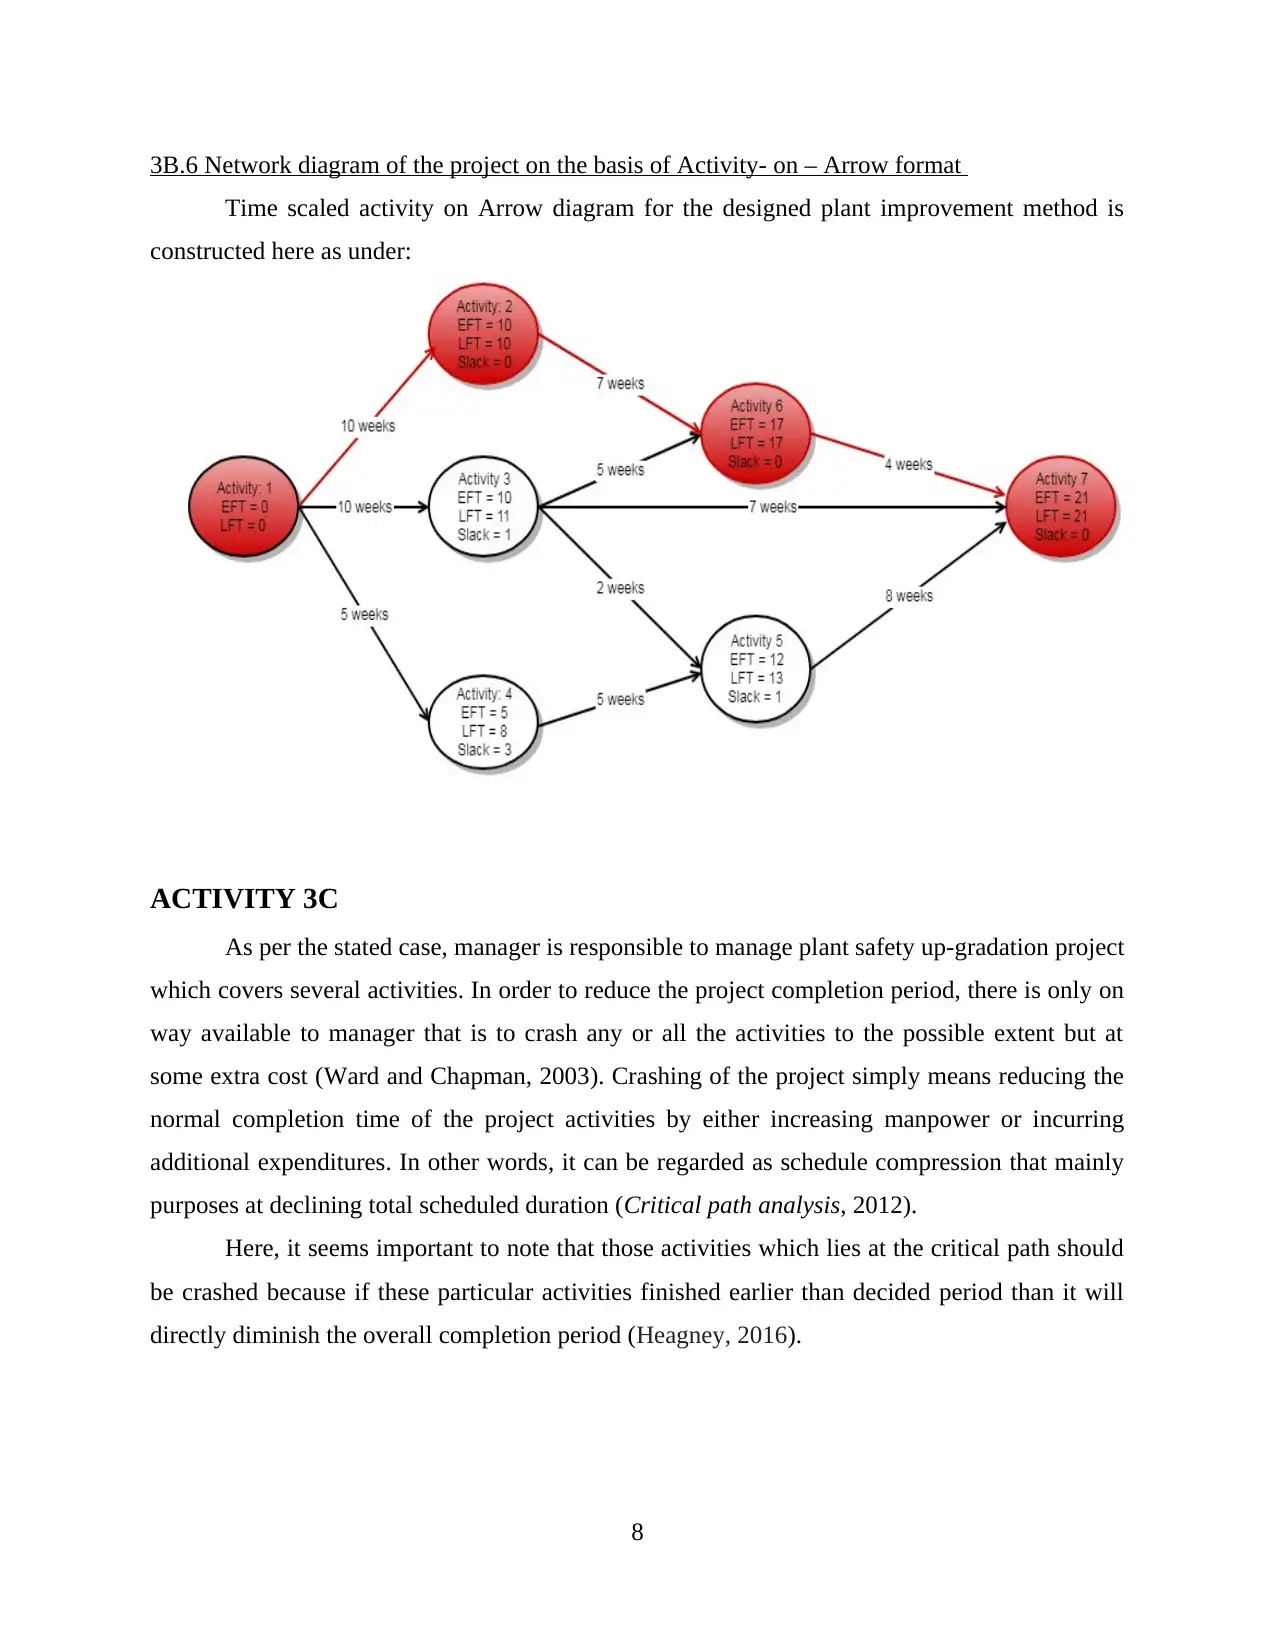
3B.6 Network diagram of the project on the basis of Activity- on – Arrow format
Time scaled activity on Arrow diagram for the designed plant improvement method is
constructed here as under:
ACTIVITY 3C
As per the stated case, manager is responsible to manage plant safety up-gradation project
which covers several activities. In order to reduce the project completion period, there is only on
way available to manager that is to crash any or all the activities to the possible extent but at
some extra cost (Ward and Chapman, 2003). Crashing of the project simply means reducing the
normal completion time of the project activities by either increasing manpower or incurring
additional expenditures. In other words, it can be regarded as schedule compression that mainly
purposes at declining total scheduled duration (Critical path analysis, 2012).
Here, it seems important to note that those activities which lies at the critical path should
be crashed because if these particular activities finished earlier than decided period than it will
directly diminish the overall completion period (Heagney, 2016).
8
Paraphrase This Document
Need a fresh take? Get an instant paraphrase of this document with our AI Paraphraser
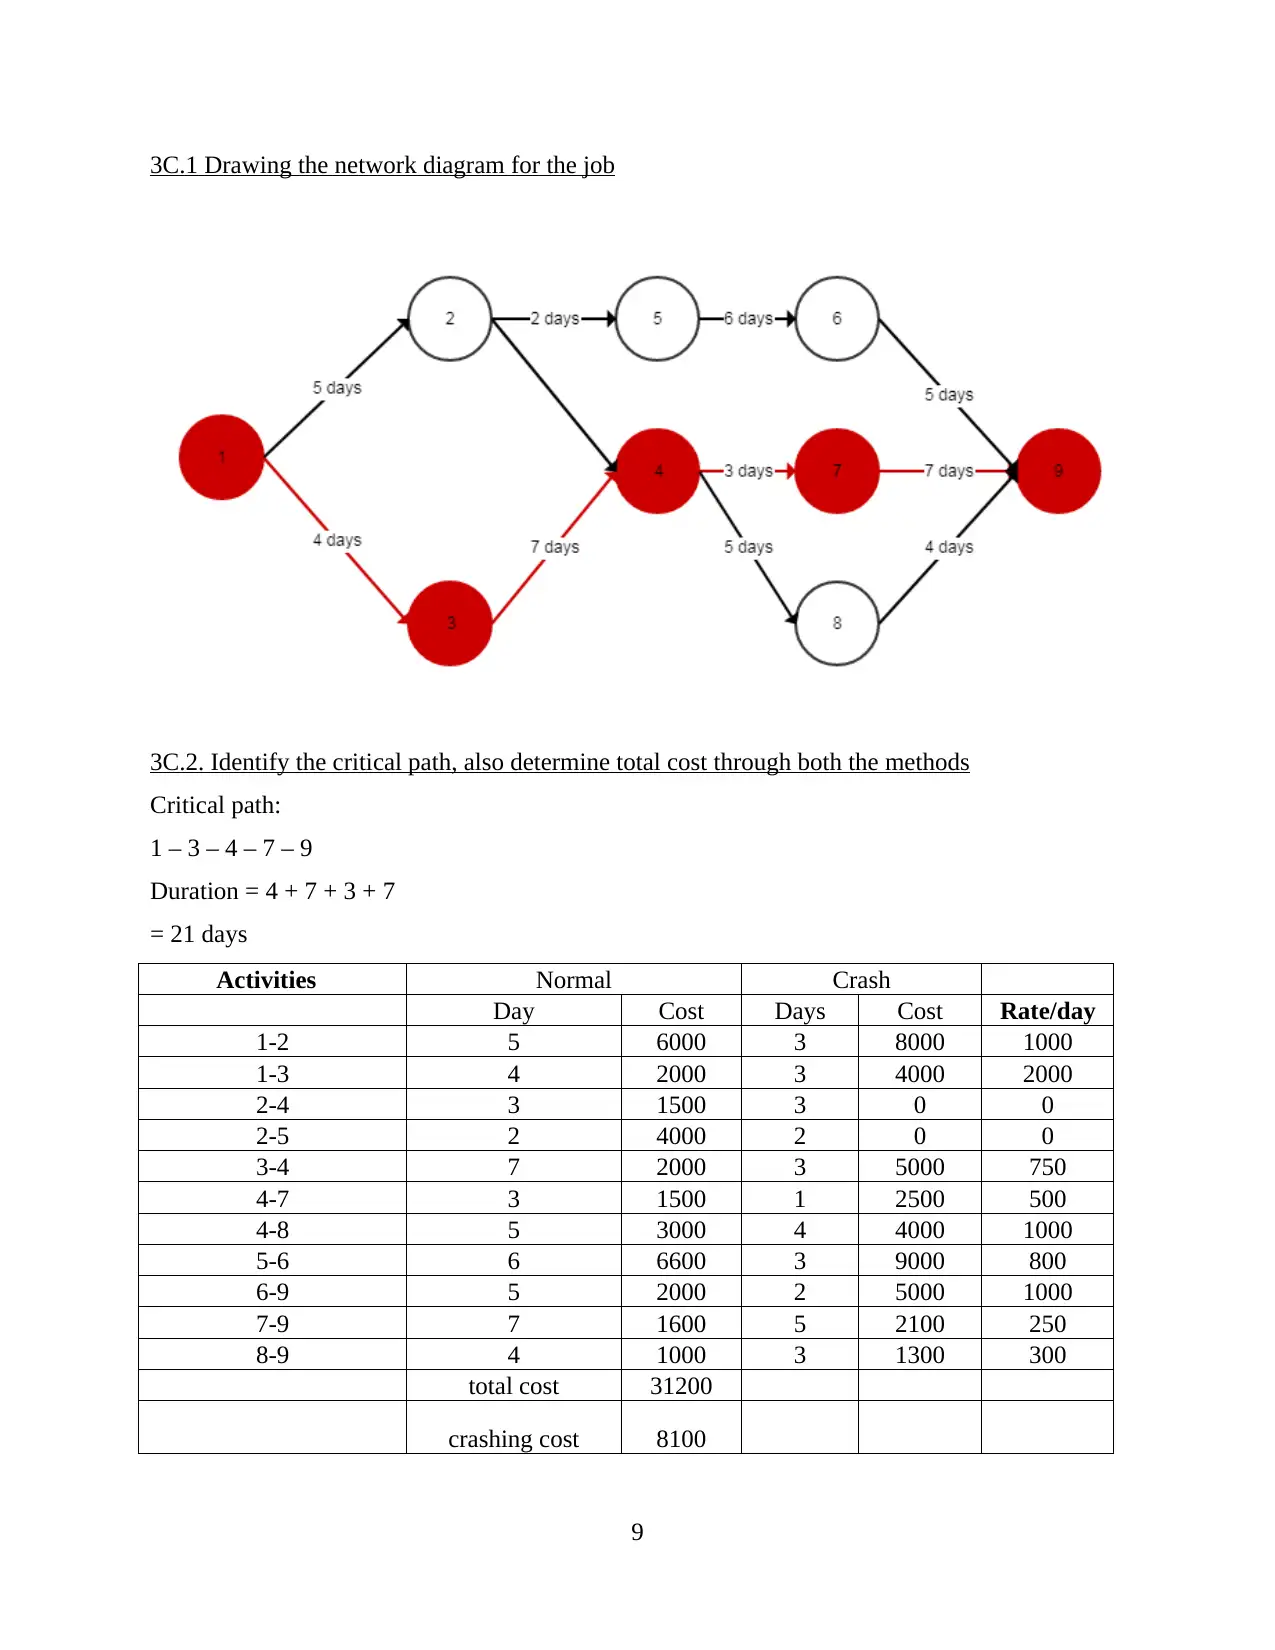
3C.1 Drawing the network diagram for the job
3C.2. Identify the critical path, also determine total cost through both the methods
Critical path:
1 – 3 – 4 – 7 – 9
Duration = 4 + 7 + 3 + 7
= 21 days
Activities Normal Crash
Day Cost Days Cost Rate/day
1-2 5 6000 3 8000 1000
1-3 4 2000 3 4000 2000
2-4 3 1500 3 0 0
2-5 2 4000 2 0 0
3-4 7 2000 3 5000 750
4-7 3 1500 1 2500 500
4-8 5 3000 4 4000 1000
5-6 6 6600 3 9000 800
6-9 5 2000 2 5000 1000
7-9 7 1600 5 2100 250
8-9 4 1000 3 1300 300
total cost 31200
crashing cost 8100
9
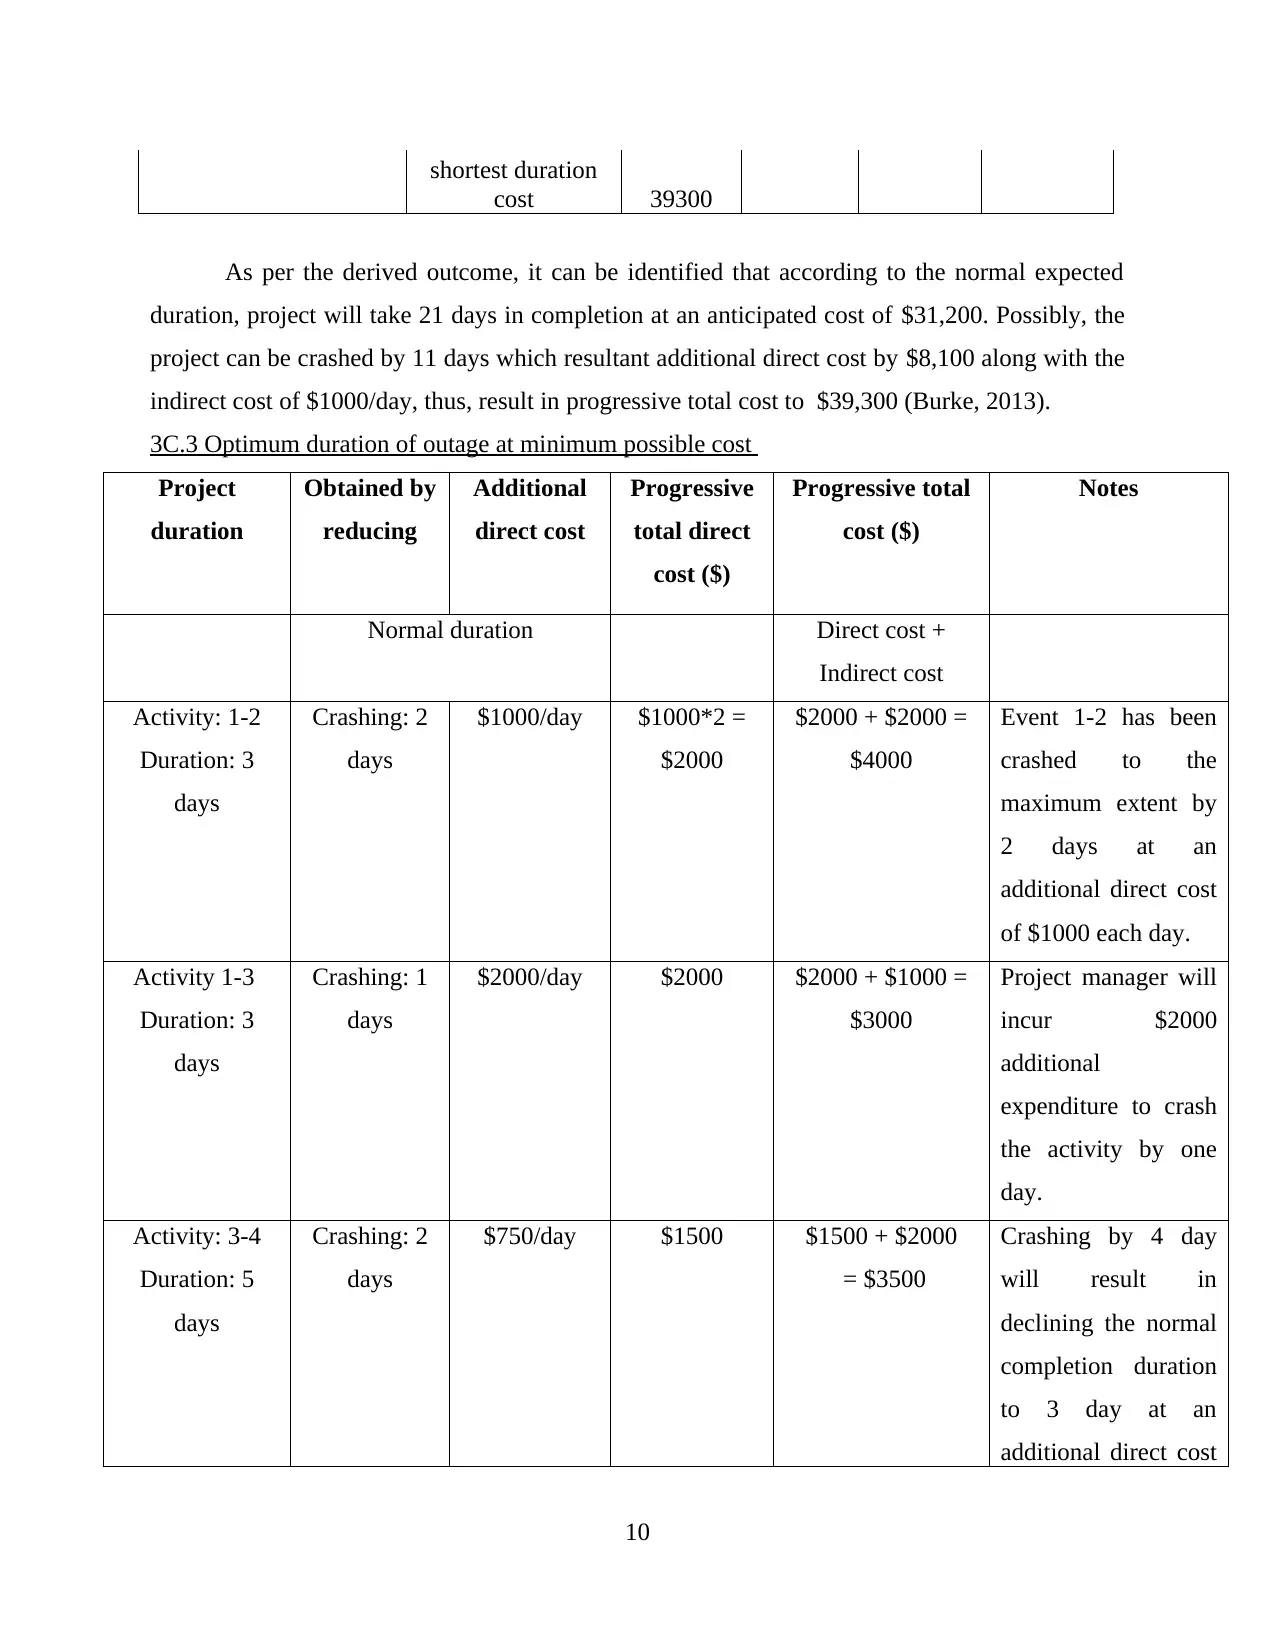
shortest duration
cost 39300
As per the derived outcome, it can be identified that according to the normal expected
duration, project will take 21 days in completion at an anticipated cost of $31,200. Possibly, the
project can be crashed by 11 days which resultant additional direct cost by $8,100 along with the
indirect cost of $1000/day, thus, result in progressive total cost to $39,300 (Burke, 2013).
3C.3 Optimum duration of outage at minimum possible cost
Project
duration
Obtained by
reducing
Additional
direct cost
Progressive
total direct
cost ($)
Progressive total
cost ($)
Notes
Normal duration Direct cost +
Indirect cost
Activity: 1-2
Duration: 3
days
Crashing: 2
days
$1000/day $1000*2 =
$2000
$2000 + $2000 =
$4000
Event 1-2 has been
crashed to the
maximum extent by
2 days at an
additional direct cost
of $1000 each day.
Activity 1-3
Duration: 3
days
Crashing: 1
days
$2000/day $2000 $2000 + $1000 =
$3000
Project manager will
incur $2000
additional
expenditure to crash
the activity by one
day.
Activity: 3-4
Duration: 5
days
Crashing: 2
days
$750/day $1500 $1500 + $2000
= $3500
Crashing by 4 day
will result in
declining the normal
completion duration
to 3 day at an
additional direct cost
10
⊘ This is a preview!⊘
Do you want full access?
Subscribe today to unlock all pages.
Trusted by 1+ million students worldwide
1 out of 14
Related Documents


Your All-in-One AI-Powered Toolkit for Academic Success.
+13062052269
info@desklib.com
Available 24*7 on WhatsApp / Email
![[object Object]](/_next/static/media/star-bottom.7253800d.svg)
Unlock your academic potential
Copyright © 2020–2026 A2Z Services. All Rights Reserved. Developed and managed by ZUCOL.