Controlling Project Performance (Time, Cost, Scope) Analysis Report

Verified

Added on  2022/07/27

|4
|296
|46
Homework Assignment
AI Summary
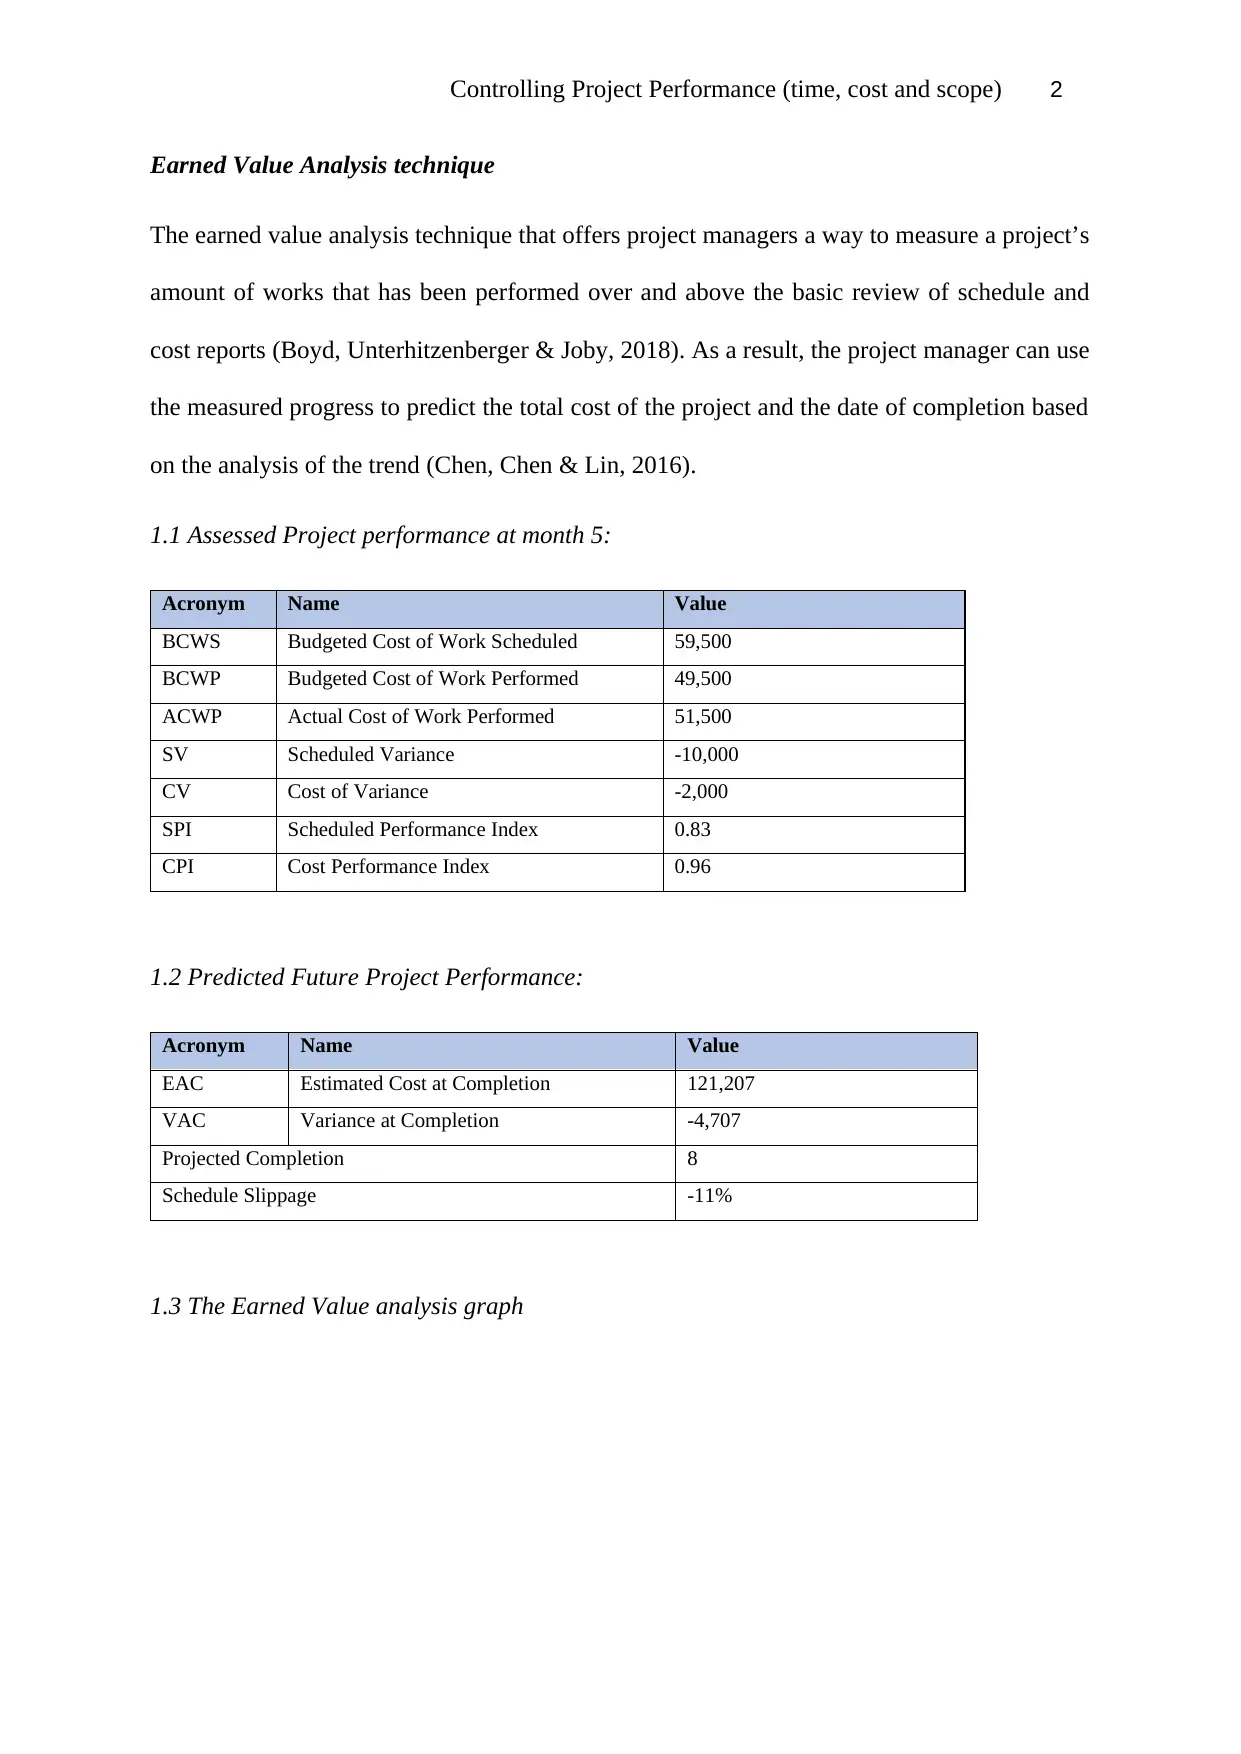
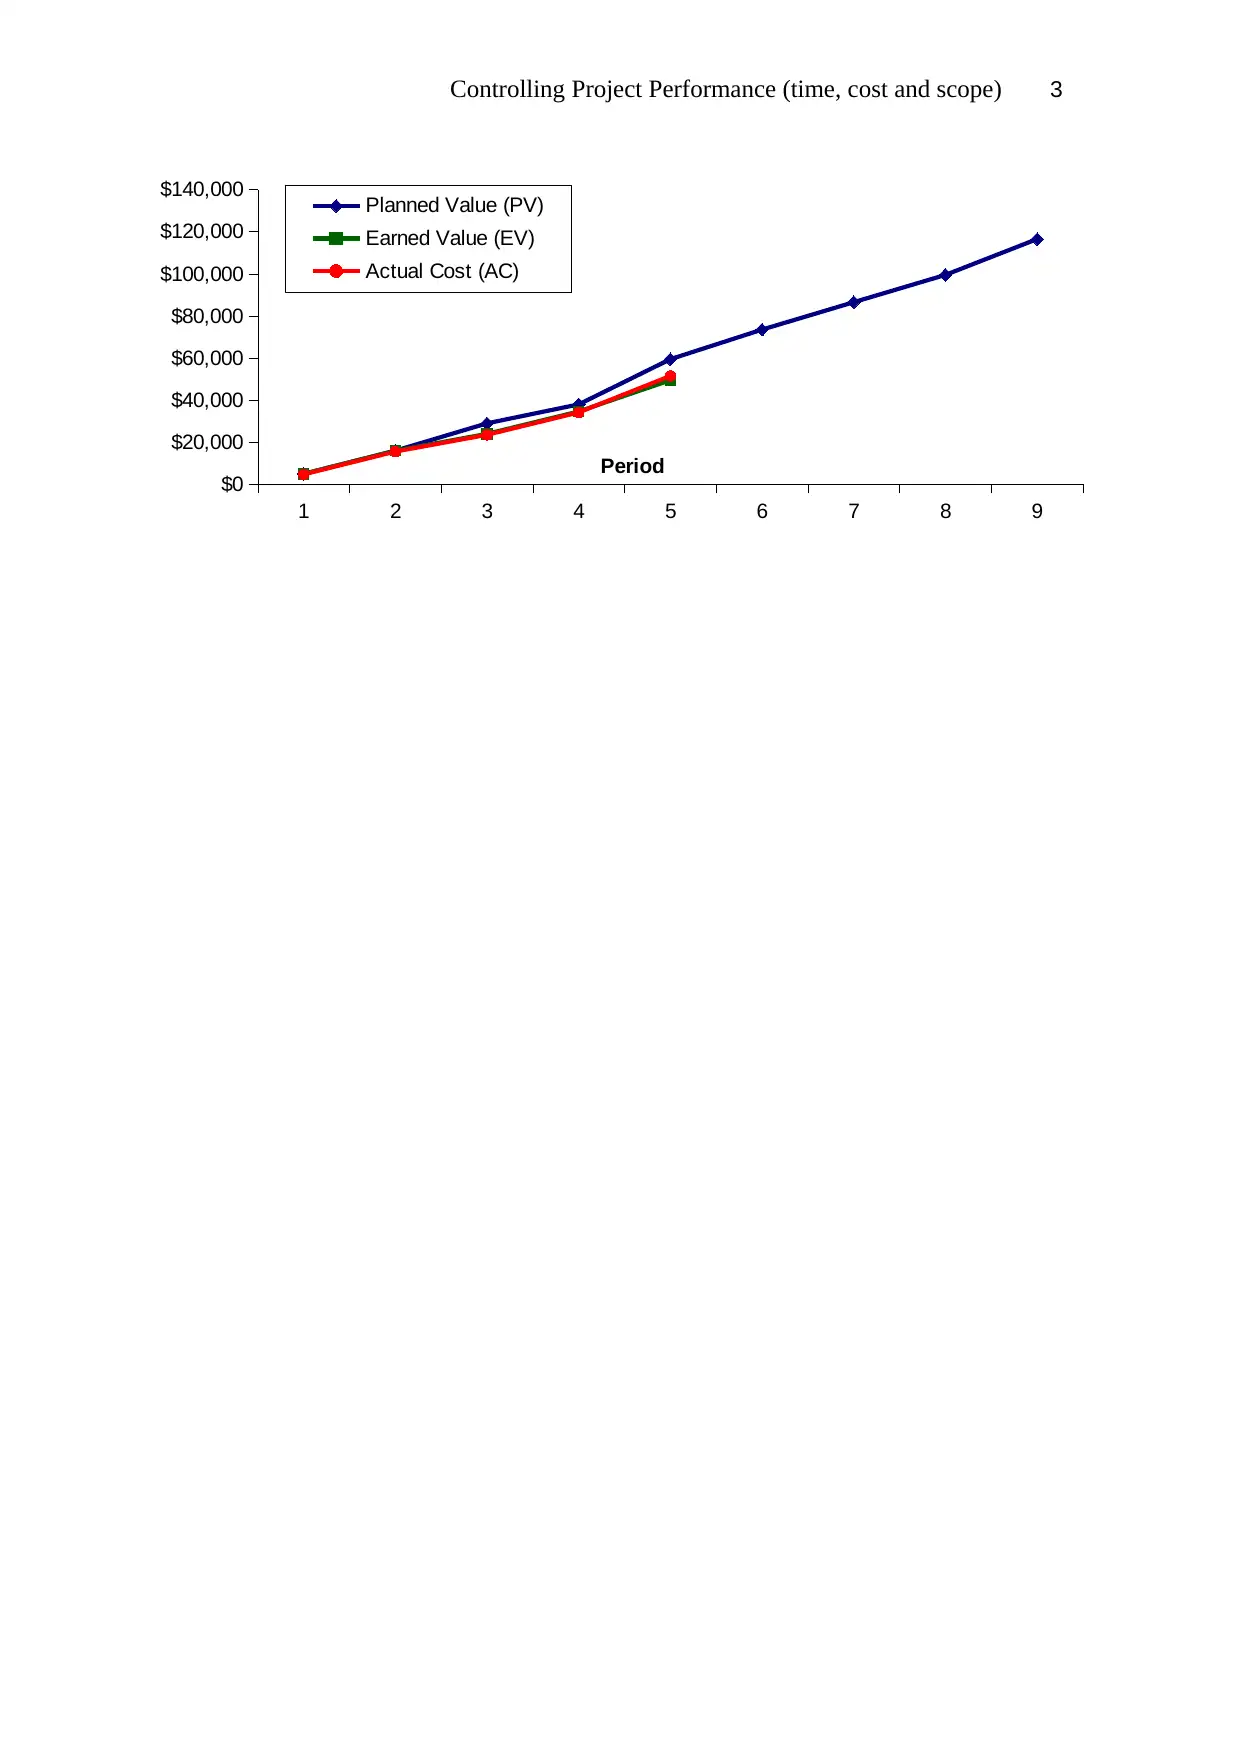
This assignment solution focuses on controlling project performance, specifically addressing time, cost, and scope management using the Earned Value Analysis (EVA) technique. The solution includes an analysis of a project's progress at month 5, providing values for BCWS, BCWP, ACWP, SV, CV, SPI, and CPI. Based on these metrics, the solution predicts future project performance, including EAC, VAC, and projected completion, along with schedule slippage. The assignment utilizes the data provided in the assignment brief, calculating and interpreting key performance indicators to assess the project's current status and forecast its final outcomes. The analysis demonstrates how EVA helps project managers to measure work performed, predict total costs, and estimate the completion date. Supporting references are also included.
Document Page
Running Header: Controlling Project Performance (time, cost and scope) 1
Students Name:
Students ID:
Institution:
Controlling Project Performance (time, cost and scope)
tabler-icon-diamond-filled.svg

Paraphrase This Document

Need a fresh take? Get an instant paraphrase of this document with our AI Paraphraser
Document Page
Controlling Project Performance (time, cost and scope) 2
Earned Value Analysis technique
The earned value analysis technique that offers project managers a way to measure a project’s
amount of works that has been performed over and above the basic review of schedule and
cost reports (Boyd, Unterhitzenberger & Joby, 2018). As a result, the project manager can use
the measured progress to predict the total cost of the project and the date of completion based
on the analysis of the trend (Chen, Chen & Lin, 2016).
1.1 Assessed Project performance at month 5:
Acronym Name Value
BCWS Budgeted Cost of Work Scheduled 59,500
BCWP Budgeted Cost of Work Performed 49,500
ACWP Actual Cost of Work Performed 51,500
SV Scheduled Variance -10,000
CV Cost of Variance -2,000
SPI Scheduled Performance Index 0.83
CPI Cost Performance Index 0.96
1.2 Predicted Future Project Performance:
Acronym Name Value
EAC Estimated Cost at Completion 121,207
VAC Variance at Completion -4,707
Projected Completion 8
Schedule Slippage -11%
1.3 The Earned Value analysis graph
Document Page
Controlling Project Performance (time, cost and scope) 3
1 2 3 4 5 6 7 8 9
$0
$20,000
$40,000
$60,000
$80,000
$100,000
$120,000
$140,000 Planned Value (PV)
Earned Value (EV)
Actual Cost (AC)
Period
Document Page
Controlling Project Performance (time, cost and scope) 4
Reference
Bryde, D., Unterhitzenberger, C. and Joby, R., 2018. Conditions of success for earned value
analysis in projects. International Journal of Project Management, 36(3), pp.474-
484.
Chen, H.L., Chen, W.T. and Lin, Y.L., 2016. Earned value project management: Improving
the predictive power of planned value. International Journal of Project
Management, 34(1), pp.22-29.
chevron_up_icon
1 out of 4
circle_padding
hide_on_mobile
zoom_out_icon
[object Object]